


 |
市場調查報告書
商品編碼
1911338
汽車引擎機油:市場佔有率分析、產業趨勢與統計、成長預測(2026-2031)Automotive Engine Oils - Market Share Analysis, Industry Trends & Statistics, Growth Forecasts (2026 - 2031) |
||||||
※ 本網頁內容可能與最新版本有所差異。詳細情況請與我們聯繫。
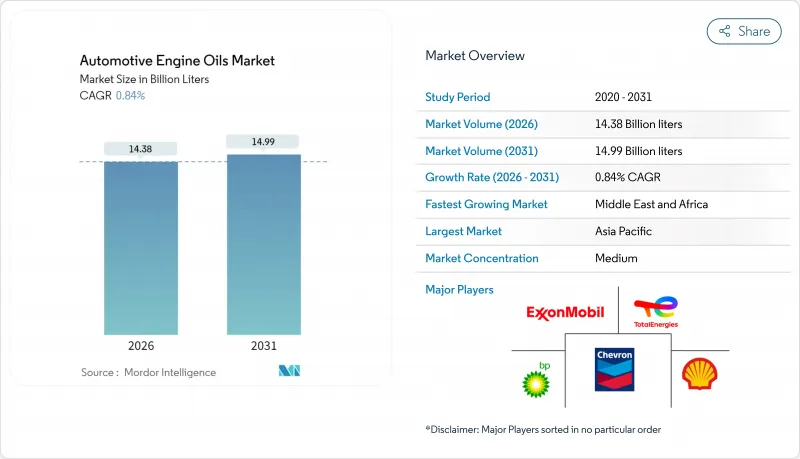
全球汽車機油市場預計將從 2025 年的 142.6 億美元成長到 2026 年的 143.8 億美元,預計到 2031 年將達到 149.9 億美元,2026 年至 2031 年的複合年成長率為 0.84%。
日益嚴格的排放氣體法規的持續實施、汽車製造商迅速轉向使用低黏度合成油以及新興經濟體汽車保有量的激增,共同推動了這一謹慎的擴張。數位化零售、電子維護平台和長效換油規格也開始重塑收入結構,促進高價值配方的發展,而礦物油在對成本敏感的細分市場仍然佔據主導地位。同時,假冒偽劣風險、原油價格波動以及日益嚴格的廢油法規限制了短期盈利前景,促使企業加大對加強供應鏈可追溯性和循環經濟的投資。
全球汽車機油市場趨勢與洞察
排放氣體和燃油經濟性標準推動了低黏度合成油的發展
2025年3月生效的API SQ和ILSAC GF-7標準強制要求使用經證實具有燃油經濟性優勢的合成機油,這正推動市場需求轉向0W-20和5W-30等合成機油等級。 2024年修訂的歐洲ACEA標準也反映了類似的要求,OEM廠商開始在工廠灌裝低黏度機油以滿足歐7和CAFE標準。消費者也遵循OEM廠商的指導,即使價格更高,也加劇了從礦物油到合成油的銷售轉變。
透過數位化快速潤滑和電子商務通路擴大應用範圍
到2024年,成熟市場中約五分之一的消費用油銷售將透過線上平台完成,而行動端QuickLube應用程式則透過遠距離診斷最佳化了服務週期。福斯在東南亞的擴張,將物聯網感測器與車隊自動補貨功能結合,正是數位化如何減少分銷摩擦並凸顯合成油價值提案的真實寫照。
發展中市場中的仿冒品偽劣潤滑油
在一些新興市場,仿冒品佔流通總量的比例高達15%。殼牌公司已引入區塊鏈追蹤和QR碼包裝認證,但這些系統會增加成本,並且需要對零售商進行培訓。由於價格高昂,高檔合成機油的風險最大。
細分市場分析
預計到2025年,乘用車引擎油將佔汽車機油市場佔有率的61.85%,這主要得益於OEM廠商的工廠灌裝和快修服務網。摩托車機油預計將成為成長最快的市場,到2031年複合年成長率將達到0.94%,這主要受亞太地區摩托車需求激增的推動。隨著日本和印度的OEM廠商指定使用能夠承受高轉速熱循環並延長換油週期的合成油混合物,摩托車機油的品質正在不斷提升。多元化生產商在採購規模和分銷管道方面獲得了優勢。
服務於長途運輸車隊的二線重型機油供應穩定,但受到電氣化的影響,其供應前景不確定性。然而,借助遠端資訊處理技術實現的換油計畫和廢氣後後處理裝置,尤其是在充電基礎設施尚不完善的地區,這類潤滑油的提案得以維持。
全球汽車機油報告按產品類型(乘用車引擎油、重負荷機油、摩托車機油)、基礎油(礦物油、合成油、半合成油、生物基油)和地區(亞太地區、北美地區、歐洲地區、南美地區、中東和非洲地區)進行細分。市場預測以公升為單位。
區域分析
到2025年,亞太地區將佔全球銷售量的43.36%,主要得益於中國2,610萬輛的汽車產量以及印度不斷成長的二輪車市場。東南亞國家也將帶來額外的成長,抵消中國燃油車成長放緩的影響,因為主要城市的都市區車滲透率已超過35%。
中東和非洲地區將實現最快成長,到2031年複合年成長率將達到2.17%。沙烏地阿拉伯的「2030願景」基礎設施計劃、阿拉伯聯合大公國物流網路的擴張以及奈及利亞新的組裝生產將共同刺激乘用車和商用車對潤滑油的需求。儘管波灣合作理事會(GCC)地區內部標準的日益統一促進了跨境產品分銷,但在打擊假冒仿冒品和廢油管理方面,相關工作仍顯滯後。
北美和歐洲市場盈利尤其豐厚,主要得益於高級產品組合和低黏度合成油的廣泛應用。延長換油週期、電動車專用潤滑油以及數位化服務模式預示著變革即將到來,這些變革也可能波及新興市場。然而,廢油收集和全氟烷基和多氟烷基物質(PFAS)含量方面的法規帶來的不利影響,正迫使研發轉向更環保的化學配方。
其他福利:
- Excel格式的市場預測(ME)表
- 3個月的分析師支持
目錄
第1章 引言
- 研究假設和市場定義
- 調查範圍
第2章調查方法
第3章執行摘要
第4章 市場情勢
- 市場概覽
- 市場促進因素
- 排放氣體和燃油經濟性標準推動了對低黏度合成油的需求。
- 透過數位化快速潤滑和電子商務通路擴大銷售範圍
- 新興市場對摩托車和乘用車的需求激增
- OEM廠商特定的長效換油週期規範提升了潤滑油的價值。
- 由於聚α烯烴(PAO)和氣轉液(GTL)供應量的增加,合成成本降低。
- 市場限制
- 原油和基礎油價格的波動給利潤率帶來了壓力。
- 發展中市場中的仿冒品偽劣潤滑油
- 加強對廢油處置和回收的監管
- 價值鍊和通路分析
- 波特五力模型
- 新進入者的威脅
- 供應商的議價能力
- 買方的議價能力
- 替代品的威脅
- 產業間競爭
- 法律規範
- 汽車產業的趨勢
第5章 市場規模與成長預測
- 依產品類型
- 乘用車引擎機油(PCMO)
- 0W-XX
- 5W-XX
- 10W-XX
- 15W-XX
- 單級
- 其他年級
- 重型機油(HDMO)
- 0W-XX
- 5W-XX
- 10W-XX
- 15W-XX
- 單級
- 其他年級
- 摩托車機油(MCO)
- 0W-XX
- 5W-XX
- 10W-XX
- 15W-XX
- 單級
- 其他年級
- 乘用車引擎機油(PCMO)
- 依基料
- 礦物
- 合成
- 半合成
- 生物基
- 按地區
- 亞太地區
- 中國
- 印度
- 巴基斯坦
- 孟加拉
- 日本
- 韓國
- 台灣
- 澳洲
- 馬來西亞
- 印尼
- 泰國
- 越南
- 亞太其他地區
- 北美洲
- 美國
- 加拿大
- 墨西哥
- 歐洲
- 德國
- 英國
- 法國
- 義大利
- 西班牙
- 北歐國家
- 俄羅斯
- 其他歐洲地區
- 南美洲
- 巴西
- 阿根廷
- 哥倫比亞
- 南美洲其他地區
- 中東和非洲
- 沙烏地阿拉伯
- 阿拉伯聯合大公國
- 卡達
- 伊朗
- 南非
- 埃及
- 奈及利亞
- 其他中東和非洲地區
- 亞太地區
第6章 競爭情勢
- 市場集中度
- 策略趨勢
- 市佔率(%)/排名分析
- 公司簡介
- BP plc
- Chevron Corporation
- China Petroleum Corporation
- CNPC
- ENEOS Corporation
- Exxon Mobil Corporation
- FUCHS
- Gazpromneft-Lubricants Ltd.
- Gulf Oil International Ltd
- Idemitsu Kosan Co., Ltd.
- Indian Oil Corporation Ltd.
- LUKOIL
- Motul
- Repsol
- Saudi Arabian Oil Co.
- Shell plc
- SK ZIC
- TotalEnergies
- Veedol Corporation Limited
第7章 市場機會與未來展望
第8章:執行長面臨的關鍵策略挑戰
The Global Automotive Engine Oils Market is expected to grow from USD 14.26 billion in 2025 to USD 14.38 billion in 2026 and is forecast to reach USD 14.99 billion by 2031 at 0.84% CAGR over 2026-2031.
Continued enforcement of more stringent emission limits, rapid OEM migration to low-viscosity synthetic grades, and the surging vehicle parc in emerging economies collectively underpin this guarded expansion. Digital retailing, e-maintenance platforms, and long-drain oil specifications have also begun to redefine the revenue mix, encouraging value-added formulations even as mineral-oil dominance persists in cost-sensitive pockets. Meanwhile, counterfeit risks, crude-price volatility, and tightening waste-oil regulations temper near-term margin prospects, prompting greater supply-chain traceability and circular-economy investments.
Global Automotive Engine Oils Market Trends and Insights
Stricter Emission and Fuel-Economy Norms Spurring Low-Viscosity Synthetics
API SQ and ILSAC GF-7 were introduced in March 2025, mandating proven fuel-economy gains that tilt demand toward 0W-20 and 5W-30 synthetic grades. European ACEA 2024 revisions echo these requirements, with OEMs factory-filling lower-viscosity oils to hit Euro 7 and CAFE thresholds. Consumer uptake follows OEM guidance, reinforcing a volume migration from mineral to synthetic products even where sticker prices remain higher.
Digital Quick-Lube and E-Commerce Channels Expanding Reach
By 2024, online platforms handled nearly one-fifth of consumer oil sales in mature markets, while mobile quick-lube apps optimized service cycles through remote diagnostics. FUCHS's Southeast Asia roll-out combines IoT sensors with automated re-ordering for fleets, illustrating how digitalization lowers distributor friction and highlights synthetic oil value propositions.
Counterfeit/Low-Quality Lubricants in Developing Markets
Fake products account for as much as 15% of volume in several emerging countries. Shell deployed blockchain tracking and QR codes to authenticate packs, yet these systems add cost and require retailer education. Premium synthetics face the greatest exposure given their higher ticket value.
Other drivers and restraints analyzed in the detailed report include:
- Emerging-Market Two-Wheeler and Passenger-Car Boom
- OEM Proprietary Long-Drain Specifications Raising Oil Value
- Stricter Used-Oil Disposal and Recycling Regulations
For complete list of drivers and restraints, kindly check the Table Of Contents.
Segment Analysis
Passenger Car Motor Oil delivered 61.85% of the automotive engine oils market share in 2025 as OEM factory fills and quick-lube networks anchored demand. Motorcycle Engine Oil posted the swiftest pace, advancing at a 0.94% CAGR through 2031 amid Asia-Pacific's two-wheeler surge. MCO premiumization is underway, with Japanese and Indian OEMs specifying synthetic blends that tolerate high-RPM heat cycles and extend drains. Manufacturers that manage multi-category portfolios gain procurement scale and channel leverage.
Second-tier Heavy Duty Motor Oil supplies long-haul fleets and remains stable but faces electrification uncertainty. Still, telematics-enabled drain planning and emissions-after-treatment devices sustain lubricant value propositions, particularly in regions where charging infrastructure remains nascent.
The Global Automotive Engine Oils Report is Segmented by Product Type (Passenger Car Motor Oil, Heavy Duty Motor Oil, and Motorcycle Engine Oil), Base Stock (Mineral, Synthetic, Semi-Synthetic, and Bio-Based), and Geography (Asia-Pacific, North America, Europe, South America, and Middle-East and Africa). The Market Forecasts are Provided in Terms of Volume (Litres).
Geography Analysis
Asia-Pacific captured 43.36% of 2025 volume, led by China's 26.1-million-unit vehicle output and India's expanding two-wheeler base. Southeast Asian nations add incremental gains, offsetting moderating Chinese ICE growth as urban EV adoption climbs beyond 35% in top cities.
The Middle East and Africa will grow the fastest at a 2.17% CAGR to 2031. Saudi Vision 2030 infrastructure projects, UAE logistics expansion, and Nigeria's nascent assembly output collectively stimulate lubricant demand across passenger and commercial fleets. Wider GCC specification harmonization eases cross-border product flows, but counterfeit policing and used-oil stewardship lag behind.
North America and Europe are buoyed by a premium mix, and the adoption of low-viscosity synthetics renders them disproportionately profitable. Extended drains, EV e-fluids, and digital service models preview shifts likely to percolate into emerging markets. Regulatory headwinds around waste-oil collection and PFAS content compel research and development redeployments toward more benign chemistries.
- BP p.l.c.
- Chevron Corporation
- China Petroleum Corporation
- CNPC
- ENEOS Corporation
- Exxon Mobil Corporation
- FUCHS
- Gazpromneft - Lubricants Ltd.
- Gulf Oil International Ltd
- Idemitsu Kosan Co., Ltd.
- Indian Oil Corporation Ltd.
- LUKOIL
- Motul
- Repsol
- Saudi Arabian Oil Co.
- Shell plc
- SK ZIC
- TotalEnergies
- Veedol Corporation Limited
Additional Benefits:
- The market estimate (ME) sheet in Excel format
- 3 months of analyst support
TABLE OF CONTENTS
1 Introduction
- 1.1 Study Assumptions and Market Definition
- 1.2 Scope of the Study
2 Research Methodology
3 Executive Summary
4 Market Landscape
- 4.1 Market Overview
- 4.2 Market Drivers
- 4.2.1 Stricter emission and fuel-economy norms spurring low-viscosity synthetics
- 4.2.2 Digital quick-lube and e-commerce channels expanding reach
- 4.2.3 Emerging-market two-wheeler and passenger-car boom
- 4.2.4 OEM proprietary long-drain specifications raising oil value
- 4.2.5 PAO (Polyalphaolefin) and GTL (Gas-to-Liquids) supply expansion lowering synthetic cost
- 4.3 Market Restraints
- 4.3.1 Volatile crude and base-oil prices compressing margins
- 4.3.2 Counterfeit/low-quality lubricants in developing markets
- 4.3.3 Stricter used-oil disposal and recycling regulations
- 4.4 Value Chain and Distribution Channel Analysis
- 4.5 Porter's Five Forces
- 4.5.1 Threat of New Entrants
- 4.5.2 Bargaining Power of Suppliers
- 4.5.3 Bargaining Power of Buyers
- 4.5.4 Threat of Substitutes
- 4.5.5 Industry Rivalry
- 4.6 Regulatory Framework
- 4.7 Automotive Industry Trends
5 Market Size and Growth Forecasts (Volume)
- 5.1 By Product Type
- 5.1.1 Passenger Car Motor Oil (PCMO)
- 5.1.1.1 0W-XX
- 5.1.1.2 5W-XX
- 5.1.1.3 10W-XX
- 5.1.1.4 15W-XX
- 5.1.1.5 Monogrades
- 5.1.1.6 Other Grades
- 5.1.2 Heavy Duty Motor Oil (HDMO)
- 5.1.2.1 0W-XX
- 5.1.2.2 5W-XX
- 5.1.2.3 10W-XX
- 5.1.2.4 15W-XX
- 5.1.2.5 Monogrades
- 5.1.2.6 Other Grades
- 5.1.3 Motorcycle Engine Oil (MCO)
- 5.1.3.1 0W-XX
- 5.1.3.2 5W-XX
- 5.1.3.3 10W-XX
- 5.1.3.4 15W-XX
- 5.1.3.5 Monogrades
- 5.1.3.6 Other Grades
- 5.1.1 Passenger Car Motor Oil (PCMO)
- 5.2 By Base Stock
- 5.2.1 Mineral
- 5.2.2 Synthetic
- 5.2.3 Semi-Synthetic
- 5.2.4 Bio-Based
- 5.3 By Geography
- 5.3.1 Asia-Pacific
- 5.3.1.1 China
- 5.3.1.2 India
- 5.3.1.3 Pakistan
- 5.3.1.4 Bangladesh
- 5.3.1.5 Japan
- 5.3.1.6 South Korea
- 5.3.1.7 Taiwan
- 5.3.1.8 Australia
- 5.3.1.9 Malaysia
- 5.3.1.10 Indonesia
- 5.3.1.11 Thailand
- 5.3.1.12 Vietnam
- 5.3.1.13 Rest of Asia-Pacific
- 5.3.2 North America
- 5.3.2.1 United States
- 5.3.2.2 Canada
- 5.3.2.3 Mexico
- 5.3.3 Europe
- 5.3.3.1 Germany
- 5.3.3.2 United Kingdom
- 5.3.3.3 France
- 5.3.3.4 Italy
- 5.3.3.5 Spain
- 5.3.3.6 Nordic Countries
- 5.3.3.7 Russia
- 5.3.3.8 Rest of Europe
- 5.3.4 South America
- 5.3.4.1 Brazil
- 5.3.4.2 Argentina
- 5.3.4.3 Colombia
- 5.3.4.4 Rest of South America
- 5.3.5 Middle-East and Africa
- 5.3.5.1 Saudi Arabia
- 5.3.5.2 United Arab Emirates
- 5.3.5.3 Qatar
- 5.3.5.4 Iran
- 5.3.5.5 South Africa
- 5.3.5.6 Egypt
- 5.3.5.7 Nigeria
- 5.3.5.8 Rest of Middle-East and Africa
- 5.3.1 Asia-Pacific
6 Competitive Landscape
- 6.1 Market Concentration
- 6.2 Strategic Moves
- 6.3 Market Share (%)/Ranking Analysis
- 6.4 Company Profiles (includes Global level Overview, Market level overview, Core Segments, Financials as available, Production Capacity, Strategic Information, Market Rank/Share for key companies, Products and Services, and Recent Developments)
- 6.4.1 BP p.l.c.
- 6.4.2 Chevron Corporation
- 6.4.3 China Petroleum Corporation
- 6.4.4 CNPC
- 6.4.5 ENEOS Corporation
- 6.4.6 Exxon Mobil Corporation
- 6.4.7 FUCHS
- 6.4.8 Gazpromneft - Lubricants Ltd.
- 6.4.9 Gulf Oil International Ltd
- 6.4.10 Idemitsu Kosan Co., Ltd.
- 6.4.11 Indian Oil Corporation Ltd.
- 6.4.12 LUKOIL
- 6.4.13 Motul
- 6.4.14 Repsol
- 6.4.15 Saudi Arabian Oil Co.
- 6.4.16 Shell plc
- 6.4.17 SK ZIC
- 6.4.18 TotalEnergies
- 6.4.19 Veedol Corporation Limited
7 Market Opportunities and Future Outlook
- 7.1 White-space and Unmet-need Assessment
8 Key Strategic Questions for CEOs
 機油添加劑市場:按類型、功能、銷售管道和應用分類-2026-2032年全球市場預測汽車化妝品市場:依產品類別、車輛類型、技術、應用和銷售管道分類-2026-2032年全球預測汽車添加劑市場:依產品類型、功能、原料、形態、車輛類型和銷售管道-2026-2032年全球預測
 非洲汽車機油市場佔有率分析、產業趨勢與統計、成長預測(2026-2031)
 全球汽車添加劑市場規模、佔有率、趨勢和成長分析報告(2026-2034)
 汽車外觀化學品市場報告:按應用、最終用途和地區分類 2026-2034 年
 汽車化妝品化學品市場-全球產業規模、佔有率、趨勢、機會和預測:按產品類型、車輛類型、銷售管道、地區和競爭格局分類,2021-2031年日本汽車機油市場報告(按等級(礦物油、半合成油、全合成油)、引擎類型(汽油、柴油、替代燃料)、車輛類型(商用車、摩托車、乘用車)和地區分類,2026-2034)
 汽車外觀化學品市場(按產品類型、車輛類型、應用、國家和地區)—2025 年至 2032 年的行業分析、市場規模、市場佔有率和預測
 汽車售後燃料添加劑市場:按產品類型、按燃料類型、按車輛類型、按分銷管道、按最終用戶、按地區