


 |
市場調查報告書
商品編碼
1910924
許可證管理:市場佔有率分析、行業趨勢和統計數據、成長預測(2026-2031 年)License Management - Market Share Analysis, Industry Trends & Statistics, Growth Forecasts (2026 - 2031) |
||||||
※ 本網頁內容可能與最新版本有所差異。詳細情況請與我們聯繫。
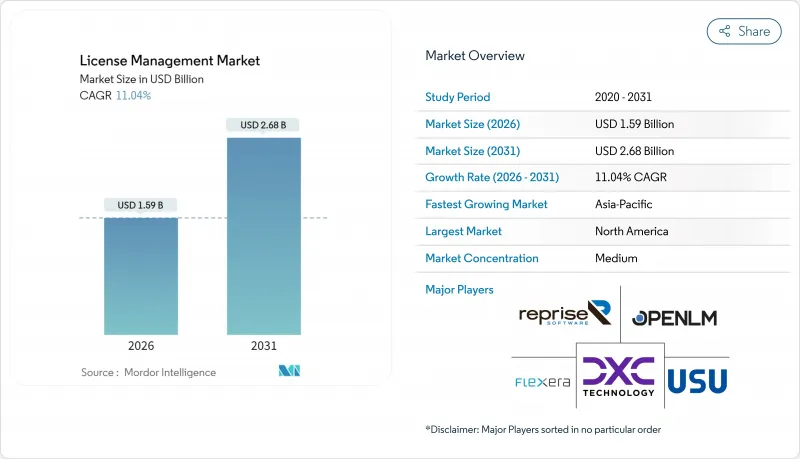
預計許可證管理市場將從 2025 年的 14.3 億美元成長到 2026 年的 15.9 億美元,並預計到 2031 年將達到 26.8 億美元,2026 年至 2031 年的複合年成長率為 11.04%。
數位化加速、SaaS價格上漲以及歐盟《數位商業彈性法案》等新監管要求,正推動混合IT環境下對自動化管治的需求。日益嚴格的監管審查、更頻繁的審核以及對即時成本管理的需求,正促使軟體資產管治從支援職能提升至董事會層面的優先事項。供應商正透過平台整合、人工智慧驅動的發現功能以及基於訂閱的經營模式來應對這些需求,幫助企業在降低合規風險的同時實現最佳化效益。同時,FinOps的日益普及以及未使用的授權成本不斷攀升(據估計,大型企業每年為此付出1.273億美元的代價),凸顯了主動式授權智慧管理能夠帶來的實質成本節約。這些因素共同推動許可證管理市場在2030年之前持續成長。
全球許可證管理市場趨勢與洞察
加速向SaaS和訂閱式授權模式轉型
從2023年到2025年,SaaS支出將成長31%,達到3,000億美元,目前已佔企業平均成本的25%。訂閱續約、基於使用量的定價以及多級授權正促使採購團隊實現許可流程自動化,以保持與時俱進。影響27%客戶的「縮水式收費」做法,即透過細微的合約調整來掩蓋價格上漲,因此,詳細的使用情況洞察對於成本預測至關重要。正因如此,能夠分析功能等級計費資料的雲端原生平台在授權管理市場中日益普及。
供應商審核的頻率和成本增加
受美國政府審核局 (GAO) 指出的公共部門收入缺口的影響,出版商正加大審核頻率,以期恢復收入。混合雲端的擴展增加了複雜性,傳統的發現工具難以協調虛擬化、容器化和 SaaS 資產。因此,企業正在將更多合規預算分配給能夠將發現功能、授權資料和合約邏輯整合到單一管理平台的解決方案。這種監管力度的加強推動了許可管理市場持續兩位數的成長。
不透明的供應商特定授權條款和指標
頻繁的指標調整(例如基於使用者、基於核心、基於使用情況等)會降低成本可見度。博通暫停向VMware銷售一週的案例表明,供應商系統變更會如何擾亂客戶的管治工作流程。企業需要耗費大量法律和技術精力來解讀合約條款,從而延緩最佳化週期。這限制了缺乏專業諮詢服務的中小型企業進入授權市場。
細分市場分析
到2025年,軟體平台仍將佔據許可證管理市場61.74%的佔有率,因為其核心的發現、標準化和匹配引擎仍然是管治營運的基礎。這一主導地位將支撐2025年許可證管理市場規模達到8.8億美元,反映企業對可配置、策略驅動的大規模自動化的需求。然而,隨著企業擴大將最佳化任務外包給擁有稀缺專業知識的合作夥伴,服務領域預計將以14.56%的複合年成長率成長,進一步推動許可證管理市場規模的擴大。
託管服務供應商正在引入人工智慧技術,以預測續約高峰並在供應商審核前檢測違規。這種持續監控模式滿足了那些長期面臨認證軟體資產管理人才短缺問題的組織的需求,尤其是在亞太和拉丁美洲地區。因此,預計到2031年,業務收益將與軟體收入的差距縮小,從而改變傳統上專注於授權授權的供應商的競爭策略。
到2025年,雲端採用將佔據許可證管理市場57.36%的佔有率。這主要得益於企業從永久性本地部署工具遷移到符合其整體IT策略的訂閱式SaaS平台。雲端架構支援即時更新、彈性擴充、API級整合以及多重雲端環境下的即時使用情況分析。這將使該細分市場保持14.02%的複合年成長率,從而鞏固其在許可證管理市場的核心地位。
在需要本地資料保存或依賴傳統基礎架構的高度監管產業中,本地部署解決方案仍廣泛應用。然而,將雲端分析與本地檢測結合,既能滿足資料主權要求又不犧牲敏捷性的混合模式正日益受到青睞。採用雲端優先管治的公司報告稱,其管理開銷降低了 40%,這增強了持續遷移的經濟效益,並推動了許可證管理市場的整體規模成長。
區域分析
預計到2025年,北美許可證管理市場規模將達到5.4億美元,佔據37.68%的市場佔有率,主要得益於成熟的企業IT支出和健全的審核系統。美國證券交易委員會(SEC)網路風險揭露規則的嚴格期限要求,也使得實現軟體的全面可視性變得更加緊迫。加拿大公共部門現代化計畫進一步推動了區域需求,但隨著大型企業滲透率接近飽和,市場成長已放緩至個位數。
亞太地區預計到2031年將達到13.29%的複合年成長率,在2025年小規模的基數基礎上實現市場領先地位。對生成式人工智慧的投資將成長兩倍,達到34億美元,其中中國的投資額年增160%。這種快速普及導致語言模型、資料管道和分析租戶的授權問題日益複雜。本地供應商正透過與授權專家合作,彌合版權追蹤和成本管治的差距,從而加速區域發展勢頭。
由於《數位營運彈性法案》(DORA) 的合規期限臨近,歐洲在許可證管理市場佔了相當大的佔有率。金融機構正在重組其資產日誌和審核工作流程,以滿足嚴格的彈性指標。同時,隨著雲端運算的普及,拉丁美洲和中東及非洲地區正從電子表格管理過渡到商業平台。儘管這些地區仍在發展中,但預計到本世紀末,它們將為全球許可證管理市場規模的增量做出貢獻。
其他福利:
- Excel格式的市場預測(ME)表
- 3個月的分析師支持
目錄
第1章 引言
- 研究假設和市場定義
- 調查範圍
第2章調查方法
第3章執行摘要
第4章 市場情勢
- 市場概覽
- 市場促進因素
- 加速向SaaS和訂閱式授權模式轉型
- 供應商審核的頻率和成本增加
- 基於財務營運政策的強制性IT資產最佳化
- 利用人工智慧發現「影子IT」許可證
- 歐盟《數位營運韌性法案》(DORA) 合規期限
- 工業物聯網平台中嵌入式設備授權的商業化
- 市場限制
- 不透明的供應商特定授權條款和指標
- 分散的獨立工具生態系統會增加整合成本。
- 認證SAM人才供不應求
- 開放原始碼的日益普及降低了對商業授權的需求。
- 產業價值鏈分析
- 監管環境
- 技術展望
- 波特五力分析
- 供應商的議價能力
- 買方的議價能力
- 新進入者的威脅
- 替代品的威脅
- 競爭對手之間的競爭
第5章 市場規模與成長預測
- 按組件
- 軟體
- 服務
- 透過部署
- 本地部署
- 雲
- 透過使用
- 審核服務
- 諮詢服務
- 合規管理
- 授權權利和最佳化
- 營運與分析
- 其他用途
- 按最終用戶行業分類
- 銀行、金融服務和保險(BFSI)
- 醫療保健和生命科學
- 資訊科技和電信
- 媒體與娛樂
- 其他終端用戶產業
- 按地區
- 北美洲
- 美國
- 加拿大
- 墨西哥
- 歐洲
- 英國
- 德國
- 法國
- 義大利
- 其他歐洲地區
- 亞太地區
- 中國
- 日本
- 印度
- 韓國
- 其他亞洲地區
- 中東
- 以色列
- 沙烏地阿拉伯
- 阿拉伯聯合大公國
- 土耳其
- 其他中東地區
- 非洲
- 南非
- 埃及
- 其他非洲地區
- 南美洲
- 巴西
- 阿根廷
- 其他南美洲
- 北美洲
第6章 競爭情勢
- 市場集中度
- 策略趨勢
- 市佔率分析
- 公司簡介
- Flexera Software LLC
- USU Software AG
- Snow Software AB
- IBM Corporation
- ServiceNow Inc.
- Oracle Corporation
- Broadcom Inc.(CA Technologies)
- Micro Focus International plc
- DXC Technology Company
- OpenLM Ltd
- SAP SE
- Thales Group(Gemalto)
- Quest Software Inc.
- Reprise Software Inc.
- Ivanti, Inc.
- License Dashboard Ltd
- Certero Ltd
- Zylo Inc.
- LeanIX GmbH
- OpenText Corporation
第7章 市場機會與未來展望
The license management market is expected to grow from USD 1.43 billion in 2025 to USD 1.59 billion in 2026 and is forecast to reach USD 2.68 billion by 2031 at 11.04% CAGR over 2026-2031.
Accelerating digitization, swelling SaaS inflation, and new regulatory mandates such as the EU Digital Operational Resilience Act are amplifying demand for automated governance across hybrid IT estates. Regulatory scrutiny, higher audit frequency, and the need for real-time cost control have shifted software asset governance from a support function to a board-level priority. Vendors are responding through platform consolidation, AI-powered discovery, and subscription-based commercial models that help enterprises curb compliance risk while unlocking optimization gains. At the same time, expanding FinOps adoption and the rising cost of unused licenses, estimated at USD 127.3 million per large enterprise annually, underscore the tangible savings available through proactive license intelligence. Together, these forces solidify a sustained growth runway for the license management market through 2030.
Global License Management Market Trends and Insights
Accelerated Shift to SaaS and Subscription-Based Licensing
SaaS spending climbed 31% between 2023 and 2025 to USD 300 billion and now absorbs 25% of the average company's cost base. Subscription renewals, usage-based pricing, and multi-tier entitlements have pushed procurement teams toward automation so that license positions remain current. Shrinkflation tactics affecting 27% of customers conceal price hikes behind contractual tweaks, making granular usage insights indispensable for cost predictability. As a result, cloud-native platforms capable of parsing billing data down to the feature level are gaining ground across the license management market.
Heightened Frequency and Cost of Vendor Audits
Audit frequency is rising as publishers pursue revenue recovery, a trend reinforced by public sector shortfalls identified by the U.S. Government Accountability Office. The hybrid-cloud sprawl adds complexity because legacy discovery tools cannot easily reconcile virtual, containerized, and SaaS assets. Enterprises, therefore, allocate larger compliance budgets to solutions that merge discovery, entitlement data, and contractual logic within a single control plane. The heightened scrutiny supports sustained double-digit growth across the license management market.
Opaque, Vendor-Specific Licence Terms and Metrics
Frequent metric redesigns, seat-based, core-based, or consumption-based, blur cost visibility. Broadcom's week-long VMware sales suspension illustrated how supplier system changes can derail customer governance workflows. Organizations expend disproportionate legal and technical effort decoding contract language, which slows optimization cycles and puts downward pressure on license management market adoption among smaller firms lacking specialist counsel.
Other drivers and restraints analyzed in the detailed report include:
- Mandatory IT-Asset Optimisation Under FinOps Mandates
- AI-Driven Discovery of Shadow IT Licences
- Fragmented Point-Tool Ecosystem Increases Integration Costs
For complete list of drivers and restraints, kindly check the Table Of Contents.
Segment Analysis
Software platforms retained a 61.74% license management market share in 2025 as core discovery, normalization, and reconciliation engines remain fundamental to governance operations. This dominance underpins a USD 0.88 billion slice of the 2025 license management market size and reflects enterprises' need for configurable, policy-driven automation at scale. Yet the services segment, projected to register a 14.56% CAGR, is rapidly expanding the license management market size as firms outsource optimization to partners holding scarce domain specialists.
Managed service providers embed AI to anticipate renewal spikes and detect non-compliance before vendor inspections occur. This continuous oversight model resonates with organizations facing a chronic shortage of certified Software Asset Management talent, especially across APAC and Latin America. As a result, service revenue is expected to narrow the gap with software by 2031, transforming the competitive calculus for vendors historically focused on licenses rather than consulting.
Cloud deployments represented 57.36% of the license management market share in 2025, propelled by enterprises migrating away from perpetual on-premises tools to subscription SaaS platforms that mirror their broader IT strategies. Cloud architectures deliver instant updates, elastic scaling, and API-grade integration, enabling real-time consumption analytics across multi-cloud estates and supporting a 14.02% CAGR that will keep this segment pivotal in the license management market.
On-premises solutions persist in highly regulated verticals that demand local data residency or maintain legacy infrastructure dependencies. However, hybrid models are gaining traction, combining cloud analytics with on-premises discovery to satisfy sovereignty mandates without sacrificing agility. Enterprises adopting cloud-first governance report 40% lower administrative overhead, reinforcing the economic case for continued migration and expanding the overall license management market size.
The License Management Market Report is Segmented by Component (Software, Services), Deployment (On-Premise, Cloud), Application (Audit Services, Advisory Services, Compliance Management, Licence Entitlement and Optimisation, Operations and Analytics, Other Applications), End-User Industry (BFSI, Healthcare and Life Sciences, and More), and Geography. The Market Forecasts are Provided in Terms of Value (USD).
Geography Analysis
The license management market size in North America totalled USD 0.54 billion in 2025, translating into a dominant 37.68% share backed by mature enterprise IT spending and an active audit culture. Tight timelines imposed by the SEC's cyber-risk disclosure rules add urgency to achieving full software visibility. Canada's public sector modernization programs further swell regional demand, though growth is tapering to single-digit rates as penetration saturates large enterprises.
Asia-Pacific generated a smaller base value in 2025, yet is projected to deliver a market-leading 13.29% CAGR through 2031. Investments in generative AI are tripling to USD 3.4 billion, with China lifting spending by 160% year-over-year. Such rapid adoption inflates license complexity across language models, data pipelines, and analytics tenants. Local vendors are partnering with global license management specialists to address gaps in entitlement tracking and cost governance, thereby accelerating regional momentum.
Europe commands a sizeable slice of the license management market, propelled by the DORA compliance deadline. Financial institutions are rearchitecting asset logs and audit workflows to meet stringent resilience metrics. Meanwhile, Latin America, the Middle East, and Africa are shifting from spreadsheet tracking toward commercial platforms as cloud penetration deepens. Although still nascent, these regions are expected to contribute incremental gains to the global license management market size by the close of the decade.
- Flexera Software LLC
- USU Software AG
- Snow Software AB
- IBM Corporation
- ServiceNow Inc.
- Oracle Corporation
- Broadcom Inc. (CA Technologies)
- Micro Focus International plc
- DXC Technology Company
- OpenLM Ltd
- SAP SE
- Thales Group (Gemalto)
- Quest Software Inc.
- Reprise Software Inc.
- Ivanti, Inc.
- License Dashboard Ltd
- Certero Ltd
- Zylo Inc.
- LeanIX GmbH
- OpenText Corporation
Additional Benefits:
- The market estimate (ME) sheet in Excel format
- 3 months of analyst support
TABLE OF CONTENTS
1 INTRODUCTION
- 1.1 Study Assumptions and Market Definition
- 1.2 Scope of the Study
2 RESEARCH METHODOLOGY
3 EXECUTIVE SUMMARY
4 MARKET LANDSCAPE
- 4.1 Market Overview
- 4.2 Market Drivers
- 4.2.1 Accelerated shift to SaaS and subscription-based licensing
- 4.2.2 Heightened frequency and cost of vendor audits
- 4.2.3 Mandatory IT-asset optimisation under FinOps mandates
- 4.2.4 AI-driven discovery of "shadow IT" licences
- 4.2.5 EU's Digital Operational Resilience Act (DORA) compliance deadline
- 4.2.6 Embedded-device licence monetisation in IIoT platforms
- 4.3 Market Restraints
- 4.3.1 Opaque, vendor-specific licence terms and metrics
- 4.3.2 Fragmented point-tool ecosystem increases integration costs
- 4.3.3 Limited availability of certified SAM talent
- 4.3.4 Rising open-source adoption reduces commercial-licence volume
- 4.4 Industry Value-Chain Analysis
- 4.5 Regulatory Landscape
- 4.6 Technological Outlook
- 4.7 Porter's Five Forces Analysis
- 4.7.1 Bargaining Power of Suppliers
- 4.7.2 Bargaining Power of Buyers
- 4.7.3 Threat of New Entrants
- 4.7.4 Threat of Substitutes
- 4.7.5 Intensity of Competitive Rivalry
5 MARKET SIZE AND GROWTH FORECASTS (VALUE)
- 5.1 By Component
- 5.1.1 Software
- 5.1.2 Services
- 5.2 By Deployment
- 5.2.1 On-premise
- 5.2.2 Cloud
- 5.3 By Application
- 5.3.1 Audit Services
- 5.3.2 Advisory Services
- 5.3.3 Compliance Management
- 5.3.4 Licence Entitlement and Optimisation
- 5.3.5 Operations and Analytics
- 5.3.6 Other Applications
- 5.4 By End-User Industry
- 5.4.1 Banking, Financial Services and Insurance (BFSI)
- 5.4.2 Healthcare and Life Sciences
- 5.4.3 Information Technology and Telecommunications
- 5.4.4 Media and Entertainment
- 5.4.5 Other End-User Industries
- 5.5 By Geography
- 5.5.1 North America
- 5.5.1.1 United States
- 5.5.1.2 Canada
- 5.5.1.3 Mexico
- 5.5.2 Europe
- 5.5.2.1 United Kingdom
- 5.5.2.2 Germany
- 5.5.2.3 France
- 5.5.2.4 Italy
- 5.5.2.5 Rest of Europe
- 5.5.3 Asia-Pacific
- 5.5.3.1 China
- 5.5.3.2 Japan
- 5.5.3.3 India
- 5.5.3.4 South Korea
- 5.5.3.5 Rest of Asia
- 5.5.4 Middle East
- 5.5.4.1 Israel
- 5.5.4.2 Saudi Arabia
- 5.5.4.3 United Arab Emirates
- 5.5.4.4 Turkey
- 5.5.4.5 Rest of Middle East
- 5.5.5 Africa
- 5.5.5.1 South Africa
- 5.5.5.2 Egypt
- 5.5.5.3 Rest of Africa
- 5.5.6 South America
- 5.5.6.1 Brazil
- 5.5.6.2 Argentina
- 5.5.6.3 Rest of South America
- 5.5.1 North America
6 COMPETITIVE LANDSCAPE
- 6.1 Market Concentration
- 6.2 Strategic Moves
- 6.3 Market Share Analysis
- 6.4 Company Profiles (includes Global level Overview, Market level overview, Core Segments, Financials as available, Strategic Information, Market Rank/Share for key companies, Products and Services, and Recent Developments)
- 6.4.1 Flexera Software LLC
- 6.4.2 USU Software AG
- 6.4.3 Snow Software AB
- 6.4.4 IBM Corporation
- 6.4.5 ServiceNow Inc.
- 6.4.6 Oracle Corporation
- 6.4.7 Broadcom Inc. (CA Technologies)
- 6.4.8 Micro Focus International plc
- 6.4.9 DXC Technology Company
- 6.4.10 OpenLM Ltd
- 6.4.11 SAP SE
- 6.4.12 Thales Group (Gemalto)
- 6.4.13 Quest Software Inc.
- 6.4.14 Reprise Software Inc.
- 6.4.15 Ivanti, Inc.
- 6.4.16 License Dashboard Ltd
- 6.4.17 Certero Ltd
- 6.4.18 Zylo Inc.
- 6.4.19 LeanIX GmbH
- 6.4.20 OpenText Corporation
7 MARKET OPPORTUNITIES AND FUTURE OUTLOOK
- 7.1 White-space and Unmet-need Assessment
 2026-2030年全球軟體材料清單(SBOM)管理市場
 軟體授權管理市場 - 全球產業規模、佔有率、趨勢、機會及預測(按部署方式、應用、最終用戶、地區和競爭格局分類,2021-2031年)
 許可證管理市場規模、佔有率和成長分析(按組件、部署類型、組織規模、應用、最終用戶產業和地區分類)-2026-2033年產業預測許可證管理市場-全球產業規模、佔有率、趨勢、機會和預測,按組件、按部署模式、按最終用戶行業、按地區和競爭進行細分,2020-2030 年預測
 許可證管理市場:按組件、許可證類型、應用、垂直行業和公司規模 - 2025-2030 年全球預測
 許可證管理市場:按組件、部署、最終用途行業和地區分類