


 |
市場調查報告書
商品編碼
1910880
衍生設計:市場佔有率分析、產業趨勢與統計、成長預測(2026-2031)Generative Design - Market Share Analysis, Industry Trends & Statistics, Growth Forecasts (2026 - 2031) |
||||||
※ 本網頁內容可能與最新版本有所差異。詳細情況請與我們聯繫。
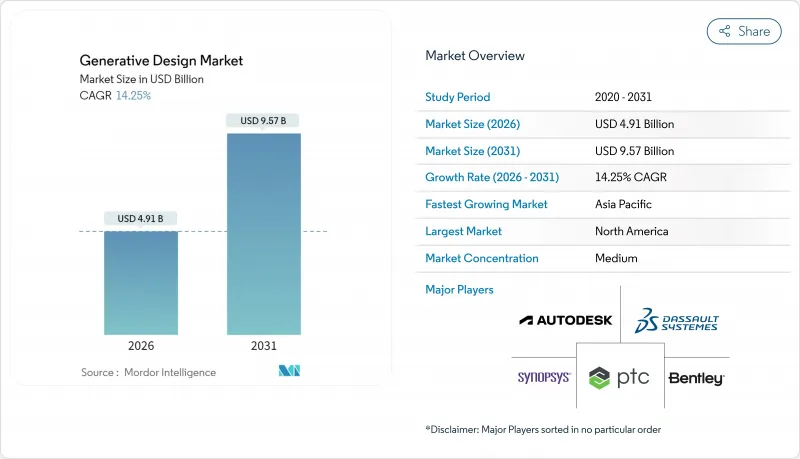
預計衍生設計市場將從 2025 年的 43 億美元成長到 2026 年的 49.1 億美元,到 2031 年達到 95.7 億美元,2026 年至 2031 年的複合年成長率為 14.25%。
這種擴張是由人工智慧優先的設計工作流程所推動的,它取代了傳統的先設計後迭代的流程,使工程師能夠在一次計算中同時最佳化重量、成本和效能。便捷的雲端存取降低了中小製造商的准入門檻,而更嚴格的永續性要求則促進了材料高效利用、減少生命週期排放的產品的發展。近期產業的整合,特別是西門子以106億美元收購Altair,顯示衍生設計正日益被視為核心競爭優勢,而非專門的工程輔助工具。隨著現有CAD供應商整合人工智慧演算法,以及人工智慧原生公司提供雲端優先平台,競爭日益激烈,市場結構也逐漸趨於緊湊。
全球生成式設計市場趨勢與洞察
對輕質材料的需求推動了汽車和航太產業的應用。
監管機構對燃油經濟性和電動車續航里程的預期迫使汽車製造商在不影響碰撞安全性的前提下減輕重量。通用汽車在其座椅支架專案中應用了生成式演算法,在滿足所有安全標準的前提下實現了40%的減重。這正是人工智慧能夠同時平衡多個約束條件(而這些約束條件以前需要多次人工迭代才能實現)的絕佳例證。航空公司也在飛機層面採用類似的邏輯,例如空中巴士利用拓撲最佳化技術開發的客艙隔板支架實現了45%的減重,從而節省了數千飛行小時的燃油。隨著北美和歐洲排放氣體法規日益嚴格,減重——與合規性和成本節約直接相關——變得至關重要。掌握了由人工智慧主導的快速重新設計的供應商正在贏得新的平台契約,並加速在整個價值鏈中的應用。不斷提高的輕量化基準值正在挑戰傳統的設計方法,並推動未來十年對人工智慧生成幾何形狀的需求。
雲端高效能運算使中小企業也能獲得先進的設計能力。
曾經因數十萬美元的硬體投資而難以進入雲端運算領域的中小型製造商,如今每月只需1000美元即可使用高效能雲端運算,獲得堪比財富500強企業的運算規模。這種訂閱模式正在重塑亞太地區的市場格局,該地區許多契約製造利潤微薄,卻要服務全球原始設備製造商(OEM)。專用雲實例可將生成式求解器的求解速度提升10倍,將迭代週期從數天縮短至數小時。工程團隊可以靈活地調整工作負載,並在設計衝刺期間僅為尖峰運算資源付費,即使對於單一產品公司而言,其商業價值也顯而易見。服務供應商正在捆綁增強型安全框架,以減輕人們對智慧財產權(IP)外洩的擔憂。這正推動受監管行業轉向混合模式,將本地儲存與雲端運算突發需求相結合。結果是,更廣泛的使用者群體湧入衍生設計市場,推動了軟體和服務授權業務的成長。
軟體成本和學習曲線限制了中小企業的採用。
企業級生成式設計平台的年度授權套餐價格從每用戶 5 萬美元到 20 萬美元不等,比主流 CAD 工具貴幾個數量級,令許多中小企業望而卻步。整合連接器、培訓課程和工作流程諮詢等費用還會進一步增加成本。即使預算充足,新用戶也需要 6 到 12 個月才能熟練,這限制了短期生產力的提升。在新興市場,由於工程師薪資水平較低,軟體定價與全球標準掛鉤,導致成本與薪資比率尤其難以承受。儘管供應商正在推出計量型的授權模式,但在資本預算緊張、投資回收期短的地區,這種模式的普及速度仍然緩慢。除非定價模式進一步發展,否則一些製造商可能會推遲採用,從而減緩生成式設計市場的短期成長。
細分市場分析
在衍生設計市場中,服務板塊的成長勢頭最為強勁,年複合成長率 (CAGR) 將達到 14.88%,而軟體板塊到 2025 年仍將維持 57.62% 的營收優勢。諮詢團隊幫助製造商將人工智慧求解器整合到產品生命週期管理 (PLM) 系統中,建立資料管道,並根據行業標準客製化最佳化目標。隨著越來越多的公司超越概念驗證階段,整合複雜性的增加以及對變更管理的需求正在推動業務收益的成長。領先的供應商正在將研討會、先導計畫和客製化培訓課程打包,以創造除一次性授權銷售之外的持續收入來源。
軟體仍然是價值鏈的核心,因為核心演算法是專有的,訂閱費用高昂,每年從 1 萬美元到 5 萬美元不等。為了證明高價的合理性並保障利潤,供應商不斷添加用於結構分析、熱分析、疲勞分析、碳排放計算等的模組。雖然透過檔案格式和資料分析儀表板實現的生態系統鎖定降低了客戶流失率,但客戶越來越傾向於選擇捆綁式軟體和諮詢計劃。成功的供應商透過為航太座椅部件和整形外科植入等垂直市場提供快速部署模板來脫穎而出,從而加快投資回報率,並在服務合作夥伴數量不斷成長的市場中保持其軟體優勢。
到2025年,本地部署將佔生成式設計市場61.68%的佔有率,這反映了航太和國防領域嚴格的智慧財產權保護規範。這些領域優先採用邊界控制的資料中心和直連式GPU叢集來保護專有設計。同時,隨著小型企業和敏感度較低的計劃優先考慮彈性運算而非空氣間隙控制,雲端訂閱正以14.95%的複合年成長率成長。早期採用者正在採用混合模式,在本地儲存庫中維護主模型,同時在雲端運行敏感度分析,從而平衡風險和速度。
雲端服務供應商正透過建立專用高效能運算 (HPC) 執行個體來增強提案,從而實現近乎線性的跨數千個核心擴展,並將複雜元件的最佳化運行時間從 8 小時縮短至 40 分鐘。靜態資料加密和零信任存取框架解決了許多合規性審核,緩解了謹慎的行業擔憂。訂閱授權模式將成本與實際運算週期而非固定容量掛鉤,正變得越來越有吸引力。隨著這些經濟優勢與成熟的安全標準相融合,與雲端採用相關的衍生設計市場規模預計將會成長,儘管在高度監管的領域,本地部署仍然至關重要。
區域分析
到2025年,北美將佔全球收入的38.02%,這得益於汽車和航太領域的早期先導計畫逐步成熟,最終發展成為企業級部署,以及軟體總部接近性,從而加速了與客戶的聯合開發週期。研發稅收優惠和強勁的創業投資資金支持了新參與企業,並促進了創新成果向更廣泛生態系統的傳輸。北美的成長將保持穩定,但速度將低於新興地區,因為許多財富500強製造商已經完成了第一波採用,現在專注於規模化發展而非新的授權許可。
亞太地區正經歷最快成長,預計到2031年將以16.21%的複合年成長率成長,這主要得益於中國製造業數位化政策、日本「工業5.0」藍圖以及韓國提升半導體競爭力的計畫。本地雲端服務供應商正與軟體公司合作,實現介面在地化並確保資料居住,加速了先前抵制海外託管的國內中小企業對雲端服務的採用。政府正透過建立共用研發中心和提供高效能運算(HPC)補貼等方式,進一步推動衍生設計。
歐洲正呈現強勁的中個位數成長,這得益於嚴格的永續性法規,這些法規獎勵材料節約和全生命週期碳減排。德國汽車巨頭正推動供應商採用人工智慧主導的輕量化技術,而斯堪地那維亞的建設公司則利用生成式工具進行木結構和模組化建築。宏觀經濟的不確定性抑制了部分領域的資本支出,但監管壓力推動著計劃向前發展。南美和中東及非洲地區雖然成長滯後,但由於基礎設施支出和區域製造業叢集的成長,正在加速發展。供應商正在建立區域夥伴關係,以期在這些新興市場搶佔先機。
其他福利:
- Excel格式的市場預測(ME)表
- 3個月的分析師支持
目錄
第1章 引言
- 研究假設和市場定義
- 調查範圍
第2章調查方法
第3章執行摘要
第4章 市場情勢
- 市場概覽
- 市場促進因素
- 汽車和航太領域對輕量化的需求
- 面向中小企業的雲端高效能運算訪問
- 與積層製造工作流程的整合
- 最佳化碳足跡,實現永續性
- 即時數位雙胞胎嵌入式生成循環
- 將衍生設計引入循環經濟經營模式
- 市場限制
- 軟體成本高且學習曲線陡峭
- CAD/CAE套件之間的資料互通性差距
- 人工智慧生成設計中智慧財產權所有權的不確定性
- 安全關鍵部件監理核准延誤
- 價值鏈分析
- 監管環境
- 波特五力分析
- 供應商的議價能力
- 買方的議價能力
- 新進入者的威脅
- 替代品的威脅
- 競爭對手之間的競爭
- 宏觀經濟因素如何影響市場
第5章 市場規模與成長預測
- 按組件
- 軟體
- 服務
- 透過部署
- 本地部署
- 雲
- 透過技術
- 拓樸最佳化
- 流體和熱力最佳化
- 晶格和表面生成
- 人工智慧驅動的多目標最佳化
- 按最終用戶行業分類
- 車
- 航太與國防
- 建築/施工
- 工業設備
- 消費品
- 醫療設備
- 能源與公共產業
- 其他終端用戶產業
- 按地區
- 北美洲
- 美國
- 加拿大
- 墨西哥
- 南美洲
- 巴西
- 阿根廷
- 南美洲其他地區
- 歐洲
- 德國
- 英國
- 法國
- 西班牙
- 義大利
- 俄羅斯
- 其他歐洲地區
- 亞太地區
- 中國
- 日本
- 印度
- 韓國
- 亞太其他地區
- 中東
- 阿拉伯聯合大公國
- 沙烏地阿拉伯
- 其他中東國家
- 非洲
- 南非
- 其他非洲地區
- 北美洲
第6章 競爭情勢
- 市場集中度
- 策略趨勢
- 市佔率分析
- 公司簡介
- Autodesk Inc.
- Dassault Systemes SE
- Synopsys, Inc.
- PTC Inc.(Frustum Inc.)
- Siemens Industry Software Inc.
- Bentley Systems, Inc.
- nTopology Inc.
- Hexagon AB
- Desktop Metal Inc.
- Diabatix NV
- Caracol Srl
- Arup Group Limited
- ESI Group
- Hyperganic Group
- Colibrium Additive(GE Additive)
第7章 市場機會與未來展望
The Generative Design market is expected to grow from USD 4.30 billion in 2025 to USD 4.91 billion in 2026 and is forecast to reach USD 9.57 billion by 2031 at 14.25% CAGR over 2026-2031.
The expansion is shaped by AI-first design workflows that allow engineers to optimize weight, cost, and performance in a single computational pass, replacing the traditional design-then-iterate routine. Cloud accessibility lowers entry barriers for small manufacturers, while increasingly stringent sustainability mandates encourage material-efficient products that cut lifecycle emissions. Recent consolidation, most notably Siemens' USD 10.6 billion acquisition of Altair, signals that buyers now regard generative design as a core competitive capability rather than a specialized engineering add-on . Competitive intensity rises as established CAD vendors embed AI algorithms and AI-native firms offer cloud-first platforms, resulting in a moderate but tightening market structure.
Global Generative Design Market Trends and Insights
Light weighting imperatives drive automotive and aerospace adoption
Regulatory fuel-economy targets and electric-vehicle range expectations leave automakers little choice but to strip mass without sacrificing crash performance. A General Motors program that applied generative algorithms to a seat bracket achieved a 40% weight cut while meeting all safety criteria, illustrating how AI simultaneously balances multi-variable constraints that previously required many manual iterations . Airlines pursue the same logic at fleet scale; Airbus reported a 45% lighter cabin-partition bracket developed through topology optimization, resulting in fuel savings that amplify across thousands of flight hours. North America and Europe feel the greatest urgency because emissions standards tighten each year, translating weight into direct compliance and cost benefits. Suppliers that master rapid AI-led redesign win new platform contracts, accelerating diffusion across the value chain. As lightweight benchmarks rise, traditional design approaches struggle to keep pace, reinforcing demand for AI-generated geometries throughout the decade.
Cloud HPC democratizes advanced design capabilities for SMEs
Small manufacturers once excluded by six-figure hardware investments now subscribe to cloud high-performance computing for as little as USD 1,000 per month, gaining the same compute scale Fortune 500 peers enjoy. The subscription model reshapes adoption economics across the Asia Pacific, where many contract manufacturers operate on thin margins yet serve global OEMs. Specialized cloud instances deliver 10X faster solve times for generative solvers than general-purpose servers, shortening iteration cycles from days to hours. Engineering teams shift workloads elastically, paying only for peak computation during design sprints, which makes business cases straightforward even for single-product firms. Providers bundle hardened security frameworks that ease lingering IP concerns, nudging regulated industries toward hybrid models that blend on-premise storage and cloud compute bursts. The outcome is a wider funnel of users entering the generative design market, boosting license growth on both software and services lines.
Software cost and learning curve barriers limit SME adoption
Annual license bundles for enterprise-grade generative platforms range between USD 50,000 and USD 200,000 per seat, an order of magnitude above mainstream CAD tools and out of reach for many small firms. The expense grows when integration connectors, training sessions, and workflow consulting are factored in. Even when budgets stretch, new users need 6-12 months to become proficient, limiting short-term productivity gains. In emerging economies where engineering salaries are lower, software list prices remain pegged to global rates, making the cost-to-salary ratio especially painful. Vendors respond with consumption-based licensing, but adoption still lags where capital budgets are tight and payback horizons short. Unless pricing models evolve further, a portion of the manufacturing base will postpone entry, muting near-term expansion of the generative design market.
Other drivers and restraints analyzed in the detailed report include:
- Additive manufacturing integration creates seamless design-to-production workflows
- Sustainability mandates accelerate carbon-footprint optimization
- Data-interoperability gaps fragment design workflows
For complete list of drivers and restraints, kindly check the Table Of Contents.
Segment Analysis
The services line of the generative design market recorded the fastest growth trajectory, rising toward a 14.88% CAGR, while software retained a 2025 revenue lead of 57.62%. Consulting teams help manufacturers stitch AI solvers into PLM systems, configure data pipelines, and customize optimization objectives that reflect industry codes. As more firms move beyond proofs of concept, integration complexity and change-management needs rise, propelling service revenues. Top providers bundle workshops, pilot projects, and proprietary training curricula, capturing annuity-like fees that outpace one-off license sales.
Software still anchors the value chain because core algorithms remain proprietary and command premium annual subscriptions in the USD 10,000-USD 50,000 range. Vendors continuously add modules, structural, thermal, fatigue, and carbon calculi, to justify price escalations and defend margins. Ecosystem lock-in from file formats and data analytics dashboards keeps churn low, but customers increasingly negotiate bundled deals that mix software and advisory projects. Successful suppliers differentiate by offering rapid-start templates for verticals such as aerospace seat components or orthopedic implants, shortening time to ROI and protecting their software positions even as service partners bloom.
On-premise installations captured 61.68% of the generative design market share in 2025, reflecting strict IP-protection norms in aerospace and defense. Those sectors prioritize perimeter-controlled data centers and direct GPU clusters to guard proprietary geometries. However, cloud subscribership is expanding at a 14.95% CAGR as SMEs and less-classified projects prize elastic compute over air-gapped control. Early adopters run sensitivity analyses in the cloud while keeping master models in local vaults, a hybrid pattern that balances risk and speed.
Cloud providers sharpen their pitch with purpose-built HPC instances that offer near-linear scaling across thousands of cores, cutting optimization runtimes from eight hours to 40 minutes on complex assemblies. Encryption at rest and zero-trust access frameworks now meet many compliance audits, eroding objections from cautious industries. Subscription licensing further sweetens the deal because costs align with actual compute cycles rather than static capacity. As these economies converge with maturing security standards, the generative design market size linked to cloud consumption is set to widen, though absolute on-premise volumes will persist in highly regulated domains.
The Generative Design Market Report is Segmented by Component (Software, Services), Deployment (On-Premise, Cloud), Technology (Topology Optimization, Fluid and Thermal Optimization, and More), End-User Industry (Automotive, Aerospace and Defense, Architecture and Construction, Industrial Equipment, Consumer Products, and More), and Geography. The Market Forecasts are Provided in Terms of Value (USD).
Geography Analysis
North America controlled 38.02% of 2025 global revenue as early automotive and aerospace pilots matured into enterprise roll-outs, and software headquarters proximity accelerated co-development cycles with customers. R&D tax incentives and robust venture funding supported new entrants that feed innovation into the wider ecosystem. Growth is steady but slower than in emerging regions because many Fortune 500 manufacturers have already finished first-wave deployments and now focus on scaling rather than new licenses.
Asia Pacific is recording the fastest expansion, charting a 16.21% CAGR through 2031 on the back of China's manufacturing-digitization mandates, Japan's Society 5.0 roadmap, and South Korea's semiconductor competitiveness agenda. Local cloud providers team with software firms to localize interfaces and ensure data residency, which accelerates adoption among domestic SMEs that previously balked at foreign-hosted options. Governments set up shared innovation centers, offering subsidized HPC credits that further stimulate generative design uptake.
Europe shows solid mid-single-digit growth tied to stringent sustainability regulations that reward material savings and lifecycle-carbon cuts. Germany's automotive giants push suppliers to adopt AI-led lightweighting, while Scandinavian builders use generative tools for timber and modular construction. Although macroeconomic uncertainty tempers capital spending in some segments, regulatory pressure keeps projects moving. South America, the Middle East, and Africa trail but build momentum as infrastructure spending and local manufacturing clusters grow; vendors plant regional partnerships to capture early mindshare in these nascent arenas.
- Autodesk Inc.
- Dassault Systemes SE
- Synopsys, Inc.
- PTC Inc. (Frustum Inc.)
- Siemens Industry Software Inc.
- Bentley Systems, Inc.
- nTopology Inc.
- Hexagon AB
- Desktop Metal Inc.
- Diabatix NV
- Caracol S.r.l.
- Arup Group Limited
- ESI Group
- Hyperganic Group
- Colibrium Additive (GE Additive)
Additional Benefits:
- The market estimate (ME) sheet in Excel format
- 3 months of analyst support
TABLE OF CONTENTS
1 INTRODUCTION
- 1.1 Study Assumptions and Market Definition
- 1.2 Scope of the Study
2 RESEARCH METHODOLOGY
3 EXECUTIVE SUMMARY
4 MARKET LANDSCAPE
- 4.1 Market Overview
- 4.2 Market Drivers
- 4.2.1 Lightweighting needs in automotive and aerospace
- 4.2.2 Cloud-based HPC access for SMEs
- 4.2.3 Integration with additive manufacturing workflows
- 4.2.4 Sustainability-driven carbon-footprint optimization
- 4.2.5 Real-time digital-twin embedded generative loops
- 4.2.6 Generative design adoption in circular-economy business models
- 4.3 Market Restraints
- 4.3.1 High software cost and steep learning curve
- 4.3.2 Data-interoperability gaps across CAD/CAE suites
- 4.3.3 IP ownership ambiguity for AI-generated designs
- 4.3.4 Regulatory-approval delays for safety-critical parts
- 4.4 Value Chain Analysis
- 4.5 Regulatory Landscape
- 4.6 Porter's Five Forces Analysis
- 4.6.1 Bargaining Power of Suppliers
- 4.6.2 Bargaining Power of Buyers
- 4.6.3 Threat of New Entrants
- 4.6.4 Threat of Substitutes
- 4.6.5 Intensity of Competitive Rivalry
- 4.7 Impact of Macroeconomic Factors on the Market
5 MARKET SIZE AND GROWTH FORECASTS (VALUE)
- 5.1 By Component
- 5.1.1 Software
- 5.1.2 Services
- 5.2 By Deployment
- 5.2.1 On-premise
- 5.2.2 Cloud
- 5.3 By Technology
- 5.3.1 Topology Optimization
- 5.3.2 Fluid and Thermal Optimization
- 5.3.3 Lattice and Surface Generation
- 5.3.4 AI-driven Multi-objective Optimization
- 5.4 By End-user Industry
- 5.4.1 Automotive
- 5.4.2 Aerospace and Defense
- 5.4.3 Architecture and Construction
- 5.4.4 Industrial Equipment
- 5.4.5 Consumer Products
- 5.4.6 Medical Devices
- 5.4.7 Energy and Utilities
- 5.4.8 Other End-user Industries
- 5.5 By Geography
- 5.5.1 North America
- 5.5.1.1 United States
- 5.5.1.2 Canada
- 5.5.1.3 Mexico
- 5.5.2 South America
- 5.5.2.1 Brazil
- 5.5.2.2 Argentina
- 5.5.2.3 Rest of South America
- 5.5.3 Europe
- 5.5.3.1 Germany
- 5.5.3.2 United Kingdom
- 5.5.3.3 France
- 5.5.3.4 Spain
- 5.5.3.5 Italy
- 5.5.3.6 Russia
- 5.5.3.7 Rest of Europe
- 5.5.4 Asia Pacific
- 5.5.4.1 China
- 5.5.4.2 Japan
- 5.5.4.3 India
- 5.5.4.4 South Korea
- 5.5.4.5 Rest of Asia Pacific
- 5.5.5 Middle East
- 5.5.5.1 UAE
- 5.5.5.2 Saudi Arabia
- 5.5.5.3 Rest of the Middle East
- 5.5.6 Africa
- 5.5.6.1 South Africa
- 5.5.6.2 Rest of Africa
- 5.5.1 North America
6 COMPETITIVE LANDSCAPE
- 6.1 Market Concentration
- 6.2 Strategic Moves
- 6.3 Market Share Analysis
- 6.4 Company Profiles (includes Global level Overview, Market level overview, Core Segments, Financials as available, Strategic Information, Market Rank/Share for key companies, Products and Services, and Recent Developments)
- 6.4.1 Autodesk Inc.
- 6.4.2 Dassault Systemes SE
- 6.4.3 Synopsys, Inc.
- 6.4.4 PTC Inc. (Frustum Inc.)
- 6.4.5 Siemens Industry Software Inc.
- 6.4.6 Bentley Systems, Inc.
- 6.4.7 nTopology Inc.
- 6.4.8 Hexagon AB
- 6.4.9 Desktop Metal Inc.
- 6.4.10 Diabatix NV
- 6.4.11 Caracol S.r.l.
- 6.4.12 Arup Group Limited
- 6.4.13 ESI Group
- 6.4.14 Hyperganic Group
- 6.4.15 Colibrium Additive (GE Additive)
7 MARKET OPPORTUNITIES AND FUTURE OUTLOOK
- 7.1 White-space and Unmet-need Assessment
 衍生設計市場-全球產業規模、佔有率、趨勢、機會、預測:按組件、部署模式、應用、地區和競爭格局分類,2021-2031年
 生成式設計市場:按組件、部署類型、組織規模和產業分類-2026年至2032年全球市場預測
 2026年全球衍生設計市場報告2026年全球衍生設計軟體市場報告
 衍生設計市場報告:按組件、部署模式、應用、垂直行業和地區分類(2026-2034 年)
 衍生設計市場規模、佔有率和成長分析(按組件、部署模式、應用、垂直產業和地區分類)-2026-2033年產業預測
 全球衍生設計市場規模:按軟體解決方案、按服務、按部署模型、按地區和預測
 衍生設計市場:按部署、產業和地區分類
 生成設計市場:各零件,各部署模式,各用途,各終端用戶類型,各終端用戶業界,各地區,機會,預測,2018年~2032年
 衍生設計全球市場規模、佔有率、趨勢分析報告(按部署、行業、應用程式和地區分類的展望和預測,2024-2031 年)