


 |
市場調查報告書
商品編碼
1910879
礦物加工設備:市場佔有率分析、產業趨勢與統計、成長預測(2026-2031)Mineral Processing Equipment - Market Share Analysis, Industry Trends & Statistics, Growth Forecasts (2026 - 2031) |
||||||
※ 本網頁內容可能與最新版本有所差異。詳細情況請與我們聯繫。
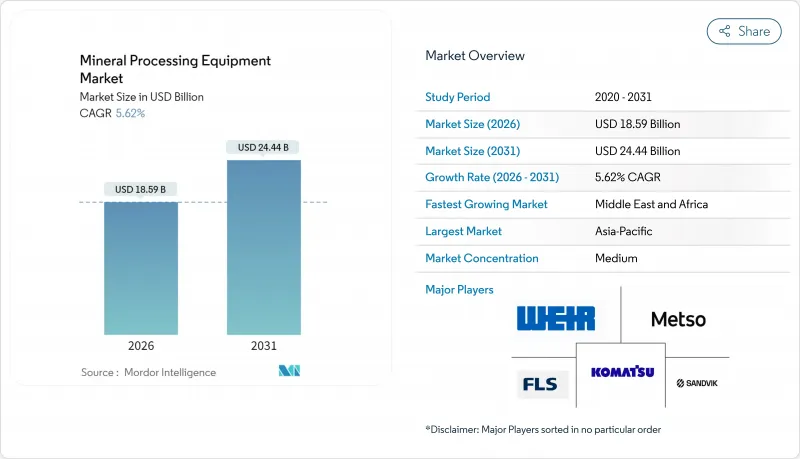
2025年礦物加工設備市場價值為176.1億美元,預計從2026年的185.9億美元成長到2031年的244.4億美元,在預測期(2026-2031年)內複合年成長率為5.62%。
礦石品位持續下降、能源轉換金屬需求激增以及環境標準日益嚴格,共同推動了以高產能、數位化工廠為重點的多年投資週期。鋰、鎳和稀土元素需求的成長,帶動了精細粉碎、精密分離和先進除塵系統設備的訂單增加。生產商優先考慮降低每噸成本和範圍1排放,並採用高壓輥磨機(HPGR)和柱式浮選等技術。隨著偏遠礦場業者尋求有保障的運作和預測性維護,售後服務正變得越來越重要。供應鏈民族主義推動了北美、歐洲和亞洲對國內加工能力擴張的迫切需求,進一步擴大了礦物加工設備市場的機會。
全球礦物加工設備市場趨勢及展望
電動車和電池(鋰電池、鎳電池)的金屬需求激增
電池級材料需求的激增正推動礦物加工設備市場發生重大變革。鋰礦計劃需要能夠達到99.5%或更高純度的專用焙燒、浸出和結晶迴路,這帶動了美卓pCAM和煅燒爐成套設備的新訂單。鎳紅土礦加工同樣使大型高壓釜、硫酸浸出反應器和下游溶劑萃取裝置受益。擁有成熟高溫高壓設計的原始設備製造商(OEM)正保持著高利潤率,因為投資者正在澳洲、印尼和智利快速推進電池金屬一體化產業中心的建設。由此帶來的產能擴張支撐著兩位數的設備需求成長,即使在大宗商品支出低迷的時期也是如此。供應商也正在整合ESG報告模組,以追溯每噸電池金屬的生產排放。
轉向高等級礦石需要更高產能的破碎機
銅、金和鐵礦石物品位持續下降,迫使選礦廠處理更多礦石以維持金屬產量。高壓輥磨機 (HPGR) 可節能 20-40%,並能獲得更細的產品粒徑分佈,進而提高下游浮選回收率。韋爾集團在澳洲和智利礦場安裝的 ENDURON 系統便證明了這一點。在這些礦場中,礦場對一台額定產能為每小時 2 萬噸的初級破碎機進行了改造,並配備了配套的即時粒度分析儀,從而形成完整的控制迴路。這種連鎖反應推動了對能夠處理高礦漿量的篩分機、旋流器和脫水設備的需求。提供從破碎到分級一體化解決方案的供應商正在獲得更多業務收益,並日益專注於礦物加工設備市場中的高通量、低能耗解決方案。
在新礦開發中,以ESG主導的資本配置至關重要
隨著機構投資人採用更嚴格的ESG(環境、社會和治理)篩選標準,新礦場的核准流程被推遲,相關設備的訂單也隨之減少。在加拿大待開發區的鐵礦石和銅礦計劃中,碳中和製程設計如今已成為一項先決條件,這使得安裝成本增加了高達20%。核准週期的延長降低了破碎機和磨機的短期需求,而除塵和水循環系統改造的訂單卻在增加。原始設備製造商(OEM)正在透過模組化、攜帶式設備來應對這項挑戰,這些設備能夠最大限度地減少土地擾動並縮短環境審查時間,從而在礦物加工設備市場維持著小規模批量、快速採購訂單的穩定供應。
細分市場分析
鋰在2031年前高達13.58%的複合年成長率凸顯了礦物加工設備市場的結構性變化。儘管到2025年,被歸類為「其他」的大宗商品仍佔礦物加工設備市場規模的89.55%,但電池金屬工廠對煅燒窯、溶劑萃取混合器和結晶器等設備的要求極高,且雜質含量閾值極低。隨著汽車製造商尋求安全且可追溯的供應鏈,礦物加工設備市場正吸引投資者的注意。雖然傳統的鐵礦石和銅的流通量仍然可觀,但它們個位數的成長率與關鍵礦物加工領域兩位數的成長形成了鮮明對比。
隨著銅金礦石品位持續下降,研磨(HPGR)、粉碎機和閃速浮選設備的資本投資週期不斷延長。稀土元素處理量雖低,但其生產迴路需要複雜的多層分離,導致單位成本高昂,進而影響利潤率。因此,供應商正將研發重點放在濕式冶金和選擇性浸出技術上,以平衡其對傳統大宗商品和高成長特種礦產領域的依賴。
截至2025年,破碎機和磨粉機在礦物加工設備市場規模中佔據最大佔有率,達32.72%;而先進浮選槽預計到2031年將以5.88%的複合年成長率快速成長。加工複雜鉛鋅鎳礦的工廠採用自動化氣流和棉絮攝影系統來維持礦石品位。整合式撬裝浮選模組可將交付週期縮短至六個月,使其適用於快速推進的鋰礦計劃。
下游的高速濃縮機和膏體填充設備可有效應對尾礦壩的風險,而配備磨損性能感測器的智慧泥漿泵則可延長檢修週期。因此,礦物加工設備的市場佔有率正逐漸向分離和尾礦處理方向轉變,這反映出水資源管理和價值回收的重要性日益凸顯。
區域分析
亞太地區仍將是礦物加工設備市場的核心,預計2025年將佔全球銷售額的67.92%。中國龐大的冶煉和精煉基地正以前所未有的規模吸收破碎機、磨機和過濾設備。澳洲的鐵礦石巨頭已承諾新增超過7億噸的年產能,並持續升級其高壓格柵分離設備。同時,印尼的鎳紅土礦計劃已明確了高壓釜和酸廠的配套設施。印度針對關鍵礦產的生產關聯激勵(PLI)計劃以及對礦業法的修訂將鼓勵新的鋰石墨礦開發,以滿足2025年至2030年間不斷成長的設備需求。
中東和非洲地區將達到最高成長率,到2031年複合年成長率將達到9.82%。沙烏地阿拉伯、奈米比亞和安哥拉正投入國家資本,以實現其磷酸鹽、銅和稀土元素資源的商業化。太陽能海水淡化廠將為耗水量大的濃縮廠提供原料,進而降低單位營運成本。位於馬阿登的大型磷酸鹽綜合體是礦山到化肥一體化流程的典範,並已獲得泵浦、濃縮機和迴轉乾燥機的維修服務合約。在德班、Muscat和特馬設立的區域維修基地減少了物流延誤,有利於投資本地技術人員的原始設備製造商(OEM)。北美和歐洲的成長率維持在個位數,主要得益於供應鏈安全政策。美國聯邦政府的津貼正在促進國內氫氧化鋰精煉廠的早期運作,使煅燒爐和結晶器的專業製造商受益。歐盟《關鍵材料法》對稀土元素分離和電池回收提供補貼,提振了柱式浮選和濕式冶金設備的訂單。南美洲的鋰三角產業保持成長勢頭,安第斯山脈高地的水資源限制促使直接鋰提取(DLE)模組的普及,這種模組消耗的鹽水更少。地緣政治、環境、社會和治理(ESG)要求以及資源民族主義正在交織融合,重塑區域設備採購格局,從而支撐礦物加工設備市場的全面成長。
其他福利:
- Excel格式的市場預測(ME)表
- 3個月的分析師支持
目錄
第1章 引言
- 研究假設和市場定義
- 調查範圍
第2章調查方法
第3章執行摘要
第4章 市場情勢
- 市場概覽
- 市場促進因素
- 電動車電池金屬熱潮(鋰、鎳)
- 轉向開採高等級礦石推動了對更高產能破碎機的需求。
- 非洲關鍵礦產計劃資本投資激增
- 引進數位雙胞胎技術實現全廠最佳化
- 綠色鋼鐵計劃增加了對球團礦的需求
- 利用人工智慧進行礦石分選,降低下游製程的能耗。
- 市場限制
- ESG主導的待開發區資本配置
- 加強粒狀物排放標準
- 偏遠地區熟練勞動力短缺
- 關鍵零件的地緣政治供應鏈民族主義
- 價值/供應鏈分析
- 監管環境
- 技術展望
- 波特五力模型
- 新進入者的威脅
- 買方和消費者的議價能力
- 供應商的議價能力
- 替代品的威脅
- 競爭對手之間的競爭
第5章 市場規模及成長預測(價值(美元))
- 礦產開採業
- 礬土
- 銅
- 鐵
- 鋰
- 鎳
- 稀土元素
- 黃金和貴金屬
- 其他
- 透過裝置
- 破碎機和研磨設備
- 篩網和分離器
- 給料機和輸送機
- 鑽頭和破碎機
- 增稠和澄清
- 浮選槽
- 磁選機和重力選機
- 泵浦和閥門
- 過濾和脫水
- 透過製造程序
- 破碎和研磨
- 排序和分類
- 濃縮(浮選/分離)
- 脫水治療
- 物料輸送
- 按最終用戶行業分類
- 礦產和礦石開採公司
- 合約加工廠
- 回收金屬和再生金屬
- 骨材和建築材料
- 地區
- 北美洲
- 美國
- 加拿大
- 北美其他地區
- 南美洲
- 巴西
- 智利
- 南美洲其他地區
- 歐洲
- 德國
- 英國
- 法國
- 義大利
- 其他歐洲地區
- 亞太地區
- 中國
- 印度
- 澳洲
- 日本
- 韓國
- 亞太其他地區
- 中東和非洲
- 阿拉伯聯合大公國
- 沙烏地阿拉伯
- 土耳其
- 埃及
- 南非
- 其他中東和非洲地區
- 北美洲
第6章 競爭情勢
- 市場集中度
- 策略趨勢
- 市佔率分析
- 公司簡介
- FLSmidth A/S
- Metso Corporation
- Komatsu Ltd.
- Sandvik AB
- The Weir Group PLC
- ThyssenKrupp AG
- TAKRAF GmbH
- CITIC Heavy Industries Co., Ltd.
- Terex Corporation
- Wirtgen GmbH
- Multotec(Pty)Ltd
- FEECO International, Inc.
- McLanahan Corporation
- Tenova SpA
- Haver & Boecker Niagara GmbH
- Derrick Corporation
- Eriez Manufacturing Co.
- Astec Industries, Inc.
- Sotecma SL
第7章 市場機會與未來展望
The Mineral Processing Equipment market was valued at USD 17.61 billion in 2025 and estimated to grow from USD 18.59 billion in 2026 to reach USD 24.44 billion by 2031, at a CAGR of 5.62% during the forecast period (2026-2031).
Continuous ore-grade decline, the energy-transition metals boom, and tightening environmental standards reinforce multi-year investment cycles favoring higher-capacity, digitally enabled plants. Growing demand for lithium, nickel, and rare earth elements pushes equipment orders toward finer-grinding, precision-separation, and advanced dust-control systems. Producers prioritize energy efficiency to reduce cost per tonne and Scope 1 emissions, elevating technologies such as high-pressure grinding rolls (HPGRs) and column flotation. Aftermarket services gain strategic importance as remote mine operators seek guaranteed uptime and predictive maintenance. Supply-chain nationalism adds urgency to domestic processing capacity in North America, Europe, and Asia, further broadening the mineral processing equipment market opportunity.
Global Mineral Processing Equipment Market Trends and Insights
EV-Battery Metal Boom (Lithium, Nickel)
Soaring demand for battery-grade inputs drives a pronounced shift in the Mineral Processing Equipment market. Lithium projects require specialized roasting, leaching, and crystallization circuits able to deliver 99.5%+ purity levels, prompting new orders for Metso's pCAM and calciner packages. Nickel laterite processing equally benefits larger autoclaves, sulfuric-acid leach reactors, and downstream solvent-extraction units. OEMs with high-temperature, high-pressure design credentials command premium margins as investors fast-track integrated battery-metal hubs in Australia, Indonesia, and Chile. The resulting capacity build-out sustains double-digit equipment demand even when bulk-commodity spending moderates. Suppliers also integrate ESG reporting modules that trace cradle-to-gate emissions for each tonne of battery metal.
Shift to Finer-Grade Ores Driving High-Capacity Crushers
Copper, gold, and iron ore head grades continue to fall, obliging plants to process larger tonnages to maintain metal output. HPGR circuits yield 20-40% energy savings and finer product size distributions that elevate downstream flotation recovery, as demonstrated by Weir Group's ENDURON installs Mines in Australia and Chile retrofit primary crushers with 20,000 t/h nameplate capacities, complemented by real-time particle-size analyzers that close the control loop. This cascading effect lifts demand for screens, cyclones, and dewatering equipment sized for higher slurry volumes. Suppliers that provide integrated comminution-to-classification packages capture added service revenue, reinforcing the Mineral Processing Equipment market's focus on high-throughput, low-specific-energy solutions.
ESG-Driven Capital Rationing for Green-Field Mines
Institutional investors apply stringent ESG filters, slowing approvals for new mines and delaying linked plant orders. Greenfield iron ore and copper projects in Canada now require upfront carbon-neutral processing designs, adding up to 20% to installed costs. Extended permitting cycles compress near-term demand for crushers and mills, even as retrofit orders for dust-suppression and water-recycling systems rise. OEMs respond with modular, relocatable plants that minimize land disturbance and shorten environmental reviews, preserving a pipeline of smaller, faster-moving purchase orders within the Mineral Processing Equipment market.
Other drivers and restraints analyzed in the detailed report include:
- CAPEX Surge in African Critical-Mineral Projects
- Digital-Twin Adoption for Plant-Wide Optimization
- Tightening Particulate-Matter Emission Norms
For complete list of drivers and restraints, kindly check the Table Of Contents.
Segment Analysis
Lithium's meteoric 13.58% CAGR through 2031 underscores structural change inside the mineral processing equipment market. Although bulk commodities under the "Others" banner still generated 89.55% of the mineral processing equipment market size in 2025, battery-metal plants are specifying calcination kilns, solvent-extraction mixers, and crystallizers built for ultra-low impurity thresholds. The Mineral Processing Equipment market captures investor enthusiasm as automakers seek secure, traceable supply chains. Traditional iron-ore and copper flows maintain large volumes; however, their single-digit growth contrasts sharply with double-digit expansion in critical mineral circuits.
Continued head-grade decline in copper and gold extends capex cycles for HPGR, fine-grinding, and flash-flotation gear. Though small in tonnage, rare-earth element circuits demand complex multi-stage separation that commands high unit pricing, lifting margin contribution. Suppliers thus allocate R&D toward hydrometallurgy and selective leaching, balancing legacy bulk-commodity exposure with high-growth specialty segments.
Crushers and mills represented the largest 32.72% slice of the mineral processing equipment market size in 2025, yet advanced flotation cells booked the quickest 5.88% CAGR through 2031. Plants processing complex lead-zinc or nickel ores adopt automated air-flow and froth-camera systems to sustain grade. Integrated skid-mounted flotation modules shorten delivery to six months, suiting fast-track lithium projects.
Downstream, high-rate thickeners and paste-fill plants address tailings dam risk, while smart slurry pumps with wear-performance sensors extend the mean time between overhauls. Therefore, the Mineral Processing Equipment market share mix tilts gradually toward separation and tailings handling, reflecting heightened water stewardship and value-recovery priorities.
The Mineral Processing Equipment Market Report is Segmented by Mineral Mining Sector (Bauxite, Copper, Iron, Lithium, Nickel, Rare-Earth Elements, Gold and Precious Metals, Others), Equipment (Crushers and Mills, Screens and Separators, and More), Processing Stage (Crushing and Grinding, and More), End-User Industry (Mineral/Ore Mining Companies, and More), and Geography. The Market Forecasts are Provided in Terms of Value (USD).
Geography Analysis
Asia-Pacific, with 67.92% of 2025 turnover, remains the nucleus of the mineral processing equipment market. China's vast smelting and refining backbone absorbs crushers, mills, and filtration packages on an unparalleled scale. Australian iron-ore majors commit to 700+ Mt/y capacity, sustaining HPGR and screening upgrades, while Indonesian nickel laterite projects specify autoclaves and acid-plant tie-ins. India's Production-Linked Incentive scheme for critical minerals and mining code reforms stimulates greenfield lithium and graphite developments that underpin incremental equipment demand in 2025-2030.
The Middle East and Africa deliver the fastest 9.82% CAGR through 2031, as Saudi Arabia, Namibia, and Angola deploy sovereign capital to monetize phosphate, copper, and rare-earth resources. Solar-powered desalination plants feed water-intensive concentrators, cutting unit opex. Ma'aden's mega-phosphate complex exemplifies integrated mine-to-fertilizer flows, capturing service contracts for pumps, thickeners, and rotary dryers. Localized maintenance hubs in Durban, Muscat, and Tema mitigate logistics delays, favoring OEMs that invest in on-ground technicians. North America and Europe record mid-single-digit growth rates anchored by supply-chain security agendas. United States federal grants fast-track domestic lithium-hydroxide refineries, benefitting calciner and crystallizer specialists. The EU's Critical Raw Materials Act subsidizes rare-earth separation and battery recycling, boosting column-flotation and hydromet plant orders. South America's lithium triangle retains momentum, although water-use restrictions in the high Andes propel the adoption of direct-lithium-extraction (DLE) modules that consume less brine. Geopolitics, ESG imperatives, and resource nationalism jointly reshape regional equipment procurement patterns, sustaining broad-based Mineral Processing Equipment market growth.
- FLSmidth A/S
- Metso Corporation
- Komatsu Ltd.
- Sandvik AB
- The Weir Group PLC
- ThyssenKrupp AG
- TAKRAF GmbH
- CITIC Heavy Industries Co., Ltd.
- Terex Corporation
- Wirtgen GmbH
- Multotec (Pty) Ltd
- FEECO International, Inc.
- McLanahan Corporation
- Tenova S.p.A.
- Haver & Boecker Niagara GmbH
- Derrick Corporation
- Eriez Manufacturing Co.
- Astec Industries, Inc.
- Sotecma S.L.
Additional Benefits:
- The market estimate (ME) sheet in Excel format
- 3 months of analyst support
TABLE OF CONTENTS
1 Introduction
- 1.1 Study Assumptions and Market Definition
- 1.2 Scope of the Study
2 Research Methodology
3 Executive Summary
4 Market Landscape
- 4.1 Market Overview
- 4.2 Market Drivers
- 4.2.1 EV-Battery Metal Boom (Lithium, Nickel)
- 4.2.2 Shift To Finer-Grade Ores Driving High-Capacity Crushers
- 4.2.3 CAPEX Surge in African Critical-Mineral Projects
- 4.2.4 Digital-Twin Adoption for Plant-Wide Optimization
- 4.2.5 Green-Steel Initiatives Increasing Pelletizing Demand
- 4.2.6 AI-Based Ore-Sorting Reducing Downstream Energy Use
- 4.3 Market Restraints
- 4.3.1 ESG-Driven Capital Rationing for Green-Field Mines
- 4.3.2 Tightening Particulate-Matter Emission Norms
- 4.3.3 Skilled-Workforce Shortages in Remote Regions
- 4.3.4 Geopolitical Supply-Chain Nationalism on Key Spares
- 4.4 Value / Supply-Chain Analysis
- 4.5 Regulatory Landscape
- 4.6 Technological Outlook
- 4.7 Porter's Five Forces
- 4.7.1 Threat of New Entrants
- 4.7.2 Bargaining Power of Buyers/Consumers
- 4.7.3 Bargaining Power of Suppliers
- 4.7.4 Threat of Substitute Products
- 4.7.5 Intensity of Competitive Rivalry
5 Market Size and Growth Forecasts (Value (USD))
- 5.1 By Mineral Mining Sector
- 5.1.1 Bauxite
- 5.1.2 Copper
- 5.1.3 Iron
- 5.1.4 Lithium
- 5.1.5 Nickel
- 5.1.6 Rare-earth Elements
- 5.1.7 Gold and Precious Metals
- 5.1.8 Others
- 5.2 By Equipment
- 5.2.1 Crushers and Mills
- 5.2.2 Screens and Separators
- 5.2.3 Feeders and Conveyors
- 5.2.4 Drills and Breakers
- 5.2.5 Thickening and Clarification
- 5.2.6 Flotation Cells
- 5.2.7 Magnetic and Gravity Separators
- 5.2.8 Pumps and Valves
- 5.2.9 Filtration and Dewatering
- 5.3 By Processing Stage
- 5.3.1 Crushing and Grinding
- 5.3.2 Screening and Sorting
- 5.3.3 Concentration (Flotation/Separation)
- 5.3.4 Dewatering
- 5.3.5 Material Handling
- 5.4 By End-User Industry
- 5.4.1 Mineral/Ore Mining Companies
- 5.4.2 Contract Processing Plants
- 5.4.3 Recycling and Secondary Metals
- 5.4.4 Aggregates and Construction
- 5.5 Geography
- 5.5.1 North America
- 5.5.1.1 United States
- 5.5.1.2 Canada
- 5.5.1.3 Rest of North America
- 5.5.2 South America
- 5.5.2.1 Brazil
- 5.5.2.2 Chile
- 5.5.2.3 Rest of South America
- 5.5.3 Europe
- 5.5.3.1 Germany
- 5.5.3.2 United Kingdom
- 5.5.3.3 France
- 5.5.3.4 Italy
- 5.5.3.5 Rest of Europe
- 5.5.4 Asia-Pacific
- 5.5.4.1 China
- 5.5.4.2 India
- 5.5.4.3 Australia
- 5.5.4.4 Japan
- 5.5.4.5 South Korea
- 5.5.4.6 Rest of Asia-Pacific
- 5.5.5 Middle East and Africa
- 5.5.5.1 United Arab Emirates
- 5.5.5.2 Saudi Arabia
- 5.5.5.3 Turkey
- 5.5.5.4 Egypt
- 5.5.5.5 South Africa
- 5.5.5.6 Rest of Middle East and Africa
- 5.5.1 North America
6 Competitive Landscape
- 6.1 Market Concentration
- 6.2 Strategic Moves
- 6.3 Market Share Analysis
- 6.4 Company Profiles (Includes Global level Overview, Market level overview, Core Segments, Financials as available, Strategic Information, Market Rank/Share for key companies, Products and Services, and Recent Developments)
- 6.4.1 FLSmidth A/S
- 6.4.2 Metso Corporation
- 6.4.3 Komatsu Ltd.
- 6.4.4 Sandvik AB
- 6.4.5 The Weir Group PLC
- 6.4.6 ThyssenKrupp AG
- 6.4.7 TAKRAF GmbH
- 6.4.8 CITIC Heavy Industries Co., Ltd.
- 6.4.9 Terex Corporation
- 6.4.10 Wirtgen GmbH
- 6.4.11 Multotec (Pty) Ltd
- 6.4.12 FEECO International, Inc.
- 6.4.13 McLanahan Corporation
- 6.4.14 Tenova S.p.A.
- 6.4.15 Haver & Boecker Niagara GmbH
- 6.4.16 Derrick Corporation
- 6.4.17 Eriez Manufacturing Co.
- 6.4.18 Astec Industries, Inc.
- 6.4.19 Sotecma S.L.
7 Market Opportunities and Future Outlook
 2026年全球礦物破碎、分選和加工設備市場報告
 2026-2030年全球礦物加工設備市場
 礦物加工設備市場規模、佔有率及成長分析(按設備類型、礦物開採產業及地區分類)-2026-2033年產業預測
 礦業物料輸送設備市場規模、佔有率和趨勢分析報告:按採礦方法、產品、地區和細分市場預測(2025-2033 年)
 骨材、採礦和礦物加工設備市場機會、成長動力、產業趨勢分析及 2025 - 2034 年預測
 2025-2033 年按類型、移動性、應用和地區分類的破碎、篩選和選礦設備市場報告
 ASIC礦機全球市場(2024-2028)
 全球選礦設備市場