


 |
市場調查報告書
商品編碼
1910811
二氧化矽:市場佔有率分析、產業趨勢與統計、成長預測(2026-2031)Silica - Market Share Analysis, Industry Trends & Statistics, Growth Forecasts (2026 - 2031) |
||||||
※ 本網頁內容可能與最新版本有所差異。詳細情況請與我們聯繫。
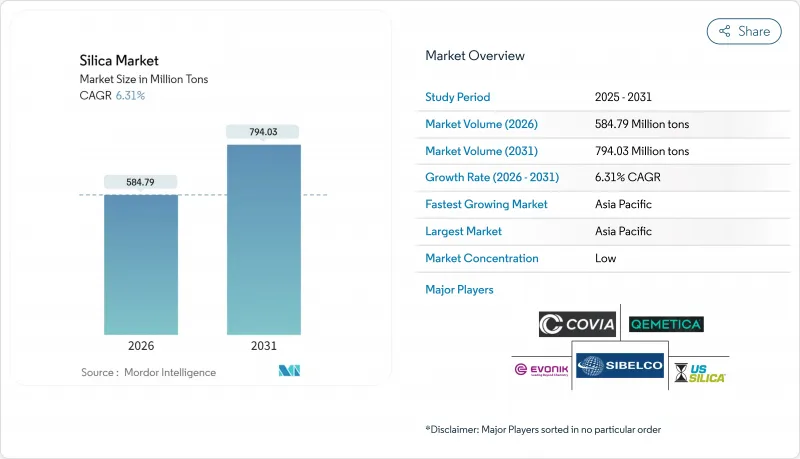
二氧化矽市場預計將從 2025 年的 5.5008 億噸成長到 2026 年的 5.8479 億噸,並預計到 2031 年將達到 7.9403 億噸,2026 年至 2031 年的複合年成長率為 6.31%。
這一強勁成長反映了二氧化矽在建築材料、節能輪胎、太陽能玻璃和半導體基板等領域的核心地位。亞太地區基礎設施投資的增加、全球範圍內低滾動阻力輪胎的日益普及以及太陽能光伏發電裝置的加速擴張,都在推動市場需求;同時,特種級二氧化矽供應商通過提供高純度和表面改性產品,獲得了更高的溢價。儘管運輸成本波動和職業健康法規在一定程度上抑制了市場成長,但對生物基加工技術的投資以及區域選礦能力的提升,為二氧化矽市場的長期穩健發展提供了支撐。
全球二氧化矽市場趨勢與洞察
節能環保輪胎對沉澱二氧化矽的需求強勁
低滾動阻力輪胎可提高燃油經濟性3%至7%,而歐洲的輪胎效率標籤法規正在推動胎面配方中二氧化矽含量的增加。目前,高檔乘用車輪胎的沉澱二氧化矽含量高達每小時90英尺(phr),是2020年標準含量的兩倍。商用車隊也採用類似的配方以降低柴油成本,而電動車製造商則進一步推進這一趨勢以延長續航里程。
太陽能玻璃製造能力持續擴大
每吉瓦太陽能發電需要1.5萬至2萬噸超白矽基玻璃,其鐵含量低於120ppm。中國佔全球太陽能玻璃產能的85%以上,並正將新建的浮法玻璃生產線與其自身的矽選礦廠結合,以確保原料品質。雙面面板所需的更薄玻璃對純度要求更高,從而推動了對先進選礦技術的投資。
來自鋁矽酸鹽和矽酸鈣填充材的競爭威脅
煅燒黏土和偏高嶺土產品在混凝土和聚合物複合材料中具有與普通二氧化矽相當的增強效果,價格卻低25%。隨著供應商投資於顆粒表面處理技術以縮小性能差距,微粉化矽酸鋁在對成本敏感的建築外加劑市場中的佔有率正在不斷成長。
細分市場分析
至2025年,結晶級石英將佔二氧化矽市場的99.15%,並在2031年之前以6.22%的複合年成長率成長。石英的熱穩定性及其成熟的供應鏈使其成為混凝土、玻璃和鑄造模具的重要材料。鱗石英和方矽石在高溫陶瓷領域佔據著一定的市場佔有率,但複雜的相變加工過程限制了其規模化生產。非晶級石英雖然產量較小,但在綠色輪胎化合物、高固態電池漿料和半導體化學機械拋光漿料等領域卻能獲得高價。專業供應商利用親水和疏水錶面處理技術,在大量生產之外創造附加價值。
日益嚴格的環境法規正推動原料生產從開採的結晶質原料轉向工程化非晶態原料,後者可降低吸入粉塵的風險。生物基稻殼二氧化矽滿足了這項要求,同時也具有全生命週期碳減量優勢,並且接近性亞洲輪胎製造地。對真空閃蒸反應器和低鹼精煉生產線的投資,支持以小規模、高利潤產品線為目標,而非追求小規模商品生產的策略。因此,二氧化矽市場將繼續呈現兩極化的局面,即高純度、特定用途等級的二氧化矽與建築用散裝砂之間出現價格差異,預計到2030年,兩者之間的價格差異將進一步擴大。
此二氧化矽市場報告按類型(非晶態(氣相/熱解法、水合二氧化矽)、晶態(石英、鱗石英、方矽石))、終端用戶產業(建築施工、頁岩油氣、玻璃製造、水處理及其他)和地區(亞太地區、北美地區、歐洲地區、南美洲地區、中東和非洲地區)進行細分。市場預測以公噸為單位。
區域分析
亞太地區將主導二氧化矽市場,預計到2025年將佔據41.00%的市場佔有率,並在2031年之前以8.10%的複合年成長率成長。中國每年消耗超過2億噸二氧化矽,用於建築、太陽能玻璃和化工衍生,這得益於其戰略儲備和綜合選礦設施。在印度,不斷擴展的高速公路網路和智慧城市規劃正在推動國內需求,而政府補貼則促進了稻殼二氧化矽產業的擴張,為當地輪胎工廠和出口市場提供產品。
北美在頁岩支撐劑供應中佔據中心地位,威斯康辛州、德克薩斯州和亞伯達的礦床均符合嚴格的抗裂強度標準。區域加工廠正在縮短墨西哥灣沿岸玻璃熔爐的供應鏈,而加拿大生產商則正在滿足液化天然氣建設和綠色氫能基礎設施的需求。監管因素,特別是美國職業安全與健康管理局(OSHA)對可吸入二氧化矽的限制,正促使礦商轉向濕法加工和封閉式加工系統,這雖然增加了資本支出,但降低了保險責任。
在歐洲,高附加價值需求穩定,主要來自德國、法國和英國。汽車和化學用戶需要高純度產品,而歐盟循環經濟指令鼓勵使用回收材料和生物基材料。東歐供應商,特別是Qemetica擴建後的波蘭工廠,正利用接近性西歐原始設備製造商以及不斷成長的土耳其和北非建築市場的優勢。對節能窯爐技術和現場太陽能發電的投資符合歐盟脫碳法規,並將為該地區的長期競爭力奠定基礎。
其他福利:
- Excel格式的市場預測(ME)表
- 3個月的分析師支持
目錄
第1章 引言
- 調查先決條件
- 調查範圍
第2章調查方法
第3章執行摘要
第4章 市場情勢
- 市場概覽
- 市場促進因素
- 節能型「綠色」輪胎對沉澱二氧化矽的需求強勁
- 太陽能玻璃製造能力持續擴大
- 高純度二氧化矽在先進半導體製造流程的應用日益廣泛
- 亞洲正在向生物基稻殼二氧化矽轉型,以減少其碳足跡。
- 氣相二氧化矽在高固態電池漿料中的快速應用
- 市場限制
- 來自鋁矽酸鹽和矽酸鈣填料的競爭威脅
- 散裝矽砂運輸成本有波動。
- 收緊可吸入結晶質二氧化矽暴露限值(美國職業安全與健康管理局、歐盟)
- 價值鏈分析
- 波特五力模型
- 供應商的議價能力
- 買方的議價能力
- 新進入者的威脅
- 替代品的威脅
- 競爭程度
第5章 市場規模和成長預測(價值和數量)
- 按類型
- 不規律的
- 煙氣/熱解
- 水合作用
- 晶體
- 石英
- 鱗石英
- 方矽石
- 不規律的
- 按最終用戶行業分類
- 建築/施工
- 頁岩油氣
- 玻璃製造
- 水處理
- 其他
- 按地區
- 亞太地區
- 中國
- 印度
- 日本
- 韓國
- 馬來西亞
- 泰國
- 印尼
- 越南
- 亞太其他地區
- 北美洲
- 美國
- 加拿大
- 墨西哥
- 歐洲
- 德國
- 英國
- 法國
- 義大利
- 西班牙
- 俄羅斯
- 北歐國家
- 土耳其
- 其他歐洲地區
- 南美洲
- 巴西
- 阿根廷
- 哥倫比亞
- 南美洲其他地區
- 中東和非洲
- 沙烏地阿拉伯
- 南非
- 奈及利亞
- 卡達
- 阿拉伯聯合大公國
- 埃及
- 其他中東和非洲地區
- 亞太地區
第6章 競爭情勢
- 市場集中度
- 策略趨勢
- 市佔率(%)/排名分析
- 公司簡介
- AGSCO Corp
- AMS Applied Material Solutions
- Cabot Corporation
- China-Henan Huamei Chemical Co. Ltd
- Covia Holdings LLC
- Denka Company Limited
- Evonik Industries AG
- Heraeus Holding
- Kemitura Group
- Madhu Silica Pvt. Ltd
- Merck KGaA
- Mitsubishi Chemical Group Corporation
- Nouryon
- OCI Company Ltd
- QEMETICA
- Sibelco
- Tokuyama Corporation
- US Silica(Apollo Funds)
- WR Grace and Co.
- Wacker Chemie AG
第7章 市場機會與未來展望
The Silica market is expected to grow from 550.08 Million tons in 2025 to 584.79 Million tons in 2026 and is forecast to reach 794.03 Million tons by 2031 at 6.31% CAGR over 2026-2031.
This robust expansion mirrors the mineral's central role in construction materials, energy-efficient tires, solar glass, and semiconductor substrates. Rising infrastructure spending in Asia-Pacific, the global push for low-rolling-resistance tires, and accelerating photovoltaic build-outs are amplifying demand, while specialty-grade suppliers secure pricing premiums through high-purity and surface-modified offerings. Freight-cost volatility and occupational-health regulations temper growth, yet investment in bio-based processing and regional beneficiation reinforce a resilient long-term outlook for the silica market.
Global Silica Market Trends and Insights
Robust Demand for Precipitated Silica in Energy-Efficient Green Tires
Low-rolling-resistance tires improve fuel economy by 3-7%, and European regulations that mandate tire-efficiency labeling spur higher silica loadings in tread compounds. Premium passenger-car tires now contain up to 90 phr of precipitated silica, double typical 2020 levels. Commercial fleets adopt similar formulations to lower diesel costs, while electric-vehicle makers intensify the trend to extend driving range.
Ongoing Build-Out of Photovoltaic Glass Manufacturing Capacity
Each gigawatt of solar deployment requires 15,000-20,000 tons of ultra-clear silica-based glass with iron content below 120 ppm. China commands over 85% of global PV-glass capacity and is pairing new float-glass lines with captive silica-beneficiation plants to guarantee feedstock quality. Thinner bifacial-panel glass further tightens purity specifications, driving investment in advanced beneficiation.
Competitive Threat from Aluminosilicate and Calcium-Silicate Fillers
Calcined-clay and metakaolin products undercut commodity-grade silica by up to 25% while offering comparable reinforcement in concrete and polymer composites. Suppliers invest in particle-surface treatments that narrow historical performance gaps, with micronized aluminosilicates gaining share in cost-sensitive construction mixes.
Other drivers and restraints analyzed in the detailed report include:
- Rising Adoption of High-Purity Silica in Advanced Semiconductor Nodes
- Shift Toward Bio-Based Rice-Husk Silica in Asia to Cut Carbon Footprint
- Volatility in Freight Cost for Bulk Silica Sand
For complete list of drivers and restraints, kindly check the Table Of Contents.
Segment Analysis
Crystalline grades account for 99.15% of the silica market in 2025 and are expanding at a 6.22% CAGR through 2031. Quartz remains indispensable in concrete, glass, and foundry molds thanks to thermal stability and a well-established supply chain. Tridymite and cristobalite fill smaller high-temperature ceramics niches, but their complex phase-conversion processing limits scale. Amorphous grades, while minor by tonnage, command premium pricing in green-tire compounds, high-solids battery slurries, and semiconductor CMP slurries. Specialty suppliers leverage hydrophilic and hydrophobic surface treatments that capture value beyond bulk tonnage.
Elevated environmental scrutiny encourages migration from mined crystalline inputs toward engineered amorphous forms with lower respirable-dust risk. Bio-based rice-husk silica meets this requirement while offering life-cycle carbon savings and proximity to Asian tire-manufacturing centers. Investment in vacuum flash reactors and low-alkali purification lines underscores the strategy of targeting smaller, higher-margin parcels rather than chasing commodity volume. As a result, the silica market continues bifurcating into high-purity, application-specific grades and bulk construction sand, with pricing divergence expected to widen through 2030.
The Silica Report is Segmented by Type (Amorphous (Fumed/Pyrogenic, and Hydrated), Crystalline (Quartz, Tridymite, and Cristobalite)), End-User Industry (Building and Construction, Shale Oil and Gas, Glass Manufacturing, Water Treatment, and Others), and Geography (Asia-Pacific, North America, Europe, South America, and Middle-East and Africa). The Market Forecasts are Provided in Terms of Volume (Tons).
Geography Analysis
Asia-Pacific dominates the silica market with 41.00% share in 2025 and an 8.10% CAGR to 2031. China consumes over 200 million tons annually across construction, photovoltaic glass, and chemical derivatives, underpinned by strategic reserves and integrated beneficiation hubs. India's highway expansion and smart-city programs lift domestic demand, while government subsidies accelerate rice-husk silica ventures that feed both local tire plants and export outlets.
North America holds a pivotal position in shale proppant supply, with Wisconsin, Texas, and Alberta deposits meeting stringent crush-strength specifications. Regional processing plants shorten supply chains for Gulf Coast glass furnaces, while Canadian producers capture demand from LNG construction and green-hydrogen infrastructure. Regulatory drivers, notably OSHA respirable-silica limits, push miners toward wet-processing and enclosed-handling systems that boost capex but lower insurance liabilities.
Europe presents stable, value-added demand centered on Germany, France, and the United Kingdom. Automotive and chemical users specify high-purity grades, and EU circular-economy directives promote recycled and bio-based inputs. Eastern European suppliers, led by Qemetica's expanded Polish site, benefit from proximity to both Western OEMs and growing Turkish and North African construction markets. Investments in energy-efficient kiln technology and on-site solar arrays align with EU decarbonization rules, anchoring long-term regional competitiveness.
- AGSCO Corp
- AMS Applied Material Solutions
- Cabot Corporation
- China-Henan Huamei Chemical Co. Ltd
- Covia Holdings LLC
- Denka Company Limited
- Evonik Industries AG
- Heraeus Holding
- Kemitura Group
- Madhu Silica Pvt. Ltd
- Merck KGaA
- Mitsubishi Chemical Group Corporation
- Nouryon
- OCI Company Ltd
- QEMETICA
- Sibelco
- Tokuyama Corporation
- U.S. Silica (Apollo Funds)
- W.R. Grace and Co.
- Wacker Chemie AG
Additional Benefits:
- The market estimate (ME) sheet in Excel format
- 3 months of analyst support
TABLE OF CONTENTS
1 Introduction
- 1.1 Study Assumptions
- 1.2 Scope of the Study
2 Research Methodology
3 Executive Summary
4 Market Landscape
- 4.1 Market Overview
- 4.2 Market Drivers
- 4.2.1 Robust demand for precipitated silica in energy-efficient "green" tires
- 4.2.2 Ongoing build-out of photovoltaic glass manufacturing capacity
- 4.2.3 Rising adoption of high-purity silica in advanced semiconductor nodes
- 4.2.4 Shift toward bio-based rice-husk silica in Asia to cut carbon footprint
- 4.2.5 Rapid uptake of fumed silica in high-solids battery slurries
- 4.3 Market Restraints
- 4.3.1 Competitive threat from aluminosilicate and calcium-silicate fillers
- 4.3.2 Volatility in freight cost for bulk silica sand
- 4.3.3 Tightening respirable-crystalline-silica exposure limits (OSHA, EU)
- 4.4 Value Chain Analysis
- 4.5 Porter's Five Forces
- 4.5.1 Bargaining Power of Suppliers
- 4.5.2 Bargaining Power of Buyers
- 4.5.3 Threat of New Entrants
- 4.5.4 Threat of Substitutes
- 4.5.5 Degree of Competition
5 Market Size and Growth Forecasts (Value and Volume)
- 5.1 By Type
- 5.1.1 Amorphous
- 5.1.1.1 Fumed/Pyrogenic
- 5.1.1.2 Hydrated
- 5.1.2 Crystalline
- 5.1.2.1 Quartz
- 5.1.2.2 Tridymite
- 5.1.2.3 Cristobalite
- 5.1.1 Amorphous
- 5.2 By End-user Industry
- 5.2.1 Building and Construction
- 5.2.2 Shale Oil and Gas
- 5.2.3 Glass Manufacturing
- 5.2.4 Water Treatment
- 5.2.5 Others
- 5.3 By Geography
- 5.3.1 Asia-Pacific
- 5.3.1.1 China
- 5.3.1.2 India
- 5.3.1.3 Japan
- 5.3.1.4 South Korea
- 5.3.1.5 Malaysia
- 5.3.1.6 Thailand
- 5.3.1.7 Indonesia
- 5.3.1.8 Vietnam
- 5.3.1.9 Rest of Asia-Pacific
- 5.3.2 North America
- 5.3.2.1 United States
- 5.3.2.2 Canada
- 5.3.2.3 Mexico
- 5.3.3 Europe
- 5.3.3.1 Germany
- 5.3.3.2 United Kingdom
- 5.3.3.3 France
- 5.3.3.4 Italy
- 5.3.3.5 Spain
- 5.3.3.6 Russia
- 5.3.3.7 Nordic Countries
- 5.3.3.8 Turkey
- 5.3.3.9 Rest of Europe
- 5.3.4 South America
- 5.3.4.1 Brazil
- 5.3.4.2 Argentina
- 5.3.4.3 Colombia
- 5.3.4.4 Rest of South America
- 5.3.5 Middle-East and Africa
- 5.3.5.1 Saudi Arabia
- 5.3.5.2 South Africa
- 5.3.5.3 Nigeria
- 5.3.5.4 Qatar
- 5.3.5.5 United Arab Emirates
- 5.3.5.6 Egypt
- 5.3.5.7 Rest of Middle-East and Africa
- 5.3.1 Asia-Pacific
6 Competitive Landscape
- 6.1 Market Concentration
- 6.2 Strategic Moves
- 6.3 Market Share (%)/Ranking Analysis
- 6.4 Company Profiles (includes Global-level Overview, Market-level Overview, Core Segments, Financials, Strategic Information, Market Rank/Share, Products and Services, Recent Developments)
- 6.4.1 AGSCO Corp
- 6.4.2 AMS Applied Material Solutions
- 6.4.3 Cabot Corporation
- 6.4.4 China-Henan Huamei Chemical Co. Ltd
- 6.4.5 Covia Holdings LLC
- 6.4.6 Denka Company Limited
- 6.4.7 Evonik Industries AG
- 6.4.8 Heraeus Holding
- 6.4.9 Kemitura Group
- 6.4.10 Madhu Silica Pvt. Ltd
- 6.4.11 Merck KGaA
- 6.4.12 Mitsubishi Chemical Group Corporation
- 6.4.13 Nouryon
- 6.4.14 OCI Company Ltd
- 6.4.15 QEMETICA
- 6.4.16 Sibelco
- 6.4.17 Tokuyama Corporation
- 6.4.18 U.S. Silica (Apollo Funds)
- 6.4.19 W.R. Grace and Co.
- 6.4.20 Wacker Chemie AG
7 Market Opportunities and Future Outlook
- 7.1 White-space and Unmet-Need Assessment
 球形二氧化矽市場報告:趨勢、預測與競爭分析(至2035年)
 二氧化矽市場:2026-2032年全球市場預測(依產品類型、形態、粒徑、等級、應用及最終用戶產業分類)二氧化矽粉末市場:2026-2032年全球市場預測(依原料種類、等級、功能、粒徑、純度、通路和應用分類)
 2026年全球二氧化矽礦物補充劑市場報告
 全球二氧化矽粉末市場規模、佔有率、趨勢和成長分析報告(2026-2034年)全球介孔二氧化矽市場規模、佔有率、趨勢和成長分析報告(2026-2034)二氧化矽間隔微球市場(按產品類型、粒徑、等級、表面處理、形態、應用和最終用途行業分類),全球預測,2026-2032年球形二氧化矽市場按產品類型、純度等級、應用和最終用戶產業分類-2026-2032年全球預測
 高分散性二氧化矽市場規模、佔有率及成長分析(依形態、功能、應用、最終用途及地區分類)-2026-2033年產業預測
 高純度二氧化矽市場規模、佔有率和成長分析(按純度、粒徑、形貌、類型、應用、終端用戶產業和地區分類)-2026-2033年產業預測