


 |
市場調查報告書
商品編碼
1910810
硝酸:市佔率分析、產業趨勢與統計、成長預測(2026-2031)Nitric Acid - Market Share Analysis, Industry Trends & Statistics, Growth Forecasts (2026 - 2031) |
||||||
※ 本網頁內容可能與最新版本有所差異。詳細情況請與我們聯繫。
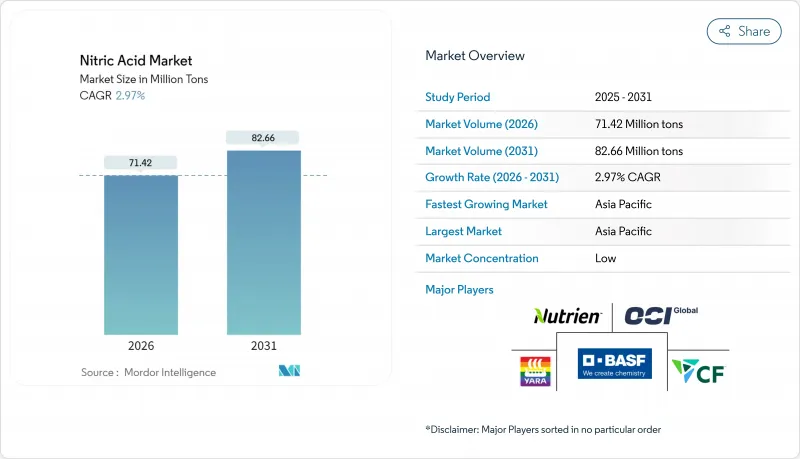
2025 年硝酸市場價值為 6,936 萬噸,預計從 2026 年的 7,142 萬噸成長到 2031 年的 8,266 萬噸,在預測期(2026-2031 年)內複合年成長率為 2.97%。
對低碳氨的持續投資、不斷成長的炸藥需求以及化肥需求的強勁成長繼續支撐著硝酸市場的基礎,但不斷上漲的環境監管成本和波動的天然氣價格正在重塑成本結構。隨著最佳可行技術應用環境(BAT-AEL)標準的日益嚴格,歐洲正迅速向綠色生產方式轉型,而北美則正利用藍氨計劃來增強能源安全。那些及早整合碳捕獲技術、可再生氫能和先進催化劑的公司,在商品價格波動的情況下,利潤率更具韌性。
全球硝酸市場趨勢及展望
歐洲對低碳硝酸銨肥料的需求激增
歐洲化肥生產商正轉向使用可再生氫,以滿足歐盟可再生能源指令III的要求,即到2030年,42%的氫氣原料必須來自可再生。領先成功取得綠色原料的企業受供應衝擊的影響較小,並且可以與尋求減少範圍3排放的食品零售連鎖店簽訂銷售協議。領先的生產商正透過推進大規模碳捕獲與封存(CCS)計劃來應對這項挑戰,其中Yarra公司位於Slaithkill的CCS設施預計將於2026年投入運營,屆時將顯著減少範圍1排放。這種轉型正在加深硝酸市場與歐盟氣候目標之間的聯繫,並推動綠色氨走廊地區新的合資企業的成立。
擴大聚醯胺6,6的應用以滿足歐盟汽車輕量化目標
歐盟乘用車二氧化碳排放限值(95克/公里)正推動高性能聚合物取代金屬。聚醯胺6,6可減輕高達40%的重量,從而在不犧牲結構強度的前提下提升電動車的續航里程。由於己二酸(一種硝酸衍生物)是聚醯胺6,6的關鍵前體,因此向聚醯胺6,6的轉變將增加當地對硝酸的需求。供應鏈正集中於高純度硝酸,宇部興產計畫提高電子級硝酸的產量,以滿足聚合物製造商的需求。一級汽車供應商正與硝酸生產商協調簽訂長期樹脂採購協議,以確保在更嚴格的歐7排放標準實施之前,原料的品質穩定且供應充足。
歐盟收緊N2O排放法規(BAT-AEL)將推高資本投資和營運成本。
歐盟委員會正在修訂《最佳可行技術環境標準文件》(LVIC BREF),預計將降低氧化亞氮排放標準。這將迫使老舊設施進行維修或安裝新的排放控制設備。安裝二次催化劑系統或三次裂解裝置每條生產線需要超過800萬美元的資本投資,這可能會擠壓中型工廠的利潤空間。擁有整合碳捕集與封存(CCS)技術和先進燃燒器的營運商,例如BOC有限公司的二氧化碳捕集與液化裝置,在競標長期供應合約時享有成本優勢。這種政策環境正在加速工廠關閉和資產更新,導致硝酸市場向擁有雄厚財力進行合規投資的頂級生產商集中。
細分市場分析
到2025年,弱硝酸將佔據57.45%的市場佔有率,這反映了其在肥料和中間體應用領域的廣泛用途。此細分市場受益於較低的腐蝕控制成本,並允許生產商以最小的升級改造運作單一單壓迴路。隨著歐洲強制要求使用依賴弱酸中和的控制釋放肥料,弱硝酸市場規模預計將穩定成長。
濃硝酸市佔率位居第二,受炸藥和電子產品需求成長的推動,其複合年成長率(CAGR)達到3.48%。宇部興產株式會社在山口縣等地擴建高純度生產線,旨在搶佔特種產品市場的溢價。發煙硝酸雖然屬於小眾市場,但在航太推進領域佔有重要的戰略地位。
硝酸市場按濃度(稀硝酸(低於 68%)、濃硝酸(68-98%)、煙/紅煙(高於 98%))、終端用戶行業(化肥、化學品製造、炸藥、航太、油墨、顏料和染料、其他終端用戶行業)和地區(亞太地區、北美、歐洲、南美、中東和非洲)進行細分。
區域分析
2025年,亞太地區將佔據全球硝酸市場57.60%的佔有率,年複合成長率達3.62%,主要得益於重工業、化肥使用和電子製造業的同步成長。隨著環保檢驗推動老舊設施的催化劑升級,中國持續投資於硝酸中間體。迪帕克化肥公司在印度的達赫傑計劃每年將新增45萬噸總產能,協助印度提高硝酸自給率並減少淨進口量。
在歐洲,由於能源成本高昂和排放法規嚴格,市場佔有率持續下降。更嚴格的BAT-AEL標準迫使獲利能力的生產商進行升級改造或退出市場,導致BASF和雅苒等大型綜合企業進行生產整合。北美則受惠於豐富的頁岩氣和正在發展的藍氨產業。 OCI位於博蒙特的工廠將建立一條低碳供應路線,並從2025年開始向墨西哥灣沿岸的硝酸和硝酸鹽工廠供貨。
南美洲持續面臨結構性氮肥短缺問題,巴西95%的需求依賴進口。隨著大豆生產商尋求出口優質認證,綠色肥料的使用正在增加。然而,匯率波動和基礎設施瓶頸限制了硝酸鹽生產能力的即時投資。
其他福利:
- Excel格式的市場預測(ME)表
- 3個月的分析師支持
目錄
第1章 引言
- 研究假設和市場定義
- 調查範圍
第2章調查方法
第3章執行摘要
第4章 市場情勢
- 市場概覽
- 市場促進因素
- 歐洲對低碳硝酸銨肥料的需求激增
- 根據歐盟汽車輕量化目標,擴大聚醯胺6,6(己二酸衍生物)的使用。
- 印度硝酸鹽製藥叢集的政府激勵措施,鼓勵建造現場弱硝酸裝置。
- 爆炸物製造業的需求不斷成長
- 市場限制
- 由於歐盟加強了最佳可行技術應用環境 (BAT-AEL),N2O排放法規收緊,這將增加資本支出 (Capex) 和營運支出 (Opex)。
- 天然氣價格波動對氨製硝酸利潤率帶來壓力
- 硝酸造成的健康危害
- 價值鏈分析
- 波特五力模型
- 供應商的議價能力
- 買方的議價能力
- 新進入者的威脅
- 替代品的威脅
- 競爭對手之間的競爭
- 貿易流量分析
- 成本分析
第5章 市場規模和成長預測(價值和數量)
- 按字段
- 稀硝酸(濃度低於68%)
- 濃硝酸(68-98%)
- 發煙/紅煙(98%或以上)
- 按最終用戶行業分類
- 肥料
- 化學製造
- 霹靂
- 航太
- 墨水、顏料、染料
- 其他終端用戶產業(製藥和食品加工)
- 按地區
- 亞太地區
- 中國
- 印度
- 日本
- 韓國
- 印尼
- 馬來西亞
- 越南
- 泰國
- 亞太其他地區
- 北美洲
- 美國
- 加拿大
- 墨西哥
- 歐洲
- 德國
- 英國
- 法國
- 義大利
- 西班牙
- 俄羅斯
- 土耳其
- 北歐國家
- 其他歐洲地區
- 南美洲
- 巴西
- 阿根廷
- 哥倫比亞
- 南美洲其他地區
- 中東和非洲
- 沙烏地阿拉伯
- 阿拉伯聯合大公國
- 卡達
- 奈及利亞
- 埃及
- 南非
- 其他中東和非洲地區
- 亞太地區
第6章 競爭情勢
- 市場集中度
- 策略性舉措(併購、合資、產能擴充、技術許可)
- 市佔率分析
- 公司簡介
- Asahi Kasei Corporation
- BASF
- Borealis AG
- CF Industries Holdings, Inc.
- DFPCL
- ENAEX
- EuroChem Group
- Gujarat Narmada Valley Fertilizers & Chemicals Limited
- Hanwha Group
- TKG HUCHEMS
- INEOS
- Incitec Pivot Fertilisers Pty Ltd
- LSB Industries
- MAXAMCORP HOLDING, SL
- Mitsubishi Chemical Group Corporation
- Nutrien
- OCI Global
- Orica Limited
- Sasol
- China Petrochemical Corporation
- Sumitomo Chemical Co., Ltd.
- Yara
- UBE Corporation
第7章 市場機會與未來展望
The Nitric Acid Market was valued at 69.36 Million tons in 2025 and estimated to grow from 71.42 Million tons in 2026 to reach 82.66 Million tons by 2031, at a CAGR of 2.97% during the forecast period (2026-2031).
Sustained investments in low-carbon ammonia, widening explosives demand, and strong fertilizer offtake continue to anchor the nitric acid market, yet rising environmental compliance costs and volatile gas prices are reshaping cost curves. Europe is moving quickly toward green production methods as BAT-AEL standards tighten, while North America leverages blue ammonia projects to improve energy security. Early movers integrating carbon capture, renewable hydrogen, and advanced catalysts are gaining margin resilience as commodity price swings intensify.
Global Nitric Acid Market Trends and Insights
Surging Demand for Low-Carbon Ammonium-Nitrate Fertilisers Across Europe
Europe's fertilizer producers are pivoting toward renewable hydrogen to satisfy the Renewable Energy Directive III requirement that 42% of hydrogen input be renewable by 2030. Early adopters with secured green feedstock face fewer supply shocks and can lock in offtake agreements with food-retail chains seeking lower scope-3 emissions. Leading producers have responded by advancing large-scale CCS projects, with Yara's 2026 Sluiskil CCS facility expected to materially lower Scope 1 emissions. The shift deepens the link between the nitric acid market and the European Union's climate targets, encouraging new joint ventures in green ammonia corridors.
Rising Adoption of Polyamide 6,6 for EU Automotive Lightweighting Targets
The EU passenger-car CO2 cap of 95 g/km is intensifying the substitution of metals with high-performance polymers. Polyamide 6,6 delivers up to 40% weight savings, improving EV range without compromising structural integrity. Because adipic acid, a nitric acid derivative, remains the main precursor, every incremental shift to polyamide 6,6 boosts regional nitric acid demand. Supply chains are refocusing on high-purity grades, prompting planned capacity additions by UBE Corporation for electronic-grade nitric acid to serve polymer producers. Automotive Tier-1 suppliers are aligning long-term resin offtake contracts with nitric acid producers to secure consistent quality and feedstock reliability ahead of stricter Euro 7 regulations.
EU BAT-AEL Tightening for N2O Emissions Raising Capex and Opex
The European Commission's ongoing revision of the LVIC BREF sets lower nitrous oxide benchmarks, compelling retrofits or new abatement installations across aging assets. Capital requirements for secondary-catalyst systems or tertiary destruction units can exceed USD 8 million per line, eroding margins on middle-aged plants. Operators with integrated CCS or advanced burners, such as BOC Limited's CO2 Recovery and Liquefaction plant, enjoy a cost advantage when bidding long-term supply contracts. The policy environment accelerates plant closures or asset swaps, consolidating the nitric acid market around top-tier producers with balance-sheet capacity for compliance investments.
Other drivers and restraints analyzed in the detailed report include:
- Government Incentives for On-Site Weak Nitric Acid Plants in Indian Pharma Clusters
- Increasing Demand from Explosives Manufacturing
- Volatile Natural Gas Prices Squeezing Ammonia-to-Nitric-Acid Margins
For complete list of drivers and restraints, kindly check the Table Of Contents.
Segment Analysis
Weak nitric acid commanded 57.45% of the market share in 2025, reflecting its versatility in fertilizer and intermediate applications. The segment benefits from lower corrosion management expenses, enabling producers to operate single mono-pressure loops with minimal upgrading. The nitric acid market size tied to weak grades is expected to advance steadily as Europe mandates controlled nitrate release fertilizers that rely on weak acid neutralization.
Concentrated nitric acid, accounting for the next-largest volume slice, is gaining momentum at a 3.48% CAGR on the back of rising explosives and electronics requirements. Capacity additions in high-purity lines, notably UBE's expansion in Yamaguchi Prefecture, aim to capture specialty segment premiums. Fuming nitric acid remains niche yet strategically significant for aerospace propulsion.
The Nitric Acid Market Segments the Industry by Concentration (Weak Nitric Acid (less Than or Equal To 68%), Concentrated Nitric Acid (68 To 98%), and Fuming/Red Fuming (more Than 98%)), End-User Industry (Fertilizers, Chemical Manufacturing, Explosives, Aerospace, Inks, Pigments, and Dyes, and Other End-User Industries), and Geography (Asia-Pacific, North America, Europe, South America, and Middle-East and Africa).
Geography Analysis
Asia-Pacific commands 57.60% of the nitric acid market in 2025 and is expanding at 3.62% CAGR as heavy industry, fertilizer usage, and electronics manufacturing grow in tandem. China continues to invest in nitric-based intermediates, though environmental inspections are pushing older units toward catalytic upgrades. India's Dahej project by Deepak Fertilisers adds 450 KTPA combined capacity, lifting the country's self-reliance ratio and reducing net imports.
Europe's share continues to shrink under high energy costs and stringent emission controls. The tightening BAT-AEL limits will push marginal producers either to retrofit or exit, consolidating output among integrated giants such as BASF and Yara. North America benefits from abundant shale gas and evolving blue ammonia ventures. OCI's Beaumont facility adds a low-carbon supply corridor that feeds Gulf Coast nitric and nitrate plants from 2025.
South America remains structurally short on nitrogen, with 95% of Brazil's needs met via imports. Green-fertilizer uptake is rising as soybean producers pursue premium export certifications. However, currency volatility and infrastructure bottlenecks restrict immediate capacity investments in nitric acid.
- Asahi Kasei Corporation
- BASF
- Borealis AG
- CF Industries Holdings, Inc.
- DFPCL
- ENAEX
- EuroChem Group
- Gujarat Narmada Valley Fertilizers & Chemicals Limited
- Hanwha Group
- TKG HUCHEMS
- INEOS
- Incitec Pivot Fertilisers Pty Ltd
- LSB Industries
- MAXAMCORP HOLDING, SL
- Mitsubishi Chemical Group Corporation
- Nutrien
- OCI Global
- Orica Limited
- Sasol
- China Petrochemical Corporation
- Sumitomo Chemical Co., Ltd.
- Yara
- UBE Corporation
Additional Benefits:
- The market estimate (ME) sheet in Excel format
- 3 months of analyst support
TABLE OF CONTENTS
1 Introduction
- 1.1 Study Assumptions and Market Definition
- 1.2 Scope of the Study
2 Research Methodology
3 Executive Summary
4 Market Landscape
- 4.1 Market Overview
- 4.2 Market Drivers
- 4.2.1 Surging Demand for Low-Carbon Ammonium-Nitrate Fertilisers Across Europe
- 4.2.2 Rising Adoption of Polyamide 6,6 (Adipic-Acid Derivative) for EU Automotive Lightweighting Targets
- 4.2.3 Government Incentives for On-Site Weak Nitric-Acid Plants in Indian Nitrate-Based Pharma Clusters
- 4.2.4 Increasing Demand from Explosives Manufacturing
- 4.3 Market Restraints
- 4.3.1 EU BAT-AEL Tightening for N?O Emissions Raising Capex and Opex
- 4.3.2 Volatile Natural-Gas Prices Squeezing Ammonia-to-Nitric-Acid Margins
- 4.3.3 Health Hazards Caused by Nitric Acid
- 4.4 Value Chain Analysis
- 4.5 Porter's Five Forces
- 4.5.1 Bargaining Power of Suppliers
- 4.5.2 Bargaining Power of Buyers
- 4.5.3 Threat of New Entrants
- 4.5.4 Threat of Substitutes
- 4.5.5 Intensity of Competitive Rivalry
- 4.6 Trade Flow Analysis
- 4.7 Cost Analysis
5 Market Size and Growth Forecasts (Value and Volume)
- 5.1 By Concentration
- 5.1.1 Weak Nitric Acid (less than or equal to 68%)
- 5.1.2 Concentrated Nitric Acid (68 to 98%)
- 5.1.3 Fuming/Red Fuming (more than 98%)
- 5.2 By End-user Industry
- 5.2.1 Fertilisers
- 5.2.2 Chemical Manufacturing
- 5.2.3 Explosives
- 5.2.4 Aerospace
- 5.2.5 Inks, Pigments and Dyes
- 5.2.6 Other End-user Industries (Pharmaceuticals and Food Processing)
- 5.3 By Geography
- 5.3.1 Asia-Pacific
- 5.3.1.1 China
- 5.3.1.2 India
- 5.3.1.3 Japan
- 5.3.1.4 South Korea
- 5.3.1.5 Indonesia
- 5.3.1.6 Malaysia
- 5.3.1.7 Vietnam
- 5.3.1.8 Thailand
- 5.3.1.9 Rest of Asia-Pacific
- 5.3.2 North America
- 5.3.2.1 United States
- 5.3.2.2 Canada
- 5.3.2.3 Mexico
- 5.3.3 Europe
- 5.3.3.1 Germany
- 5.3.3.2 United Kingdom
- 5.3.3.3 France
- 5.3.3.4 Italy
- 5.3.3.5 Spain
- 5.3.3.6 Russia
- 5.3.3.7 Turkey
- 5.3.3.8 Nordic
- 5.3.3.9 Rest of Europe
- 5.3.4 South America
- 5.3.4.1 Brazil
- 5.3.4.2 Argentina
- 5.3.4.3 Colombia
- 5.3.4.4 Rest of South America
- 5.3.5 Middle-East and Africa
- 5.3.5.1 Saudi Arabia
- 5.3.5.2 United Arab Emirates
- 5.3.5.3 Qatar
- 5.3.5.4 Nigeria
- 5.3.5.5 Egypt
- 5.3.5.6 South Africa
- 5.3.5.7 Rest of Middle-East and Africa
- 5.3.1 Asia-Pacific
6 Competitive Landscape
- 6.1 Market Concentration
- 6.2 Strategic Moves (Mergers and Acquisitions, JVs, Capacity Expansions, Tech Licensing)
- 6.3 Market Share Analysis
- 6.4 Company Profiles (includes Global level Overview, Market level overview, Core Segments, Financials as available, Strategic Information, Market Rank/Share, Products and Services, Recent Developments)
- 6.4.1 Asahi Kasei Corporation
- 6.4.2 BASF
- 6.4.3 Borealis AG
- 6.4.4 CF Industries Holdings, Inc.
- 6.4.5 DFPCL
- 6.4.6 ENAEX
- 6.4.7 EuroChem Group
- 6.4.8 Gujarat Narmada Valley Fertilizers & Chemicals Limited
- 6.4.9 Hanwha Group
- 6.4.10 TKG HUCHEMS
- 6.4.11 INEOS
- 6.4.12 Incitec Pivot Fertilisers Pty Ltd
- 6.4.13 LSB Industries
- 6.4.14 MAXAMCORP HOLDING, SL
- 6.4.15 Mitsubishi Chemical Group Corporation
- 6.4.16 Nutrien
- 6.4.17 OCI Global
- 6.4.18 Orica Limited
- 6.4.19 Sasol
- 6.4.20 China Petrochemical Corporation
- 6.4.21 Sumitomo Chemical Co., Ltd.
- 6.4.22 Yara
- 6.4.23 UBE Corporation
7 Market Opportunities and Future Outlook
- 7.1 White-space and Unmet-Need Assessment
- 7.2 Technological Developments in Nitric Acid Manufacturing and Recent Government Incentives
 亞硝酸鈉市場-2026-2032年全球市場預測硝酸市場:依純度、形態、包裝、功能、應用及分銷通路分類-2026-2032年全球市場預測
 亞硝酸鈉市場規模、佔有率和趨勢分析報告:按應用、地區和細分市場預測(2026-2033 年)硝酸市場規模、佔有率和趨勢分析報告:按應用、地區和細分市場預測(2026-2033 年)
 半導體硝酸市場:依純度、產品類型、應用、終端用戶產業、國家及地區分類-全球產業分析、市場規模、市場佔有率及2025年至2032年預測
 2026年全球硝酸市場報告亞硝酸鹽市場按形態、亞硝酸鹽試劑、等級、應用和最終用戶分類-全球預測,2026-2032年異丁基亞硝酸鹽市場按產品類型、應用、最終用戶和分銷管道分類,全球預測(2026-2032年)
 亞硝酸鈉市場規模、佔有率及成長分析(按等級類型、應用和地區分類)-2026-2033年產業預測
 硝酸市場規模、佔有率及成長分析(按應用、終端用戶產業及地區分類)-2026-2033年產業預測