


 |
市場調查報告書
商品編碼
1910804
螢石:市場佔有率分析、產業趨勢與統計、成長預測(2026-2031)Fluorspar - Market Share Analysis, Industry Trends & Statistics, Growth Forecasts (2026 - 2031) |
||||||
※ 本網頁內容可能與最新版本有所差異。詳細情況請與我們聯繫。
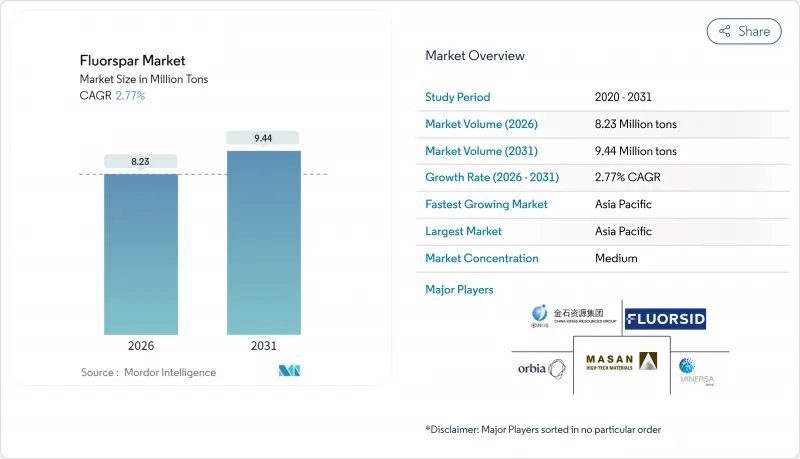
預計螢石市場將從 2025 年的 801 萬噸成長到 2026 年的 823 萬噸,到 2031 年將達到 944 萬噸,2026 年至 2031 年的複合年成長率為 2.77%。
穩定的產量成長反映了該礦物在氫氟酸生產、鋼鐵和鋁冶金以及氟聚合物製造等領域的強勁需求,同時電池、半導體和冷媒供應鏈也湧現出新的需求。中國仍是最大的供應國,佔開採量的60%以上。中國的出口限制促使終端用戶尋求多元化的供應來源,儲備資源,並簽署長期供應協議。
全球螢石市場趨勢與洞察
氟化學品需求的快速成長推動了市場擴張。
低全球暖化潛勢冷媒的出現推動了氫氟酸消費量的快速成長,科慕公司熱感與特種解決方案部門2025年第二季度銷售額環比成長25%便印證了這一點。美國《AIM法案》的實施時間表加快了高全球暖化潛勢氟碳化合物的替代進程,歐盟相應的氟碳化合物法規也推動了歐洲類似的普及。電池市場的成長直接轉化為對氟石的巨大需求,因為每輛電動車在黏合劑、冷卻劑和電線塗層中大約需要30公斤酸性氟石當量。燃料電池膜和氫基礎設施等氟聚合物應用將成為次要需求推動要素。工藝創新也值得關注。韓國一個研究團隊透過先進的電化學方法將氟醚的產率提高了12至16個百分點,這顯示每噸成品氟化學品的原料礦石消耗量有望降低。
新興市場鋼鐵和鋁產量快速成長
預計2024-2025會計年度印度粗鋼產量將達1.51967億噸,年增5.3%。國內消費量也在成長,推動了冶金螢石採購量增加,用於爐渣製備和脫硫。為響應沙烏地阿拉伯的“2030願景”,波灣合作理事會(GCC)成員國的冶煉廠正在提高產能,利用低成本能源來提升鋁產量,從而增加對氟化鋁的需求。推動循環經濟同樣重要。 ScienceDirect的一項研究成功地從廢棄冰晶石中提取出純度高達85.6%的氟化鋁(AlF3),顯示在金屬回收網路發達的地區,再生材料可以取代15-20%的原生酸性礦石需求。
環境法規增加了採礦業的合規成本。
美國環保署 (EPA) 的《聯邦法規》第 40 篇第 436 部分規定,浮選螢石廠必須達到零排放標準,迫使業者投資 1,000 萬至 1,500 萬美元用於漿體濃縮機、壓濾機和電脫水系統。中國的「2024 年安全宣傳活動導致多家小規模礦場的許可證被吊銷,至少減少了 12 萬噸的產能,並加劇了全球供應緊張。蒙古工業中存在的童工問題導致經合組織 (OECD) 的買家被要求對其供應鏈審核,並在某些情況下支付認證溢價。同時,新近最終確定的 PFAS 飲用水標準(PFOA 和 PFOS 均為 4 ppt)擴大了對位於含水層附近的氟化工廠的監測要求。
細分市場分析
2025年,酸級螢石原料在螢石市場中佔61.36%的佔有率,主要得益於純度超過97%的CaF2規格,此規格是合成氫氟酸的關鍵原料。這種高純度原料支撐了為冷凍、鋁提煉和半導體蝕刻劑產業提供原料的化學品製造商的螢石市場規模。磨料級螢石的複合年成長率(CAGR)為4.23%,主要受雷射、光刻和空間感測器系統對光學透鏡的需求所驅動。
製程改進提高了品位柔軟性。中國湖南省一條新的浮選迴路將低品位礦石中的氟化鈣含量從70%提高到95%,實質上將陶瓷級資源轉化為酸性螢石原料。同樣,墨西哥杜蘭戈礦的加壓浸出和溶劑萃取過程也提高了回收率。預計到2031年,北美酸性螢石供應量的成長將使中國在全球螢石貿易中的佔有率從54%下降到47%,從而促進螢石市場的適度多元化。
螢石市場報告按等級(酸性螢石、陶瓷螢石、冶金螢石、光學螢石、寶石螢石)、品種(藍約翰螢石、氯輝石、釔輝石等)、應用領域(冶金、陶瓷、化學、其他)和地區(亞太、北美、歐洲、南美、中東和非洲)進行細分。市場預測以噸為單位。
區域分析
預計到2025年,亞太地區將佔全球螢石市場總量的73.88%,並在2031年之前以2.95%的複合年成長率成長,這主要得益於中國在酸性螢石領域的領先地位以及印度鋼鐵產能的不斷擴大。日本和韓國進口高純度材料用於其電子和電動車供應鏈,其中韓國正在推廣電化學氟化技術,以確保國內氟化學品的生產。
北美地區正從幾乎完全依賴進口向部分自給自足過渡。猶他州的失落綿羊礦預計將於2026年供應6.5萬噸螢石,約占美國進口量的10%。墨西哥是該地區的主要供應國,2024年出口量達1,23萬噸,相當於美國酸性礦石進口量的74%。加拿大聖勞倫斯礦的重新投產預計將於2025年恢復生產,屆時將進一步降低電池級氟化物的供應風險。
西班牙和南非在該地區供應原料,而肯亞目前禁止出口未經國內加工的原料。中東國家已將採礦業視為其經濟支柱,沙烏地阿拉伯2024年對其《礦產法》的修訂授予25年採礦許可證,鼓勵外國投資其前景廣闊的螢石礦床。
其他福利:
- Excel格式的市場預測(ME)表
- 3個月的分析師支持
目錄
第1章 引言
- 研究假設和市場定義
- 調查範圍
第2章調查方法
第3章執行摘要
第4章 市場情勢
- 市場概覽
- 市場促進因素
- 對含氟化學品(低全球暖化潛值冷媒和含氟聚合物)的需求迅速成長
- 亞洲、中東和北非的鋼鐵和鋁產量增加
- 鋰離子電池超級工廠對電池級氟化鋁的需求
- 半導體蝕刻氣體需要超高純度的酸液(報道不足)
- 西方「關鍵礦產」的(被低估的)回流
- 市場限制
- 採礦業更嚴格的環境和尾礦法規
- 中國的出口配額波動與運輸瓶頸(瞞報)
- 氟矽酸替代HF(通報不足)
- 價值鏈分析
- 波特五力模型
- 新進入者的威脅
- 買方的議價能力
- 供應商的議價能力
- 替代品的威脅
- 競爭程度
第5章 市場規模與成長預測
- 按年級
- 酸級
- 陶瓷級
- 冶金級
- 光學級
- 拋光級
- 按類型
- 安托佐尼特
- 藍約翰
- 氯仿
- 這是失敗者
- 釔氟石
- 其他類型
- 透過使用
- 冶金
- 陶瓷
- 化學品
- 其他應用(光學、玻璃、水泥、塗料)
- 按地區
- 亞太地區
- 中國
- 印度
- 日本
- 韓國
- 馬來西亞
- 泰國
- 印尼
- 越南
- 亞太其他地區
- 北美洲
- 美國
- 加拿大
- 墨西哥
- 歐洲
- 德國
- 英國
- 法國
- 義大利
- 西班牙
- 北歐國家
- 土耳其
- 俄羅斯
- 其他歐洲
- 南美洲
- 巴西
- 阿根廷
- 哥倫比亞
- 南美洲其他地區
- 中東和非洲
- 沙烏地阿拉伯
- 阿拉伯聯合大公國
- 卡達
- 奈及利亞
- 埃及
- 南非
- 其他中東和非洲地區
- 亞太地區
第6章 競爭情勢
- 市場集中度
- 策略趨勢
- 市佔率(%)/排名分析
- 公司簡介
- ARES Strategic Mining Inc.
- Chifeng Sky-Horse Fluorspar Mining Co., Ltd.
- China Kings Resources Group Co., Ltd.
- Erdenes Critical Minerals SOE
- Fluorsid
- Kenya Fluorspar Company Ltd.
- Luoyang Fengrui Fluorine Industry Co., Ltd.
- Masan High-Tech Materials Corporation
- MINERSA GROUP
- Orbia
- Sallies Industrial Minerals
- SepFluor
- Sinochem Group Co., Ltd.
- Steyuan Mineral Resources Group Ltd.
- Yingpeng Chemical Co., Ltd.
第7章 市場機會與未來展望
The Fluorspar market is expected to grow from 8.01 Million tons in 2025 to 8.23 Million tons in 2026 and is forecast to reach 9.44 Million tons by 2031 at 2.77% CAGR over 2026-2031.
Stable volume growth reflects the mineral's entrenched use in hydrofluoric-acid production, steel and aluminum metallurgy, and fluoropolymer manufacturing, even as new demand streams emerge from battery, semiconductor, and refrigerant supply chains. China remains the pivotal supplier, responsible for more than 60% of mined output, and its export-control posture is prompting end users to dual-source, stockpile, and enter long-term offtake contracts.
Global Fluorspar Market Trends and Insights
Fluorochemicals Demand Boom Drives Market Expansion
Low-global-warming-potential refrigerants are underpinning a steep rise in hydrofluoric-acid consumption, highlighted by Chemours' 25% sequential revenue jump in its Thermal and Specialized Solutions segment during Q2 2025. The U.S. AIM Act schedule is accelerating replacement of high-GWP HFCs, and parallel EU F-Gas rules are pushing similar adoption curves across Europe. Each electric vehicle uses roughly 30 kg of acid-spar equivalent in binders, coolants, and wire coatings, linking battery growth directly to bulk fluorspar demand. Fluoropolymer applications in fuel-cell membranes and hydrogen infrastructure add a secondary pull. Process innovation is also noteworthy: South Korean researchers lifted hydrofluoroether yield by 12-16 percentage points via an advanced electrochemical route, hinting at future reductions in raw-ore intensity per ton of finished fluorochemical.
Steel and Aluminum Production Surge in Emerging Markets
India's crude-steel output climbed to 151.967 million tons in fiscal 2024-25, up 5.3% year on year, while domestic consumption advanced, driving incremental metallurgical-grade fluorspar procurement for slag-conditioning and desulfurization. Gulf Cooperation Council smelters are scaling capacity under Saudi Vision 2030, leveraging low-cost energy to expand aluminum output and corresponding aluminum-fluoride demand. Circular-economy advances are equally material: a ScienceDirect study achieved 85.6% extraction of high-purity AlF3 from waste cryolite, indicating that secondary feedstock could displace 15-20% of primary acidspar needs in regions with robust metal recycling networks.
Environmental Regulations Increase Mining Compliance Costs
The U.S. Environmental Protection Agency's 40 CFR Part 436 now enforces zero-liquid-discharge standards for flotation-based fluorspar mills, compelling operators to invest USD 10-15 million in paste-thickening, filter-press, and electro-dewatering systems. China's 2024 safety campaign revoked several small-scale licenses, removing at least 120,000 tons of capacity and tightening world supply. Mongolia's sector faces child-labor red flags, obliging OECD buyers to audit supply chains and sometimes pay certification premiums. Meanwhile, newly finalized PFAS drinking-water limits at 4 ppt for PFOA and PFOS broaden monitoring obligations for fluorochemical sites near aquifers.
Other drivers and restraints analyzed in the detailed report include:
- Battery-Grade Aluminum Fluoride Demand Accelerates
- Semiconductor Industry Drives Ultra-Pure Acidspar Demand
- China Export Controls Create Supply Chain Vulnerabilities
For complete list of drivers and restraints, kindly check the Table Of Contents.
Segment Analysis
Acid-grade material retained a 61.36% fluorspar market share in 2025, anchored by more than or equal to 97% CaF2 specifications essential for hydrofluoric-acid synthesis. This high-purity bench underpins the fluorspar market size for chemical producers that serve refrigeration, aluminum-smelting, and semiconductor etchant channels. Lapidary grade is growing at a 4.23% CAGR on the back of optical-lens demand in laser, lithography, and space-borne sensor systems.
Process upgrades are unlocking grade flexibility. New flotation circuits in China's Hunan province raise low-grade ore from 70% to 95% CaF2, effectively converting ceramic-grade resource into acid-spar feed. Pressure-leaching followed by solvent extraction is similarly lifting recovery at Mexico's Durango mines. Through 2031, acid-grade supply additions in North America could trim the Chinese share of global fluorspar trade from 54% to 47%, modestly diversifying the fluorspar market.
The Fluorspar Report is Segmented by Grade (Acid Grade, Ceramic Grade, Metallurgical Grade, Optical Grade, and Lapidary Grade), Variety (Antozonite, Blue John, Chlorophane, Yttrocerite, and More), Application (Metallurgical, Ceramics, Chemicals, and Other Applications), and Geography (Asia-Pacific, North America, Europe, South America, and Middle-East and Africa). The Market Forecasts are Provided in Terms of Volume (Tons).
Geography Analysis
Asia-Pacific anchored 73.88% of the 2025 fluorspar market volume and is projected to expand at a 2.95% CAGR through 2031, fueled by Chinese acidspar dominance and expanding Indian steel capacity. Japan and South Korea import high-purity material for electronics and EV supply chains, with South Korea advancing electrochemical fluorination to secure indigenous fluorochemical production.
North America is transitioning from near-total import reliance toward partial self-sufficiency. Utah's Lost Sheep mine is slated to deliver 65,000 tons of acidspar in 2026, displacing roughly 10% of current U.S. inbound volumes. Mexico remains the region's workhorse, shipping 1.23 million tons in 2024, equal to 74% of U.S. acidspar imports. Canada's St. Lawrence mine revival will further ease supply risk for battery-grade fluoride once production resumes in 2025.
Spain and South Africa furnish regional material, while Kenyan policy now forbids raw export without in-country processing. Middle-Eastern governments are positioning mining as an economic pillar; Saudi Arabia's 2024 minerals law revision grants 25-year exploitation leases, catalyzing foreign investment in prospective fluorite deposits.
- ARES Strategic Mining Inc.
- Chifeng Sky-Horse Fluorspar Mining Co., Ltd.
- China Kings Resources Group Co., Ltd.
- Erdenes Critical Minerals SOE
- Fluorsid
- Kenya Fluorspar Company Ltd.
- Luoyang Fengrui Fluorine Industry Co., Ltd.
- Masan High-Tech Materials Corporation
- MINERSA GROUP
- Orbia
- Sallies Industrial Minerals
- SepFluor
- Sinochem Group Co., Ltd.
- Steyuan Mineral Resources Group Ltd.
- Yingpeng Chemical Co., Ltd.
Additional Benefits:
- The market estimate (ME) sheet in Excel format
- 3 months of analyst support
TABLE OF CONTENTS
1 Introduction
- 1.1 Study Assumptions and Market Definition
- 1.2 Scope of the Study
2 Research Methodology
3 Executive Summary
4 Market Landscape
- 4.1 Market Overview
- 4.2 Market Drivers
- 4.2.1 Fluorochemicals demand boom (low-GWP refrigerants and fluoropolymers)
- 4.2.2 Rising steel and aluminum output in Asia and MENA
- 4.2.3 Battery-grade aluminum-fluoride demand from Li-ion gigafactories
- 4.2.4 Semiconductor-etching gases require ultra-pure acidspar (under-reported)
- 4.2.5 Western "critical-mineral" onshoring incentives (under-reported)
- 4.3 Market Restraints
- 4.3.1 Stricter environmental and tailings rules on mining
- 4.3.2 China export-quota volatility and freight bottlenecks (under-reported)
- 4.3.3 Substitution by fluorosilicic-acid-derived HF (under-reported)
- 4.4 Value Chain Analysis
- 4.5 Porter's Five Forces
- 4.5.1 Threat of New Entrants
- 4.5.2 Bargaining Power of Buyers
- 4.5.3 Bargaining Power of Suppliers
- 4.5.4 Threat of Substitute Products
- 4.5.5 Degree of Competition
5 Market Size and Growth Forecasts (Volume)
- 5.1 By Grade
- 5.1.1 Acid Grade
- 5.1.2 Ceramic Grade
- 5.1.3 Metallurgical Grade
- 5.1.4 Optical Grade
- 5.1.5 Lapidary Grade
- 5.2 By Variety
- 5.2.1 Antozonite
- 5.2.2 Blue John
- 5.2.3 Chlorophane
- 5.2.4 Yttrocerite
- 5.2.5 Yttrofluorite
- 5.2.6 Other Varieties
- 5.3 By Application
- 5.3.1 Metallurgical
- 5.3.2 Ceramics
- 5.3.3 Chemicals
- 5.3.4 Other Applications (Optical, Glass, Cement, and Coatings)
- 5.4 By Geography
- 5.4.1 Asia-Pacific
- 5.4.1.1 China
- 5.4.1.2 India
- 5.4.1.3 Japan
- 5.4.1.4 South Korea
- 5.4.1.5 Malaysia
- 5.4.1.6 Thailand
- 5.4.1.7 Indonesia
- 5.4.1.8 Vietnam
- 5.4.1.9 Rest of Asia-Pacific
- 5.4.2 North America
- 5.4.2.1 United States
- 5.4.2.2 Canada
- 5.4.2.3 Mexico
- 5.4.3 Europe
- 5.4.3.1 Germany
- 5.4.3.2 United Kingdom
- 5.4.3.3 France
- 5.4.3.4 Italy
- 5.4.3.5 Spain
- 5.4.3.6 Nordic Countries
- 5.4.3.7 Turkey
- 5.4.3.8 Russia
- 5.4.3.9 Rest of Europe
- 5.4.4 South America
- 5.4.4.1 Brazil
- 5.4.4.2 Argentina
- 5.4.4.3 Colombia
- 5.4.4.4 Rest of South America
- 5.4.5 Middle-East and Africa
- 5.4.5.1 Saudi Arabia
- 5.4.5.2 United Arab Emirates
- 5.4.5.3 Qatar
- 5.4.5.4 Nigeria
- 5.4.5.5 Egypt
- 5.4.5.6 South Africa
- 5.4.5.7 Rest of Middle-East and Africa
- 5.4.1 Asia-Pacific
6 Competitive Landscape
- 6.1 Market Concentration
- 6.2 Strategic Moves
- 6.3 Market Share (%)/Ranking Analysis
- 6.4 Company Profiles (includes Global level Overview, Market level overview, Core Segments, Financials as available, Strategic Information, Market Rank/Share for key companies, Products and Services, and Recent Developments)
- 6.4.1 ARES Strategic Mining Inc.
- 6.4.2 Chifeng Sky-Horse Fluorspar Mining Co., Ltd.
- 6.4.3 China Kings Resources Group Co., Ltd.
- 6.4.4 Erdenes Critical Minerals SOE
- 6.4.5 Fluorsid
- 6.4.6 Kenya Fluorspar Company Ltd.
- 6.4.7 Luoyang Fengrui Fluorine Industry Co., Ltd.
- 6.4.8 Masan High-Tech Materials Corporation
- 6.4.9 MINERSA GROUP
- 6.4.10 Orbia
- 6.4.11 Sallies Industrial Minerals
- 6.4.12 SepFluor
- 6.4.13 Sinochem Group Co., Ltd.
- 6.4.14 Steyuan Mineral Resources Group Ltd.
- 6.4.15 Yingpeng Chemical Co., Ltd.
7 Market Opportunities and Future Outlook
- 7.1 White-space and Unmet-need Assessment
 螢石市場:2026-2032年全球市場預測(依原料類型、產品類型、應用、終端用戶產業及通路分類)
 全球螢石市場規模、佔有率、趨勢和成長分析報告:2026-2034年全球冶金螢石市場按純度等級、形態、應用和分銷管道分類的預測(2026-2032 年)冶金螢石市場依純度、產品形態、粒度、開採方法、終端用途產業及分銷管道分類-2026年至2032年全球預測酸性氟化物粉末市場按等級、粒度、製造流程、物理形態、應用、終端用戶產業和通路分類-2026年至2032年全球預測酸性螢石市場按類型、應用和通路- 全球預測(2026-2032 年)酸性螢石微粉市場依純度等級、粒徑、通路和應用分類-2026-2032年全球預測酸性螢石粉市場依等級、產品形態、應用及通路分類-2026-2032年全球預測
 螢石市場規模、佔有率和成長分析(按類型、應用、最終用途產業和地區分類)-2026-2033年產業預測
 螢石:全球市場佔有率和排名、總銷售量和需求預測(2025-2031年)