


 |
市場調查報告書
商品編碼
1910718
地理資訊系統(GIS):市場佔有率分析、產業趨勢與統計資料、成長預測(2026-2031)Geographic Information System - Market Share Analysis, Industry Trends & Statistics, Growth Forecasts (2026 - 2031) |
||||||
※ 本網頁內容可能與最新版本有所差異。詳細情況請與我們聯繫。
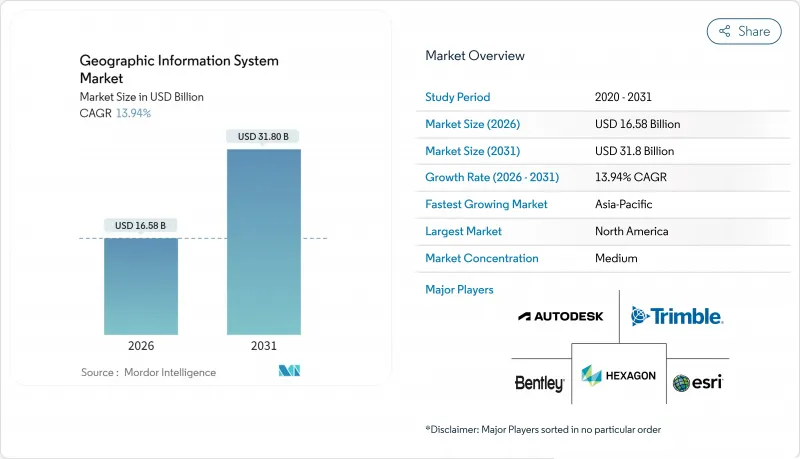
預計到 2025 年,地理資訊系統 (GIS) 市場價值將達到 145.6 億美元,從 2026 年的 165.8 億美元成長到 2031 年的 318 億美元。
預測期(2026-2031 年)的複合年成長率預計為 13.94%。
由於智慧城市的快速部署、國家開放資料政策的推行以及雲端原生技術的普及,市場需求持續成長。從解析度低於30公分的影像中自動提取特徵並進行即時空間分析,可將決策延遲從數週縮短至數分鐘,從而推動交通運輸、石油天然氣和公共等行業的應用。隨著企業將營運網路的擴充性和網路安全置於優先地位,提供整合人工智慧、邊緣處理和託管服務的供應商的市場佔有率持續成長。
全球地理資訊系統市場趨勢與洞察
即時地理空間基礎設施對於智慧城市的廣泛部署至關重要。
城市機構正在將地理資訊系統市場平台與5G、物聯網和邊緣運算相結合,以協調城市服務。新加坡的開放式數位平台透過串流地理空間資料同步區域供冷、廢棄物和能源供應,從而提升事件回應速度和基礎設施運轉率。洛杉磯利用即時儀錶板指導緊急應變團隊,其情境察覺地圖的峰值瀏覽量高達350萬次。隨著市政當局將數位雙胞胎納入累計,提供可擴展3D視覺化、感測器API和增強型網路安全解決方案的供應商正在公共部門IT支出中佔據越來越大的佔有率。
雲端原生GIS可降低整體擁有成本並加快企業整合。
貝爾加拿大公司透過遷移到雲端原生地理空間資料平台,將基礎設施支出減少了 40% 至 60%,這充分體現了容器化微服務和託管升級如何縮短引進週期。基於 Kubernetes 的 ArcGIS Enterprise 及類似解決方案將 GIS 作業與 DevOps 管線整合,在災難時實現動態擴展,避免採購延遲。雲端資料倉儲中的下推分析消除了 ETL 瓶頸,並將地理資訊系統 (GIS) 的市場覆蓋範圍擴展到傳統地圖繪製團隊之外。
將傳統IT系統與OT和SCADA系統整合的複雜性
將現代地理資訊系統 (GIS) 與沿用數十年的 SCADA 系統整合的公共產業面臨資料模型不匹配、通訊協定缺陷以及新興網路威脅等問題。由於需要進行迭代測試和中介軟體開發,Liberty Utilities 的遷移計畫延長了 18 個月。這種延誤導致支出轉向專業服務,並減緩了地理資訊系統市場的軟體轉型進程。
細分市場分析
2026年,地理資訊系統(GIS)市場的業務收益大幅成長,複合年成長率(CAGR)達到15.45%,主要得益於企業雲端遷移、人工智慧模型調優以及外包生命週期支援的推動。託管服務包現已涵蓋資料品質審核、安全性修補程式和全天候監控,從而將支出從資本支出轉向營運預算。軟體仍將佔2025年營收的53.60%,其核心產品組合包括ArcGIS、Hexagon NetWorks和Trimble Cityworks。 Esri持續的更新週期使其能夠將約28%的年收入再投資於研發,以保持其在功能開發方面的領先優勢。同時,其開放的API框架也鼓勵採用第三方擴充功能。雖然接收器、雷射雷達掃描器和抗震平板電腦等硬體仍然必不可少,但隨著功能擴大轉移到軟體層面,其利潤率正在下降。因此,儘管感測器數量不斷增加,但以純硬體出貨量衡量的地理資訊系統市場成長速度較為溫和。
產業負責人更青睞能夠提供以結果為導向的服務等級協議的供應商。例如,Hexagon 決定在 2025 年剝離非核心資產,從而釋放資金以加強其訂閱支援服務。培訓機構、DevOps 工具鏈和認證合作夥伴網路如今已成為重要的選擇標準,這標誌著 GIS 市場正在從關注授權數量轉向關注客戶成功指標。
到2025年,地圖測繪將佔據34.10%的市場佔有率,為所有下游工作流程提供空間背景資訊。然而,分析子領域將以15.70%的複合年成長率實現最快成長,這主要得益於邊緣推理、基礎模型和資料湖架構的推動。企業正在將預測性地理圍欄技術整合到企業資源計畫(ERP)系統中,政府部門正在利用頻譜資料堆疊實施城市熱島模型。測繪產業將保持穩定,無人機攝影測量技術將推動創新,把傳統的地形資料收集週期從一週縮短到當日交貨。
車載資訊系統在電動車路線最佳化和低溫運輸監控方面取得了成功,並專門整合了電動車的續航里程計算功能。定位服務正透過高度個人化的零售應用程式不斷發展,這些應用程式可以觸發店內促銷活動,但與智慧型手機作業系統原生API的衝突限制了供應商的利潤空間。整體而言,地理資訊系統市場正圍繞著整體資料架構原則調整其功能藍圖,將資料收集、編目和人工智慧管道統一到一個統一的管治框架下。
區域分析
北美地區在2025年仍將維持37.80%的支出佔有率,這主要得益於成熟的雲端基礎設施、雄厚的研發資金以及政府的強制性規定,例如美國《地理空間資料法案》(該法案旨在規範互通性和元資料) 。聯邦計畫已撥出多年資金用於野火建模、寬頻公平性測繪和關鍵基礎設施韌性建設。像Trimble這樣的公司每年在創新方面投入超過6.6億美元,其獲得的專利進一步鞏固了該地區的技術優勢。然而,不斷上漲的雲端儲存費用為Petabyte級影像分析帶來了成本挑戰,促使人們開始討論建構區域主權雲。
亞太地區預計將實現15.95%的最高複合年成長率,主要得益於特大城市現代化和基礎設施獎勵策略。新加坡正在擴展3D地下測繪技術以緩解空間限制,而印度的數位雙胞胎計畫將把物流走廊與綜合的包裹級地籍資訊連接起來。沙烏地阿拉伯與Naver公司斥資10億美元開展的數位雙胞胎合作項目,凸顯了海灣地區主導智慧城市產業的雄心壯志。該地區面臨的挑戰包括資料居住規則分散和出口管制法規不一,但國內衛星發射和主權雲區的建設正在降低對外部的依賴性。
在《INSPIRE指令》的支持下,歐洲的成長保持穩定,該指令旨在促進高價值資料集的民主化。開放取用催生了專注於氣候風險評估和可再生能源位置分析的Start-Ups。 GDPR影響了架構設計,推動了隱私增強型運算和區域內處理。儘管南美洲和中東/非洲的規模通常較小,但在礦產探勘、精密農業和基礎設施安全等領域,地理資訊系統(GIS)的應用正在加速發展。這些市場往往直接跳過傳統系統,從一開始就採用雲端原生GIS,透過新的需求推動了地理資訊系統市場的擴張。
其他福利:
- Excel格式的市場預測(ME)表
- 3個月的分析師支持
目錄
第1章 引言
- 研究假設和市場定義
- 調查範圍
第2章調查方法
第3章執行摘要
第4章 市場情勢
- 市場概覽
- 市場促進因素
- 即時地理空間基礎設施對於智慧城市的廣泛部署至關重要。
- 雲端原生GIS降低了整體擁有成本,並加速了企業整合。
- 行動優先的現場數據採集平台擴大了覆蓋範圍
- 人工智慧自動分類技術可加速衛星影像分析
- 30公分以下商用微型衛星衛星星系實現全新高精度應用場景
- 國家開放資料指令(例如歐盟的 INSPIRE 2.0、美國的GDA)將推動其應用。
- 市場限制
- 將傳統IT系統與OT/SCADA系統整合的複雜性
- 群眾外包層中持續存在的資料品質和血緣關係缺陷
- Petabyte級影像歸檔推高了雲端資料傳輸成本
- 加強對高解析度地理空間資料的出口限制
- 價值鏈分析
- 監管環境
- 技術展望
- 產業吸引力-波特五力分析
- 供應商的議價能力
- 買方的議價能力
- 新進入者的威脅
- 替代品的威脅
- 競爭對手之間的競爭
- 宏觀經濟因素如何影響市場
第5章 市場規模與成長預測
- 按組件
- 硬體
- 軟體
- 服務
- 按功能
- 地圖
- 測量
- 車載資訊系統和導航
- 定位服務
- 地理空間資料管理與分析
- 透過部署模式
- 本地部署
- 雲
- 按最終用戶行業分類
- 農業
- 公共產業
- 礦業
- 建造
- 運輸/物流
- 石油和天然氣
- 政府/國防
- 溝通
- 其他終端用戶產業
- 按地區
- 北美洲
- 美國
- 加拿大
- 墨西哥
- 南美洲
- 巴西
- 阿根廷
- 智利
- 南美洲其他地區
- 歐洲
- 德國
- 英國
- 法國
- 義大利
- 西班牙
- 其他歐洲地區
- 亞太地區
- 中國
- 印度
- 日本
- 韓國
- 馬來西亞
- 新加坡
- 澳洲
- 亞太其他地區
- 中東和非洲
- 中東
- 阿拉伯聯合大公國
- 沙烏地阿拉伯
- 土耳其
- 其他中東地區
- 非洲
- 南非
- 奈及利亞
- 其他非洲地區
- 中東
- 北美洲
第6章 競爭情勢
- 市場集中度
- 策略趨勢
- 市佔率分析
- 公司簡介
- Environmental Systems Research Institute, Inc.(Esri)
- Hexagon AB
- Trimble Inc.
- Autodesk, Inc.
- Bentley Systems, Incorporated
- Topcon Positioning Systems, Inc.
- Pitney Bowes, Inc.(Precisely)
- Caliper Corporation
- Mapbox, Inc.
- Maxar Technologies Inc.
- Fugro NV
- SuperMap Software Co., Ltd.
- CARTO(CartoDB Inc.)
- Blue Marble Geographics, LLC
- GIS Cloud Ltd.
- TomTom NV
- Seequent Limited
- Spatialworks, Inc.
- Geosoft Inc.
- Woolpert, Inc.
- NV5 Geospatial Solutions, Inc.
- BlackSky Technology Inc.
第7章 市場機會與未來展望
The Geographic Information System market was valued at USD 14.56 billion in 2025 and estimated to grow from USD 16.58 billion in 2026 to reach USD 31.8 billion by 2031, at a CAGR of 13.94% during the forecast period (2026-2031).
Rapid smart-city roll-outs, national open-data mandates, and cloud-native deployments keep demand on an upward slope. Automated feature extraction from sub-30 cm imagery and real-time spatial analytics now reduce decision latency from weeks to minutes, pushing adoption in transportation, oil and gas, and public safety applications. Vendors that bundle AI, edge processing, and managed services continue to gain share as enterprises prioritize scalability and cyber-secure integration with operational networks.
Global Geographic Information System Market Trends and Insights
Widespread Smart-City Roll-Outs Require Real-Time Geospatial Infrastructure
City agencies are integrating the Geographic information system market platforms with 5G, IoT, and edge compute to orchestrate urban services. Singapore's Open Digital Platform synchronizes district cooling, waste, and energy through streaming geospatial feeds, improving incident response and infrastructure uptime. Los Angeles uses real-time dashboards to route emergency crews, drawing 3.5 million situational-awareness map views during peak events. As municipalities budget for digital twins, vendors that deliver scalable 3D visualization, sensor APIs, and cybersecurity hardening capture a growing portion of public-sector IT spend.
Cloud-Native GIS Lowers TCO and Speeds Enterprise Integration
Bell Canada saved 40-60% in infrastructure outlay by shifting to a cloud-native geospatial data platform, illustrating how containerized micro-services and managed upgrades shorten deployment cycles. ArcGIS Enterprise on Kubernetes and similar offerings align GIS operations with DevOps pipelines, allowing dynamic scaling during disaster events without procurement delays. Push-down analytics in cloud data warehouses eliminate ETL bottlenecks, widening the Geographic information system market addressable base beyond traditional mapping teams.
Legacy IT Integration Complexity with OT and SCADA Systems
Utilities merging modern GIS with decades-old SCADA confront data-model mismatches, protocol gaps, and new cyber-threat surfaces. Liberty Utilities extended its migration timeline by 18 months due to iterative testing and middleware development. These overruns shift spending toward professional services, slowing software conversions in the Geographic information system market.
Other drivers and restraints analyzed in the detailed report include:
- Mobile-First Field-Data-Collection Platforms Expand Addressable User Base
- AI-Powered Auto-Classification of Satellite Imagery Accelerates Analytics
- Persistent Data-Quality / Lineage Gaps in Crowdsourced Layers
For complete list of drivers and restraints, kindly check the Table Of Contents.
Segment Analysis
Services revenue in the Geographic information system market rose sharply in 2026, advancing at a 15.45% CAGR as enterprises outsourced cloud migration, AI model tuning, and lifecycle support. Managed-service bundles now cover data-quality audits, security patching, and 24/7 monitoring, shifting spending from capital to operating budgets. Software still accounts for 53.60% of 2025 sales, anchored by the ArcGIS, Hexagon NetWorks, and Trimble Cityworks portfolios. Their continuous update cadence, Esri reinvests roughly 28% of annual turnover into R&D, keeping feature velocity high, while open-API frameworks welcome third-party extensions. Hardware remains essential for GNSS receivers, lidar scanners, and rugged tablets, yet margins compress as more functions migrate into the software layer. The geographic information system market size tied to pure hardware shipments therefore grows more slowly, even as sensor count climbs.
Industry buyers favor vendors that can deliver outcome-oriented service-level agreements; for example, Hexagon's 2025 decision to divest non-core assets freed capital to bolster subscription support offerings. Training academies, DevOps toolchains, and certified partner networks now form critical selection criteria, signaling a pivot from license counts to customer success metrics across the Geographic information system market.
Mapping held a 34.10% share in 2025, furnishing the spatial context for every downstream workflow. Yet the analytics sub-segment is expanding fastest at 15.70% CAGR, powered by edge inference, foundation models, and data-lakehouse architectures. Enterprises embed predictive geofencing into ERPs, while authorities model urban heat islands through multi-spectral stacks. Surveying remains steady, reinvented through drone photogrammetry that compresses week-long terrain captures into same-day deliverables.
Telematics gains from electric-vehicle routing and cold-chain monitoring, integrating EV-specific range calculations. Location-based services flourish via hyper-personalized retail apps that trigger in-store promotions, though competition from native smartphone OS APIs keeps vendor margins in check. Overall, the Geographic information system market aligns functional roadmaps around holistic data-fabric principles, merging ingestion, cataloging, and AI pipelines under a single governance umbrella.
The Geographic Information System (GIS) Market Report is Segmented by Component (Hardware, Software, and Services), Function (Mapping, Surveying, and More), Deployment Mode (On-Premise and Cloud), End-User Industry (Agriculture, Utilities, Mining, Construction, and More), and Geography. The Market Forecasts are Provided in Terms of Value (USD).
Geography Analysis
North America preserved 37.80% of 2025 spending, thanks to mature cloud infrastructure, robust R&D funding, and agency mandates like the U.S. Geospatial Data Act that standardize interoperability and metadata. Federal programs secure multi-year budgets for wildfire modeling, broadband equity mapping, and critical-infrastructure resilience. Enterprises such as Trimble invest more than USD 660 million annually in innovation, generating patents that reinforce the region's technological edge. Yet rising cloud-de-storage fees pose cost challenges for petabyte-class imagery analytics, motivating negotiations for localized sovereign clouds.
Asia-Pacific is on track for the highest 15.95% regional CAGR, fuelled by megacity modernization and infrastructure stimulus. Singapore scales 3D underground mapping to mitigate space constraints, while India's Digital Twin Mission links logistics corridors with unified parcel-level cadasters. Saudi Arabia's USD 1 billion digital-twin collaboration with Naver underscores Gulf ambitions for smart-city leadership. Regional hurdles include fragmented data-residency rules and varying export controls, yet domestic satellite launches and sovereign cloud zones are mitigating dependencies.
Europe's growth remains steady, anchored by the INSPIRE directive that democratizes high-value datasets. Open access spawns start-ups specializing in climate-risk scoring and renewable-siting analytics. GDPR influences architecture design, spurring privacy-enhancing computation and in-region processing. South America, the Middle East, and Africa together represent a smaller base but display accelerated adoption in mineral exploration, precision agriculture, and infrastructure security. These markets often leapfrog legacy systems, adopting cloud-native GIS from inception, thereby enlarging the Geographic information system market size through greenfield demand.
- Environmental Systems Research Institute, Inc. (Esri)
- Hexagon AB
- Trimble Inc.
- Autodesk, Inc.
- Bentley Systems, Incorporated
- Topcon Positioning Systems, Inc.
- Pitney Bowes, Inc. (Precisely)
- Caliper Corporation
- Mapbox, Inc.
- Maxar Technologies Inc.
- Fugro N.V.
- SuperMap Software Co., Ltd.
- CARTO (CartoDB Inc.)
- Blue Marble Geographics, LLC
- GIS Cloud Ltd.
- TomTom N.V.
- Seequent Limited
- Spatialworks, Inc.
- Geosoft Inc.
- Woolpert, Inc.
- NV5 Geospatial Solutions, Inc.
- BlackSky Technology Inc.
Additional Benefits:
- The market estimate (ME) sheet in Excel format
- 3 months of analyst support
TABLE OF CONTENTS
1 INTRODUCTION
- 1.1 Study Assumptions and Market Definition
- 1.2 Scope of the Study
2 RESEARCH METHODOLOGY
3 EXECUTIVE SUMMARY
4 MARKET LANDSCAPE
- 4.1 Market Overview
- 4.2 Market Drivers
- 4.2.1 Widespread smart-city roll-outs require real-time geospatial infrastructure
- 4.2.2 Cloud-native GIS lowers TCO and speeds enterprise integration
- 4.2.3 Mobile-first field-data-collection platforms expand addressable user base
- 4.2.4 AI-powered auto-classification of satellite imagery accelerates analytics
- 4.2.5 Sub-30 cm commercial microsatellite constellations unlock new precision use-cases
- 4.2.6 National open-data mandates (EU INSPIRE 2.0, US GDA, etc.) drive adoption
- 4.3 Market Restraints
- 4.3.1 Legacy IT integration complexity with OT and SCADA systems
- 4.3.2 Persistent data-quality/lineage gaps in crowdsourced layers
- 4.3.3 Rising cloud-egress fees for petabyte-scale imagery archives
- 4.3.4 Export-control tightening on high-resolution geospatial data
- 4.4 Value Chain Analysis
- 4.5 Regulatory Landscape
- 4.6 Technological Outlook
- 4.7 Industry Attractiveness - Porter's Five Forces Analysis
- 4.7.1 Bargaining Power of Suppliers
- 4.7.2 Bargaining Power of Buyers
- 4.7.3 Threat of New Entrants
- 4.7.4 Threat of Substitutes
- 4.7.5 Intensity of Competitive Rivalry
- 4.8 Impact of Macroeconomic Factors on the Market
5 MARKET SIZE AND GROWTH FORECASTS (VALUES)
- 5.1 By Component
- 5.1.1 Hardware
- 5.1.2 Software
- 5.1.3 Services
- 5.2 By Function
- 5.2.1 Mapping
- 5.2.2 Surveying
- 5.2.3 Telematics and Navigation
- 5.2.4 Location-based Services
- 5.2.5 Geospatial Data Management and Analysis
- 5.3 By Deployment Mode
- 5.3.1 On-premise
- 5.3.2 Cloud
- 5.4 By End-user Industry
- 5.4.1 Agriculture
- 5.4.2 Utilities
- 5.4.3 Mining
- 5.4.4 Construction
- 5.4.5 Transportation and Logistics
- 5.4.6 Oil and Gas
- 5.4.7 Government and Defence
- 5.4.8 Telecommunications
- 5.4.9 Other End-user Industries
- 5.5 By Geography
- 5.5.1 North America
- 5.5.1.1 United States
- 5.5.1.2 Canada
- 5.5.1.3 Mexico
- 5.5.2 South America
- 5.5.2.1 Brazil
- 5.5.2.2 Argentina
- 5.5.2.3 Chile
- 5.5.2.4 Rest of South America
- 5.5.3 Europe
- 5.5.3.1 Germany
- 5.5.3.2 United Kingdom
- 5.5.3.3 France
- 5.5.3.4 Italy
- 5.5.3.5 Spain
- 5.5.3.6 Rest of Europe
- 5.5.4 Asia-Pacific
- 5.5.4.1 China
- 5.5.4.2 India
- 5.5.4.3 Japan
- 5.5.4.4 South Korea
- 5.5.4.5 Malaysia
- 5.5.4.6 Singapore
- 5.5.4.7 Australia
- 5.5.4.8 Rest of Asia-Pacific
- 5.5.5 Middle East and Africa
- 5.5.5.1 Middle East
- 5.5.5.1.1 United Arab Emirates
- 5.5.5.1.2 Saudi Arabia
- 5.5.5.1.3 Turkey
- 5.5.5.1.4 Rest of Middle East
- 5.5.5.2 Africa
- 5.5.5.2.1 South Africa
- 5.5.5.2.2 Nigeria
- 5.5.5.2.3 Rest of Africa
- 5.5.5.1 Middle East
- 5.5.1 North America
6 COMPETITIVE LANDSCAPE
- 6.1 Market Concentration
- 6.2 Strategic Moves
- 6.3 Market Share Analysis
- 6.4 Company Profiles (includes Global level Overview, Market level overview, Core Segments, Financials as available, Strategic Information, Market Rank/Share for key companies, Products and Services, and Recent Developments)
- 6.4.1 Environmental Systems Research Institute, Inc. (Esri)
- 6.4.2 Hexagon AB
- 6.4.3 Trimble Inc.
- 6.4.4 Autodesk, Inc.
- 6.4.5 Bentley Systems, Incorporated
- 6.4.6 Topcon Positioning Systems, Inc.
- 6.4.7 Pitney Bowes, Inc. (Precisely)
- 6.4.8 Caliper Corporation
- 6.4.9 Mapbox, Inc.
- 6.4.10 Maxar Technologies Inc.
- 6.4.11 Fugro N.V.
- 6.4.12 SuperMap Software Co., Ltd.
- 6.4.13 CARTO (CartoDB Inc.)
- 6.4.14 Blue Marble Geographics, LLC
- 6.4.15 GIS Cloud Ltd.
- 6.4.16 TomTom N.V.
- 6.4.17 Seequent Limited
- 6.4.18 Spatialworks, Inc.
- 6.4.19 Geosoft Inc.
- 6.4.20 Woolpert, Inc.
- 6.4.21 NV5 Geospatial Solutions, Inc.
- 6.4.22 BlackSky Technology Inc.
7 MARKET OPPORTUNITIES AND FUTURE OUTLOOK
- 7.1 White-space and Unmet-Need Assessment
 地理資訊系統(GIS)市場:按組件、技術類型、設備、功能、部署模式、最終用戶產業和應用分類-2026-2032年全球市場預測基於雲端的地理資訊系統 (GIS) 市場:按組件、定價模式、企業規模、行業和應用分類——2026-2032 年全球市場預測
 2026年全球國防地空市場報告2026年全球雲端地理資訊系統(GIS)市場報告2026年全球地理資訊系統市場報告2026年全球地理資訊系統(GIS)軟體市場報告
 雲端GIS市場規模、佔有率和成長分析:按最終用戶、雲端服務類型、市場洞察和地區分類-2026-2033年產業預測
 3D地質建模市場-全球產業規模、佔有率、趨勢、機會與預測:按技術、部署模式、產品、地區和競爭格局分類,2021-2031年GIS控制器市場-全球產業規模、佔有率、趨勢、機會、預測:按組件、設備、應用、地區和競爭對手分類,2021-2031年地理資訊系統市場-全球產業規模、佔有率、趨勢、機會和預測:按組件、功能、最終用戶產業、地區和競爭格局分類,2021-2031年