


 |
市場調查報告書
商品編碼
1910712
多晶矽:市場佔有率分析、產業趨勢與統計、成長預測(2026-2031)Polysilicon - Market Share Analysis, Industry Trends & Statistics, Growth Forecasts (2026 - 2031) |
||||||
※ 本網頁內容可能與最新版本有所差異。詳細情況請與我們聯繫。
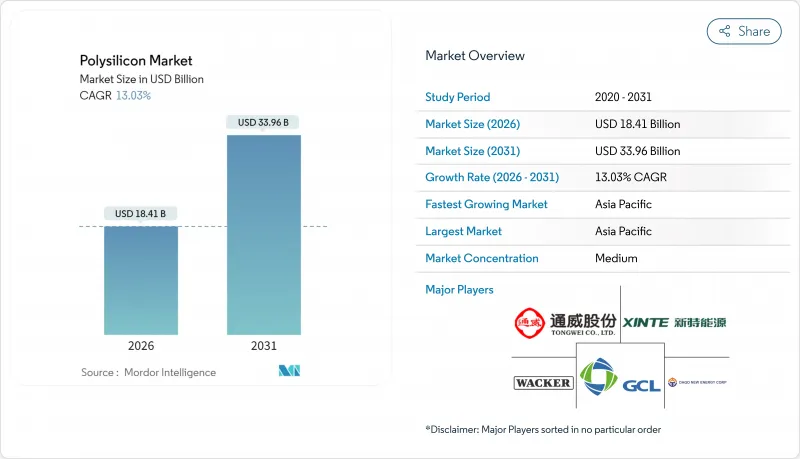
預計到 2025 年,多晶矽市場價值將達到 162.9 億美元,從 2026 年的 184.1 億美元成長到 2031 年的 339.6 億美元,在預測期(2026-2031 年)內,複合年成長率將達到 13.03%。
這一成長軌跡主要得益於太陽能光伏產能的快速擴張、半導體資本投資的成長以及旨在促進區域供應多元化的政策獎勵。向N型拓樸絕緣體和異質結電池結構的快速轉型正在擴大普通級和高階級矽之間的純度差距,而閉合迴路矽回收利用正穩步邁向市電平價的目標。同時,歐美強制勞動限制措施重塑了貿易路線,造成了雙重定價環境,有利於新疆以外地區可追溯的材料。由於中國產運轉率仍低於40%,成本壓力依然強勁,儘管長期半導體合約維持了超高純度矽生產商的利潤率,但現貨價格卻呈下降趨勢。
全球多晶矽市場趨勢及展望
全球太陽能發電規模大規模擴張
全球光電發電裝置容量預計將從2022年的191吉瓦激增132%至2023年的444吉瓦,這將提振多晶矽市場需求,同時也加劇上游供應鏈的緊張。開發商爭相在中國2025年6月上網電價補貼政策調整前鎖定組件,導致原物料採購前置作業時間超過通常的18個月。儘管中國的新反應器已開始運作,但由於試運行延遲,高效級多晶矽庫存仍然緊張。印度和東南亞的計劃開發進一步收緊了供應,儘管目前價格疲軟,但仍為未來多年的成長奠定了基礎。期貨合約交易表明,買家仍然願意為可追溯的非新疆產多晶矽支付溢價,以確保符合美國和歐洲的監管要求。
人工智慧主導的半導體資本投資超級週期
由於對污染容許度要求更高,3奈米及以下製程的先進邏輯和記憶體晶圓廠每片晶圓消耗的高純度多晶矽量是傳統晶圓廠的三倍。每年超過2000億美元的晶圓代工廠投資用於支持長期供應契約,從而保護供應商免受太陽能價格波動的影響。美國《晶片法案》(520億美元)和歐盟《晶片法案》旨在到2030年將區域晶圓產量提高到全球佔有率的20%,這將為北美和歐洲創造額外的多晶矽需求。符合11N級規格的生產商可以獲得比太陽能級產品高出300%至400%的價格溢價,從而確保利潤並為其資金籌措。
長期產能過剩
2025年第一季,中國製造商的運轉率維持在約33%,現貨價格從每噸72,100元人民幣暴跌至34,000元人民幣,迫使他們以低於現金成本的價格出售產品。這種供應過剩源自於2021年至2023年間產能擴張速度超過晶圓生產線擴張速度,導致多晶矽市場在2026年之前一直處於清算價格驅動的格局。北京的節能審核可能會導致20%至30%的小規模反應器關閉,但具體時間尚不清楚。在實現合理化之前,電力和TCS成本高的生產商將面臨負利潤,並限制資本投資,從而限制了近期維修。
細分市場分析
到2025年,西門子反應器將維持66.42%的多晶矽市場佔有率,其生產的11N級產品深受太陽能和半導體行業買家的青睞。然而,大宗商品價格的持續下跌使得電力消耗日益受到關注。西門子生產線每公斤耗電60-70千瓦時,這給高成本地區的利潤率帶來了壓力。由於連續粉末排放,流體化床反應器(FBR)多晶矽市場預計將以14.18%的複合年成長率快速成長,這得益於其能耗降低25%以及每噸資本支出的減少。清華大學的最新研究證實,最佳化後的FBR塔的沉積速率提高了40%,促使人們將其應用於現有設備的維修。然而,FBR供應商必須先解決粉末污染的風險,才能排放半導體市場。雖然先進冶金級矽目前仍是一個小眾市場,但加拿大和挪威的先導工廠表明,尋求控制成本的垂直整合晶圓公司對先進冶金級矽的興趣日益濃厚。
電力價格套利正在重塑全球投資格局。中東計劃正以低於0.03美元/千瓦時的價格利用可再生能源,這使得部署西門子設備生產10N級太陽能材料成為可能。同時,美國墨西哥灣沿岸的輸電線路正在採用聯合循環燃氣發電,並利用第45X條稅收抵免政策。環境法規也產生了影響,歐洲相關人員要求揭露生命週期二氧化碳排放量。流體化床反應器(FBR)因其低碳足跡而備受認可。整體而言,在多晶矽市場的區域能源格局中,技術選擇正成為平衡資本支出、營運成本、純度和碳排放標準的策略工具。
區域分析
亞太地區保持主導地位,預計到2025年將佔據多晶矽市場65.70%的收入佔有率,這主要得益於中國從石英礦開採到組件組裝的完整供應鏈。儘管中國名目產能因地方政府的優惠政策而超過40萬噸,但長期供應過剩導致工廠運轉率低下,利潤率下降。印度是重要的戰略需求來源。除非國內矽生產能夠實現,否則印度要實現2030年500吉瓦可再生能源目標,每年需要進口超過15萬噸矽。日本和韓國專注於半導體級矽的生產,並利用其長期累積的純度技術,但高昂的電力成本阻礙了現有工廠的擴張。
北美正步入復甦期,製造業在《反通膨法案》的推動下重獲新生。 REC Silicon位於摩西湖的工廠將運作,預計到2026年將供應1.4萬噸FBR粉末。然而,美國的太陽能發電裝置容量可能超過每年50吉瓦,這將造成結構性短缺,需要從馬來西亞和德國進口來填補。根據《維吾爾強迫勞動預防法》實施的301條款關稅和扣押措施,使物流變得複雜,催生了可追溯貨物的高階現貨市場。加拿大正在對一座年產1萬噸半導體級粉末的工廠進行可行性研究,該工廠將利用水力發電提供低碳電力。
歐洲面臨著如何在雄心勃勃的「適合55歲人群」目標與飆升的工業用電價格之間取得平衡的挑戰,目前工業用電價格平均為0.27歐元/千瓦時(是美國的兩倍)。然而,挪威的水力發電盈餘正在推動流化床提案(FBR)設施的建設,這些設施旨在實現範圍2淨零排放,而歐盟組件買家非常重視這項認證要求。
中東國家正尋求能源成本套利。阿曼的10萬噸計劃旨在利用低於0.03美元/千瓦時的太陽能發電和港口接近性,向亞洲和非洲供應能源。非洲是一個新興市場,埃及和摩洛哥正在研究利用與國內太陽能目標相關的冶煉廠生產超細顆粒(UMG)的路線。
其他福利:
- Excel格式的市場預測(ME)表
- 3個月的分析師支持
目錄
第1章 引言
- 研究假設和市場定義
- 調查範圍
第2章調查方法
第3章執行摘要
第4章 市場情勢
- 市場概覽
- 市場促進因素
- 全球大規模擴大太陽能發電建設(大型電廠+分散式系統)
- 人工智慧主導的半導體資本支出超級週期(3nm及以下製程節點)
- IRA-/Fit-for-55 措施旨在促進多晶矽回流日本
- 新一代N型TOPCon/IBC電池對超高純度多晶矽的需求日益成長。
- 閉合迴路矽回收經濟效益將在2030年達到與市電平價
- 市場限制
- 2024-2026年期間,長期供應過剩且價格低於現金成本。
- 低規格太陽能發電領域中 UMG-Si 替代的風險
- 西方對來自新疆維吾爾自治區的資料進行強制勞動審核的規定
- 價值鏈分析
- 波特五力模型
- 供應商的議價能力
- 買方的議價能力
- 新進入者的威脅
- 替代品的威脅
- 競爭程度
- 技術概述
第5章 市場規模與成長預測
- 透過製造程序
- 西門子(TCS-CVD)
- 流體化床反應器(矽烷-FBR)
- 升級冶金級(UMG)
- 按最終用戶行業分類
- 太陽能發電
- 單晶矽太陽能板
- 多結晶矽太陽能電池板
- 電子和半導體
- 太陽能發電
- 按地區
- 亞太地區
- 中國
- 印度
- 日本
- 韓國
- 亞太其他地區
- 北美洲
- 美國
- 加拿大
- 墨西哥
- 歐洲
- 德國
- 英國
- 法國
- 義大利
- 其他歐洲地區
- 南美洲
- 巴西
- 阿根廷
- 南美洲其他地區
- 中東和非洲
- 沙烏地阿拉伯
- 南非
- 其他中東和非洲地區
- 亞太地區
第6章 競爭情勢
- 市場集中度
- 策略趨勢
- 市佔率(%)/排名分析
- 公司簡介
- Asia Silicon(Qinghai)Co. Ltd
- DAQO NEW ENERGY CO. LTD
- GCL-TECH
- Hemlock Semiconductor Operations LLC and Hemlock Semiconductor LLC
- Mitsubishi Polycrystalline Silicon America Corporation
- OCI Company Ltd
- Qatar Solar Technologies
- REC Silicon ASA
- Sichuan Yongxiang Co. Ltd(Tongwei)
- Tokuyama Corporation
- Tongwei Co., Ltd
- United Solar Polysilicon(FZC)SPC
- Wacker Chemie AG
- Xinte Energy Co. Ltd
第7章 市場機會與未來展望
The Polysilicon Market was valued at USD 16.29 billion in 2025 and estimated to grow from USD 18.41 billion in 2026 to reach USD 33.96 billion by 2031, at a CAGR of 13.03% during the forecast period (2026-2031).
This growth trajectory stems from surging solar-PV build-outs, rising semiconductor capital expenditure, and policy incentives that promote regional supply diversification. A sharp pivot toward N-type TOPCon and heterojunction cell architectures is widening the purity gap between commodity and premium grades, while closed-loop silicon recycling advances steadily toward grid-parity economics. Meanwhile, Western forced-labor rules are redrawing trade lanes, creating a dual-pricing environment that rewards traceable, non-Xinjiang feedstock. Cost pressures remain intense as Chinese utilization rates hover below 40%, depressing spot prices even as long-term semiconductor contracts preserve margins for ultra-high-purity producers.
Global Polysilicon Market Trends and Insights
Massive Global Solar-PV Build-Out
Global PV installations accelerated from 191 GW in 2022 to 444 GW in 2023, a 132% surge that compressed upstream supply chains and fortified polysilicon market demand. Developers raced to lock in modules ahead of China's June 2025 grid-tariff shift, stretching feedstock lead times beyond typical 18-month capacity additions. Although fresh Chinese reactors are entering service, commissioning lags keep inventories thin in high-efficiency grades. Project pipelines in India and Southeast Asia compound the pull on available volumes, reinforcing a multi-year growth runway despite current price softness. Forward contract activity indicates that buyers remain willing to pay premiums for traceable, non-Xinjiang material to ensure regulatory compliance in the United States and Europe.
AI-Driven Semiconductor CAPEX Super-Cycle
Advanced logic and memory fabs below the 3-nm node consume up to triple the high-purity polysilicon per wafer versus legacy lines because of tighter contamination thresholds. Annual foundry investments topping USD 200 billion underpin long-dated offtake agreements that shield suppliers from solar price volatility. The U.S. CHIPS Act (USD 52 billion) and the EU Chips Act together aim to boost local wafer output to 20% of global share by 2030, pulling incremental polysilicon tonnage into North America and Europe. Producers capable of 11N-grade specifications capture 300-400% price premiums over solar-grade parcels, cushioning margins and funding process upgrades.
Prolonged Capacity Overhang
Chinese producers ran at roughly 33% utilization in Q1 2025, selling below cash costs as spot prices plunged from CNY 72,100 to CNY 34,000 per ton. The glut stems from 2021-23 build-outs that outpaced wafer line expansions, locking the polysilicon market into a clearing-price mentality through 2026. Beijing's energy-efficiency audits may shutter 20-30% of sub-scale reactors, but the timing remains uncertain. Until rationalization materializes, producers with higher electricity or TCS costs face negative margins and constrained capex, limiting near-term technology retrofits.
Other drivers and restraints analyzed in the detailed report include:
- IRA and Fit-for-55 Onshoring Incentives
- Closed-Loop Silicon Recycling Reaches Parity
- UMG Silicon Substitution Threat
For complete list of drivers and restraints, kindly check the Table Of Contents.
Segment Analysis
Siemens reactors retained a 66.42% polysilicon market share in 2025, producing 11N-grade output prized by both solar and semiconductor buyers. Yet, sustained commodity price erosion heightens focus on power consumption; Siemens lines draw 60-70 kWh per kilogram, pressuring margins in high-tariff regions. The polysilicon market size for Fluidized Bed Reactor (FBR) output is projected to surge at 14.18% CAGR, aided by 25% lower electricity use and continuous powder discharge that trims capex per tonne. Recent Tsinghua University studies confirm 40% higher deposition rates in optimized FBR columns, bolstering adoption for brownfield retrofits. Still, FBR vendors must address powder contamination risks to penetrate the semiconductor space. Upgraded metallurgical-grade silicon occupies a niche today, but pilot plants in Canada and Norway signal growing interest among vertically integrated wafer firms seeking cost ceilings.
Power-price arbitrage is shaping global investment patterns: Middle East projects leverage sub-USD 0.03/kWh renewables to justify Siemens builds targeting 10N-grade solar feedstock, while U.S. Gulf Coast lines employ combined-cycle gas to exploit Section 45X tax rebates. Environmental scrutiny also plays a role; European financiers require lifecycle CO2 disclosures, favoring FBR's lower per-kilogram carbon footprint. Overall, technology choice is becoming a strategic lever, balancing capex, opex, purity, and carbon criteria across regional energy landscapes within the polysilicon market.
The Polysilicon Market Report is Segmented by Production Process (Siemens (TCS-CVD), Fluidized Bed Reactor (Silane-FBR), Upgraded Metallurgical-Grade (UMG)), End-User Industry (Solar Photovoltaics, Electronics and Semiconductors), and Geography (Asia-Pacific, North America, Europe, South America, Middle East and Africa). The Market Forecasts are Provided in Terms of Value (USD).
Geography Analysis
Asia-Pacific dominated the polysilicon market with 65.70% revenue share in 2025, riding on China's integrated supply chain that spans quartz mining to module assembly. Provincial incentives helped Chinese nameplate capacity exceed 400 kilotonnes, yet chronic oversupply slashed plant utilization and triggered margin erosion. India adds a strategic demand layer: its 500 GW renewables target by 2030 implies annual silicon imports exceeding 150 kilotonnes unless local ventures materialize. Japan and South Korea focus on semiconductor-grade volumes, leveraging long-standing purity expertise but facing high electricity costs that hinder brownfield expansions.
North America enters a renaissance phase as the Inflation Reduction Act re-anchors manufacturing. REC Silicon's Moses Lake restart will deliver 14 kilotonnes of FBR powder by 2026, but U.S. solar installations could exceed 50 GW annually, leaving a structural deficit covered by imports from Malaysia and Germany. Section 301 tariffs and Uyghur Forced Labor Prevention Act detentions complicate logistics, fostering a premium spot market for traceable cargoes. Canada offers hydropower-driven low-carbon electricity, drawing feasibility studies for semiconductor-grade plants aiming at 10-kilotonne scales.
Europe balances ambitious Fit-for-55 targets against steep industrial power tariffs that average EUR 0.27/kWh, twice U.S. levels. Nevertheless, Norway's hydro surplus underpins proposals for FBR facilities targeting net-zero Scope 2 emissions, a credential valued by EU module buyers.
Middle East actors pursue energy-cost arbitrage: Oman's 100-kilotonne project leverages sub-USD 0.03/kWh solar power and port proximity to serve Asia and Africa. Africa remains an emerging market, with Egypt and Morocco investigating smelter-enabled UMG pathways linked to domestic solar goals.
- Asia Silicon (Qinghai) Co. Ltd
- DAQO NEW ENERGY CO. LTD
- GCL-TECH
- Hemlock Semiconductor Operations LLC and Hemlock Semiconductor LLC
- Mitsubishi Polycrystalline Silicon America Corporation
- OCI Company Ltd
- Qatar Solar Technologies
- REC Silicon ASA
- Sichuan Yongxiang Co. Ltd (Tongwei)
- Tokuyama Corporation
- Tongwei Co., Ltd
- United Solar Polysilicon (FZC) SPC
- Wacker Chemie AG
- Xinte Energy Co. Ltd
Additional Benefits:
- The market estimate (ME) sheet in Excel format
- 3 months of analyst support
TABLE OF CONTENTS
1 Introduction
- 1.1 Study Assumptions and Market Definition
- 1.2 Scope of the Study
2 Research Methodology
3 Executive Summary
4 Market Landscape
- 4.1 Market Overview
- 4.2 Market Drivers
- 4.2.1 Massive global solar-PV build-out (utility-scale + distributed)
- 4.2.2 AI-driven semiconductor CAPEX super-cycle (3-nm and below nodes)
- 4.2.3 IRA-/Fit-for-55-driven polysilicon onshoring incentives
- 4.2.4 Next-gen N-type TOPCon/IBC cell demand for ultra-high-purity poly
- 4.2.5 Closed-loop silicon recycling economics reach grid parity (2030)
- 4.3 Market Restraints
- 4.3.1 Prolonged 2024-26 capacity overhang and sub-cash-cost pricing
- 4.3.2 UMG-Si substitution risk in low-spec PV segments
- 4.3.3 Western forced-labour audit rules on Xinjiang feedstock
- 4.4 Value Chain Analysis
- 4.5 Porter's Five Forces
- 4.5.1 Bargaining Power of Suppliers
- 4.5.2 Bargaining Power of Buyers
- 4.5.3 Threat of New Entrants
- 4.5.4 Threat of Substitutes
- 4.5.5 Degree of Competition
- 4.6 Technological Snapshot
5 Market Size and Growth Forecasts (Value)
- 5.1 By Production Process
- 5.1.1 Siemens (TCS-CVD)
- 5.1.2 Fluidized Bed Reactor (Silane-FBR)
- 5.1.3 Upgraded Metallurgical-Grade (UMG)
- 5.2 By End-user Industry
- 5.2.1 Solar Photovoltaics
- 5.2.1.1 Monocrystalline Solar Panel
- 5.2.1.2 Multicrystalline Solar Panel
- 5.2.2 Electronics and Semiconductors
- 5.2.1 Solar Photovoltaics
- 5.3 By Geography
- 5.3.1 Asia-Pacific
- 5.3.1.1 China
- 5.3.1.2 India
- 5.3.1.3 Japan
- 5.3.1.4 South Korea
- 5.3.1.5 Rest of Asia-Pacific
- 5.3.2 North America
- 5.3.2.1 United States
- 5.3.2.2 Canada
- 5.3.2.3 Mexico
- 5.3.3 Europe
- 5.3.3.1 Germany
- 5.3.3.2 United Kingdom
- 5.3.3.3 France
- 5.3.3.4 Italy
- 5.3.3.5 Rest of Europe
- 5.3.4 South America
- 5.3.4.1 Brazil
- 5.3.4.2 Argentina
- 5.3.4.3 Rest of South America
- 5.3.5 Middle East and Africa
- 5.3.5.1 Saudi Arabia
- 5.3.5.2 South Africa
- 5.3.5.3 Rest of Middle East and Africa
- 5.3.1 Asia-Pacific
6 Competitive Landscape
- 6.1 Market Concentration
- 6.2 Strategic Moves
- 6.3 Market Share (%)**/Ranking Analysis
- 6.4 Company Profiles (includes Global level Overview, Market level overview, Core Segments, Financials as available, Strategic Information, Market Rank/Share, Products and Services, Recent Developments)
- 6.4.1 Asia Silicon (Qinghai) Co. Ltd
- 6.4.2 DAQO NEW ENERGY CO. LTD
- 6.4.3 GCL-TECH
- 6.4.4 Hemlock Semiconductor Operations LLC and Hemlock Semiconductor LLC
- 6.4.5 Mitsubishi Polycrystalline Silicon America Corporation
- 6.4.6 OCI Company Ltd
- 6.4.7 Qatar Solar Technologies
- 6.4.8 REC Silicon ASA
- 6.4.9 Sichuan Yongxiang Co. Ltd (Tongwei)
- 6.4.10 Tokuyama Corporation
- 6.4.11 Tongwei Co., Ltd
- 6.4.12 United Solar Polysilicon (FZC) SPC
- 6.4.13 Wacker Chemie AG
- 6.4.14 Xinte Energy Co. Ltd
7 Market Opportunities and Future Outlook
- 7.1 White-Space and Unmet-Need Assessment
 多晶矽市場:2026-2032年全球市場預測(依產品、等級、製造流程、形態和應用分類)
 多晶矽市場規模、佔有率、趨勢和預測:按製造技術、形態、應用和地區分類,2026-2034年
 2026年全球多晶矽市場報告
 多晶市場-全球產業規模、佔有率、趨勢、機會與預測:按應用、地區和競爭格局分類,2021-2031年
 多晶矽市場規模、佔有率和趨勢分析報告:按應用、地區和細分市場預測(2026-2033 年)
 多晶矽市場規模、佔有率及成長分析(按應用、製造技術及地區分類)-2026-2033年產業預測
 全球多晶矽市場規模(依生產方法、應用、最終用戶、區域範圍和預測)