


 |
市場調查報告書
商品編碼
1910691
液化石油氣(LPG):市佔率分析、產業趨勢與統計、成長預測(2026-2031)Liquefied Petroleum Gas (LPG) - Market Share Analysis, Industry Trends & Statistics, Growth Forecasts (2026 - 2031) |
||||||
※ 本網頁內容可能與最新版本有所差異。詳細情況請與我們聯繫。
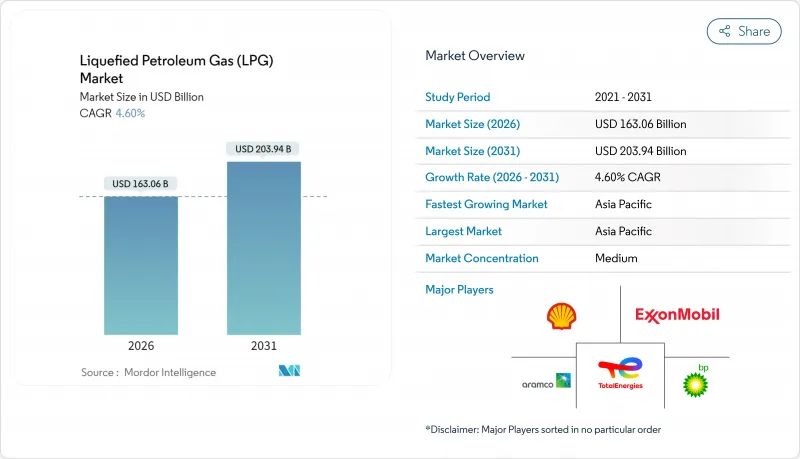
2025年液化石油氣市場價值為1,558.9億美元,預計到2031年將達到2,039.4億美元,而2026年為1,630.6億美元。
預計在預測期(2026-2031 年)內,複合年成長率將達到 4.60%。
亞洲石化原料的成長、印度和印尼大規模農村烹飪計畫的發展,以及IMO-2020法規收緊後對高硫燃料替代品的持續需求,支撐了需求的韌性。隨著卡達和阿拉伯聯合大公國提高產量,以及北美生產商最大限度地提高頁岩氣產量,供應多樣性正在擴大,但出口瓶頸導致價格頻繁波動。生物液化石油氣在歐盟脫碳法規的推動下發展勢頭強勁,印度、美國和西非的管道投資旨在降低物流成本和安全風險。因此,市場參與企業善於掌握一系列平衡的機會:穩定的家庭消費、不斷成長的石化產品需求以及重視低碳分子的監管變化。
全球液化石油氣(LPG)市場趨勢與洞察
液化石油氣爐灶計劃擴大了無污染燃料的取得途徑
印尼將5,000萬戶家庭從煤油轉換為液化石油氣,展現了快速擴充性,並為其他開發中國家樹立了典範。印度的「總理烏賈瓦拉計畫」(Pradhan Mantri Ujjawala Yojana)旨在2024年新增750萬個液化石油氣鋼瓶連接,即便補貼合理化仍在繼續,進口量仍將增加24%。西非各國政府目前正與世界銀行的全球液化石油氣夥伴夥伴關係(Global LPG Partnership)合作,複製這些發展模式。喀麥隆的目標是到2030年將其液化石油氣普及率從12%提高到58%。鑑於農村電力供應持續不足,液化石油氣與電爐灶相比仍然具有競爭力,尤其是在電網不穩定的地區。因此,持續的補貼目標明確化和末端配送創新是維持家庭普及的關鍵。
亞洲對石化原料需求的激增正在重塑貿易流量。
到2024年,中國的丙烷脫氫裝置產能將達到每年2,260萬噸,有助於穩定海運進口,儘管經濟週期放緩。隨後,印度投資80億美元在巴迪納爾建造了一座年產150萬噸的乙烷裂解裝置,確保了國內原料供應,並降低了對海外供應的依賴。隨著關稅下調改善套利經濟效益,預計2025年美國對華乙烷出口將進一步成長9%至34%。里昂巴塞爾煉油裝置關閉後,丙烯供需緊張,推動美國聚合級丙烯價格超過每磅0.40美元。亞洲總投資超過160億美元的管道和儲存基礎設施預計將透過吸收區域需求波動,在支撐液化石油氣市場長期成長方面發揮關鍵作用。
美國出口限制導致價格波動
2024年,美國沿岸地區的碼頭運轉率接近100%,蒙特貝爾維尤港的運費溢價一度上漲至每加侖32.5美分,但隨著過剩丙烷流入倉儲設施,溢價隨後回落。 Enterprise公司在休士頓的日產能30萬桶擴建工程要到2026年底才能建成,而ONEOK-MPLX公司在德克薩斯城的日產能40萬桶計劃則要到2028年才能完工,這暫時造成了供給能力短缺。在美國日產量213萬桶的丙烷中,70%用於出口,套利機會的消失可能導致庫存迅速增加和價格波動。中國作為最大的買家,加劇了地緣政治風險。新一輪的關稅爭端可能迫使亞洲進口商轉向價格更高的中東貨物。波動性加劇,促使紙面避險工具的使用量增加,2024 年乙烷-丙烷衍生交易量激增 43% 便證明了這一點。
細分市場分析
受北美頁岩氣和聯產氣計劃帶來的低邊際成本推動,液態天然氣(NGL)預計在2025年將佔據液化石油氣(LPG)市場60.45%的佔有率。卡達北部氣田的擴建將使該國的LPG產量從2024年的1,070萬噸增加到2030年的1,760萬噸。同時,阿布達比國家石油公司(ADNOC)天然氣公司的三個項目將在同一時期新增250萬噸產量,從而增強區域供應安全。由於印度和中國的煉油廠轉向石化產品並減少燃料調和組分的運轉率,煉廠衍生的LPG面臨壓力。雖然生物LPG市場規模仍然小規模,但隨著歐盟法規和政府獎勵釋放新的產能,預計到2025年,其複合年成長率將達到14.58%。此細分市場具有即插即用的優勢,且生命週期排放最多可減少90%,這使得供應商能夠在企業淨零排放採購合約中獲得溢價。然而,原料供應不足以及可再生柴油的競爭限制了近期擴張,而傳統液化石油氣的過剩,尤其是在北美,降低了綠色溢價。
不同地區的採用路徑各不相同。歐洲主要採用以廢棄食用油和廢棄物為原料的加氫處理植物油(HVO)工藝,而美國則傾向於利用現有可再生柴油工廠的加氫處理乙醇(HEFA)工藝。生物液化石油氣(Bio-LPG)在亞洲的應用仍處於起步階段,但隨著日本和韓國宣布整合產品流的航空脫碳策略,其應用可能會加速。液化石油氣(LPG)市場佔有率正向可再生分子轉移,預計在預測期內將持續成長。然而,至少到2030年,化石燃料衍生的液態天然氣(NGL)仍將維持主導地位。這種雙重供應體系將促使現有企業透過投資頁岩氣相關擴建計畫和新興生物精煉來規避風險。
本報告按生產來源(煉油廠衍生液化石油氣、液態天然氣、生物液化石油氣/可再生丙烷)、分銷管道(瓶裝氣、管道/虛擬管道、散裝供應/零售散裝供應)、應用(住宅/商業烹飪/供暖、石化原料、汽車燃料/汽車燃氣等)和地區(北美、歐洲、亞太地區等)進行細分。
區域分析
預計到2025年,亞太地區將佔全球收入的43.60%,並在2031年之前保持5.38%的複合年成長率,這主要得益於石化產品需求抵消了都市區感應改造帶來的需求成長。中國2,260萬噸的丙烷脫氫裝置(PDH)產能將確保海運丙烷需求的持續成長,即使國內經濟成長放緩。印度的進口量在2024年激增24%,但隨著補貼的減少,預計成長將放緩。然而,烹飪用燃氣在該國的農村燃氣擴建計劃中仍然佔據重要地位。印尼計劃在2050年將液化石油氣(LPG)的使用量減少31%,這帶來了一定的阻力,但東南亞工業和旅遊業的擴張支撐了整體需求。日本和韓國保持穩定的工業需求,而越南和菲律賓則在人口成長和強勁的建築業的推動下,正在崛起為新的成長中心。
北美擁有日產213萬桶的丙烷生產基地,儘管港口堵塞,但仍出口超過70%的產量。 Keyera斥資51.5億美元收購加拿大Plains NGL資產,將整合其儲存和分餾能力,增強對太平洋盆地的供應冗餘。墨西哥繼續受益於跨境管道連接,以彌補國內供應缺口,而專業經銷商正在擴展虛擬管道,為尚未覆蓋的中部高原城市提供服務。
歐洲亟需實現供應鏈多元化,擺脫對俄羅斯的依賴。由於高度依賴波蘭,貿易商不得不以高昂的運費美國和中東購買丙烷。英國斥資6億英鎊推出的可再生丙烷計畫表明了其戰略對沖意圖,而OMV Petrom對巴西石油公司的投資則在東南歐建立了首個大型永續空氣燃料生物液化石油氣(SAF-bio-LPG)樞紐。中東生產商(主要是卡達和阿拉伯聯合大公國)到2030年將新增940萬噸產能,從而能夠對亞洲市場提供更具競爭力的供應,並削弱美國在該路線上的佔有率。儘管撒哈拉以南非洲地區持續面臨供不應求,但位於南非、耗資10億蘭特的理查茲灣倉儲設施已投入運作,有助於提升該地區的供應穩定性。拉丁美洲的成長受到氣瓶安全事故的阻礙,但哥倫比亞和秘魯正在對其管道進行現代化改造,以提高可靠性並降低終端用戶成本。
其他福利:
- Excel格式的市場預測(ME)表
- 分析師支持(3個月)
目錄
第1章 引言
- 研究假設和市場定義
- 調查範圍
第2章調查方法
第3章執行摘要
第4章 市場情勢
- 市場概覽
- 市場促進因素
- 向液化石油氣兼容型混合式爐灶過渡計劃(印度、印尼)
- 新興亞洲地區對石化原料的需求快速成長
- 加速煉油廠升級改造,以生產符合IMO-2020標準的燃料
- 農村電氣化進程的延誤支撐了對燃氣鋼瓶的需求(非洲)
- 補貼改革鼓勵商業部門採用(中東)
- 在北美和歐盟脫碳計畫中擴大可再生丙烷的使用規模
- 市場限制
- 與美國頁岩氣出口套利相關的價格波動
- 加速中國和歐盟都市區電磁爐的普及
- 更嚴格的甲烷濃度標準有利於管道天然氣而非液化石油氣。
- 氣瓶物流安全事故損害民眾信任(拉丁美洲)
- 供應鏈分析
- 監管環境
- 技術展望
- 波特五力模型
- 供應商的議價能力
- 消費者議價能力
- 新進入者的威脅
- 替代產品和服務的威脅
- 競爭對手之間的競爭
第5章 市場規模與成長預測
- 按生產來源
- 煉油廠的液化石油氣
- 液態天然氣(聯產氣,NGL)
- 生物液化石油氣/可再生丙烷
- 透過分銷管道
- 鋼瓶(包裝)氣體
- 散裝供應和零售散裝供應
- 管道和虛擬管道
- 透過使用
- 住宅和商用烹飪/供暖
- 工業和商業流程
- 汽車燃料/汽車燃氣
- 石油化學原料
- 農業及其他
- 按地區
- 北美洲
- 美國
- 加拿大
- 墨西哥
- 歐洲
- 德國
- 英國
- 法國
- 義大利
- 俄羅斯
- 其他歐洲
- 亞太地區
- 中國
- 印度
- 日本
- 韓國
- 東南亞國協
- 亞太其他地區
- 南美洲
- 巴西
- 阿根廷
- 南美洲其他地區
- 中東和非洲
- 沙烏地阿拉伯
- 阿拉伯聯合大公國
- 南非
- 埃及
- 其他中東和非洲地區
- 北美洲
第6章 競爭情勢
- 市場集中度
- 策略性舉措(併購、夥伴關係、購電協議)
- 市場佔有率分析(主要企業的市場排名和佔有率)
- 公司簡介
- BP plc
- Exxon Mobil Corporation
- Shell plc
- TotalEnergies SE
- Chevron Corporation
- ConocoPhillips
- Abu Dhabi National Oil Company(ADNOC)
- QatarEnergy
- Gazprom PJSC
- Novatek PAO
- China Petroleum & Chemical Corporation(Sinopec)
- China National Petroleum Corporation(CNPC)
- Indian Oil Corporation Ltd
- Reliance Industries Ltd(Reliance Gas)
- SHV Energy BV
- UGI Corp/AmeriGas
- Ferrellgas Partners LP
- Petronas
- PTT Public Company Ltd
- KazMunayGas
第7章 市場機會與未來展望
The Liquefied Petroleum Gas Market was valued at USD 155.89 billion in 2025 and estimated to grow from USD 163.06 billion in 2026 to reach USD 203.94 billion by 2031, at a CAGR of 4.60% during the forecast period (2026-2031).
Demand resilience is anchored by Asian petrochemical feedstock growth, large-scale rural cooking programs in India and Indonesia, and continuing substitution of high-sulfur fuels after IMO-2020 upgrades. Supply diversity widens as Qatar and the UAE lift output while North American producers maximize shale-derived volumes, yet export bottlenecks keep price swings frequent. Bio-LPG gains momentum under EU decarbonization rules, and pipeline investments in India, the United States, and West Africa seek to trim logistics costs and safety risks. Market participants, therefore, juggle a balanced opportunity set: stable household consumption, expanding petrochemical pull, and regulatory shifts that reward lower-carbon molecules.
Global Liquefied Petroleum Gas (LPG) Market Trends and Insights
LPG-ready cook-stove programmes expand clean fuel access
Indonesia's conversion of 50 million households from kerosene to LPG demonstrates rapid scalability and has become a reference model for other developing nations. India's Pradhan Mantri Ujjwala Yojana added 7.5 million new cylinder connections in 2024, driving a 24% import surge despite ongoing subsidy rationalization. West African governments now partner with the World Bank's Global LPG Partnership to replicate these roll-outs, aiming to lift Cameroon's penetration from 12% to 58% by 2030. Persistent rural electrification gaps leave LPG competitively positioned versus electric cooking, particularly where grid reliability remains low. Therefore, continued subsidy targeting and last-mile distribution innovation are central to sustaining household uptake.
Petrochemical feedstock demand boom reshapes Asian trade flows
China's propane dehydrogenation capacity climbed to 22.6 million t/y in 2024 and underpins steady seaborne imports despite cyclical economic slowdowns. India followed by committing USD 8 billion to a 1.5 million t/y ethane cracker at Vadinar that secures domestic feedstock and curbs foreign dependency. US ethane exports to China are projected to rise another 9-34% in 2025 as lower tariffs improve arbitrage economics. Tightening propylene balances have driven US polymer-grade prices beyond USD 0.40 per pound after LyondellBasell shuttered refinery units. In aggregate, more than USD 16 billion of Asian pipeline and storage infrastructure is set to anchor long-run liquefied petroleum gas market growth by absorbing regional demand volatility.
Price volatility driven by US export constraints
Gulf Coast terminal utilization hovered near 100% in 2024, sending Mont Belvieu cargo premiums to 32.5 c/gal before retreating when surplus propane hit storage. Enterprise's 300,000 b/d Houston expansion will not materialize until late 2026, while the 400,000 b/d ONEOK-MPLX Texas City project arrives only in 2028, leaving an interim capacity crunch. With the United States exporting 70% of its 2.13 million b/d propane output, any arbitrage closure triggers rapid inventory builds and price instability. China's position as the largest buyer magnifies geopolitical risk: a renewed tariff dispute could force Asian importers toward higher-priced Middle Eastern cargos. Volatility encourages heavier use of paper hedging, evidenced by a 43% surge in ethane and propane derivative trading volumes during 2024.
Other drivers and restraints analyzed in the detailed report include:
- Refinery upgrades for IMO-2020 multiply LPG supply points
- Renewable propane scale-up introduces low-carbon competition
- Induction cooking erodes urban LPG demand pockets
For complete list of drivers and restraints, kindly check the Table Of Contents.
Segment Analysis
Natural-gas liquids secured a 60.45% share of the liquefied petroleum gas market in 2025, buoyed by North American shale and Middle Eastern associated-gas projects that keep marginal costs low. Qatar's North Field build-out will elevate national LPG output from 10.7 million t in 2024 to 17.6 million t by 2030, while three ADNOC Gas programs add 2.5 million t over the same horizon, strengthening regional supply security. Refinery-derived LPG has come under pressure as Indian and Chinese refiners pivot toward petrochemicals, trimming run rates for fuels blending streams. Although still modest, the liquefied petroleum gas market size for bio-LPG is anticipated to expand at a 14.58% CAGR when measured from its 2025 baseline as EU mandates and state incentives unlock new production capacity. The segment benefits from drop-in compatibility and up to 90% lifecycle emissions cuts, enabling suppliers to layer premium pricing on corporate net-zero procurement contracts. Nonetheless, feedstock availability and competition with renewable diesel limit near-term scaling, particularly in North America, where conventional LPG oversupply narrows green premiums.
Adoption pathways differ across regions. Europe leans on used cooking oil and waste-based HVO routes, while the United States favors HEFA processes piggybacking on existing renewable diesel plants. Asia's bio-LPG roll-out remains nascent but could accelerate as Japan and South Korea unveil aviation decarbonization strategies that integrate co-product streams. The liquefied petroleum gas market share tilts toward renewable molecules, therefore deepens over the outlook, though absolute volumes remain led by fossil NGLs until at least 2030. This dual-track supply system encourages incumbents to hedge by investing in shale-linked expansions and emerging biorefineries.
The Liquefied Petroleum Gas (LPG) Market Report is Segmented by Source of Production (Refinery-Derived LPG, Natural Gas Liquids, and Bio-LPG/Renewable Propane), Distribution Channel (Cylinder Gas, Pipeline and Virtual Pipeline, and Bulk and Retail Bulk Supply), Application (Residential and Commercial Cooking/Heating, Petrochemical Feedstock, Autofuel/Autogas, and More), and Geography (North America, Europe, Asia-Pacific, and More).
Geography Analysis
Asia-Pacific held 43.60% of global revenue in 2025 and is expected to maintain a 5.38% CAGR to 2031 as petrochemical demand offsets urban induction conversions. China's 22.6 million-t PDH capacity ensures sustained seaborne propane pull, even with domestic economic moderation. India's 24% import surge in 2024 will taper as subsidies tighten, yet cooking gas remains critical for rural inclusion programs. Indonesia's roadmap to cut LPG usage 31% by 2050 introduces headwinds, though Southeast Asian industrial and tourism expansions cushion overall volumes. Japan and South Korea keep steady industrial baseloads, whereas Vietnam and the Philippines are emerging bright spots thanks to population growth and robust construction sectors.
North America leverages a 2.13 million b/d propane production platform, exporting more than 70% of output despite dock congestion. Canada's Keyera acquisition of Plains NGL assets for USD 5.15 billion integrates storage and fractionation, enhancing supply redundancy into Pacific basins. Mexico continues to benefit from cross-border pipeline connections that backstop domestic shortfalls, while specialty distributors expand virtual pipelines into underserved central plateau cities.
Europe grapples with post-Russian supply diversification: Poland's dependence has pushed traders toward US and Middle Eastern cargos at premium freight rates. The United Kingdom's GBP 600 million renewable propane drive signals strategic hedging, and OMV Petrom's Petrobrazi investment cements Southeast Europe's first major SAF-bio-LPG hub. Middle Eastern producers, chiefly Qatar and the UAE, add 9.4 million t of new capacity by 2030, enabling competitive offers into Asia and eroding US share in that corridor. Sub-Saharan Africa remains under-supplied; South Africa's R1 billion Richards Bay storage came online to stabilize regional availability. Latin America's growth is curtailed by cylinder safety incidents, but Colombia and Peru eye pipeline modernization to enhance reliability and lower end-user costs.
- BP plc
- Exxon Mobil Corporation
- Shell plc
- TotalEnergies SE
- Chevron Corporation
- ConocoPhillips
- Abu Dhabi National Oil Company (ADNOC)
- QatarEnergy
- Gazprom PJSC
- Novatek PAO
- China Petroleum & Chemical Corporation (Sinopec)
- China National Petroleum Corporation (CNPC)
- Indian Oil Corporation Ltd
- Reliance Industries Ltd (Reliance Gas)
- SHV Energy B.V.
- UGI Corp / AmeriGas
- Ferrellgas Partners LP
- Petronas
- PTT Public Company Ltd
- KazMunayGas
Additional Benefits:
- The market estimate (ME) sheet in Excel format
- 3 months of analyst support
TABLE OF CONTENTS
1 Introduction
- 1.1 Study Assumptions & Market Definition
- 1.2 Scope of the Study
2 Research Methodology
3 Executive Summary
4 Market Landscape
- 4.1 Market Overview
- 4.2 Market Drivers
- 4.2.1 Shift toward LPG-ready hybrid cook-stove programmes (India, Indonesia)
- 4.2.2 Petrochemical feedstock demand boom in emerging Asia
- 4.2.3 Accelerating refinery upgrades for IMO-2020 compliant fuels
- 4.2.4 Rural household electrification lag sustaining cylinder demand (Africa)
- 4.2.5 Subsidy reforms boosting commercial sector uptake (Middle East)
- 4.2.6 Renewable-propane scale-up in North America & EU decarbonization agendas
- 4.3 Market Restraints
- 4.3.1 Price volatility linked to US shale export arbitrage
- 4.3.2 Accelerating induction cooking penetration in urban China & EU
- 4.3.3 Stricter methane-intensity rules favoring piped natural gas over LPG
- 4.3.4 Cylinder logistics safety incidents undermining public perception (LATAM)
- 4.4 Supply-Chain Analysis
- 4.5 Regulatory Landscape
- 4.6 Technological Outlook
- 4.7 Porter's Five Forces
- 4.7.1 Bargaining Power of Suppliers
- 4.7.2 Bargaining Power of Consumers
- 4.7.3 Threat of New Entrants
- 4.7.4 Threat of Substitute Products & Services
- 4.7.5 Intensity of Competitive Rivalry
5 Market Size & Growth Forecasts
- 5.1 By Source of Production
- 5.1.1 Refinery-derived LPG
- 5.1.2 Natural Gas Liquids (Associated Gas, NGLs)
- 5.1.3 Bio-LPG/Renewable Propane
- 5.2 By Distribution Channel
- 5.2.1 Cylinder (Packaged) Gas
- 5.2.2 Bulk and Retail Bulk Supply
- 5.2.3 Pipeline and Virtual Pipeline
- 5.3 By Application
- 5.3.1 Residential and Commercial Cooking/Heating
- 5.3.2 Industrial and Commercial Processing
- 5.3.3 Autofuel/Autogas
- 5.3.4 Petrochemical Feedstock
- 5.3.5 Agriculture and Others
- 5.4 By Geography
- 5.4.1 North America
- 5.4.1.1 United States
- 5.4.1.2 Canada
- 5.4.1.3 Mexico
- 5.4.2 Europe
- 5.4.2.1 Germany
- 5.4.2.2 United Kingdom
- 5.4.2.3 France
- 5.4.2.4 Italy
- 5.4.2.5 Russia
- 5.4.2.6 Rest of Europe
- 5.4.3 Asia-Pacific
- 5.4.3.1 China
- 5.4.3.2 India
- 5.4.3.3 Japan
- 5.4.3.4 South Korea
- 5.4.3.5 ASEAN Countries
- 5.4.3.6 Rest of Asia-Pacific
- 5.4.4 South America
- 5.4.4.1 Brazil
- 5.4.4.2 Argentina
- 5.4.4.3 Rest of South America
- 5.4.5 Middle East and Africa
- 5.4.5.1 Saudi Arabia
- 5.4.5.2 United Arab Emirates
- 5.4.5.3 South Africa
- 5.4.5.4 Egypt
- 5.4.5.5 Rest of Middle East and Africa
- 5.4.1 North America
6 Competitive Landscape
- 6.1 Market Concentration
- 6.2 Strategic Moves (M&A, Partnerships, PPAs)
- 6.3 Market Share Analysis (Market Rank/Share for key companies)
- 6.4 Company Profiles (includes Global level Overview, Market level overview, Core Segments, Financials as available, Strategic Information, Products & Services, and Recent Developments)
- 6.4.1 BP plc
- 6.4.2 Exxon Mobil Corporation
- 6.4.3 Shell plc
- 6.4.4 TotalEnergies SE
- 6.4.5 Chevron Corporation
- 6.4.6 ConocoPhillips
- 6.4.7 Abu Dhabi National Oil Company (ADNOC)
- 6.4.8 QatarEnergy
- 6.4.9 Gazprom PJSC
- 6.4.10 Novatek PAO
- 6.4.11 China Petroleum & Chemical Corporation (Sinopec)
- 6.4.12 China National Petroleum Corporation (CNPC)
- 6.4.13 Indian Oil Corporation Ltd
- 6.4.14 Reliance Industries Ltd (Reliance Gas)
- 6.4.15 SHV Energy B.V.
- 6.4.16 UGI Corp / AmeriGas
- 6.4.17 Ferrellgas Partners LP
- 6.4.18 Petronas
- 6.4.19 PTT Public Company Ltd
- 6.4.20 KazMunayGas
7 Market Opportunities & Future Outlook
- 7.1 White-space & Unmet-Need Assessment
 汽車燃氣市場-全球產業規模、佔有率、趨勢、機會、預測:按類型、應用、地區和競爭格局分類,2021-2031年
 汽車燃氣市場:依技術、改裝類型、通路、氣瓶容量、車輛類型和最終用戶分類-2026-2032年全球市場預測
 汽車瓦斯市場報告:按類型、車輛類型和地區分類(2026-2034 年)液化石油氣汽化器市場報告:按產品、產能、應用和地區分類(2026-2034 年)液化石油氣(LPG)市場報告:按來源、應用、供應形式和地區分類(2026-2034 年)
 液化石油氣(LPG)市場規模、佔有率、成長率及全球產業分析:按類型、應用和地區分類,並預測至2026-2034年全球液化石油氣汽化器市場規模、佔有率、趨勢和成長分析報告(2026-2034年)全球液化石油氣(LPG)市場規模、佔有率、趨勢和成長分析報告(2026-2034年)
 2026年全球液化石油氣蒸發器市場報告液化石油氣蒸發器市場 - 全球產業規模、佔有率、趨勢、機會及預測(按產品類型、產能、最終用途、地區和競爭格局分類,2021-2031年)