


 |
市場調查報告書
商品編碼
1910612
工業電腦斷層掃描(CT)-市場佔有率分析、產業趨勢與統計、成長預測(2026-2031)Industrial Computed Tomography - Market Share Analysis, Industry Trends & Statistics, Growth Forecasts (2026 - 2031) |
||||||
※ 本網頁內容可能與最新版本有所差異。詳細情況請與我們聯繫。
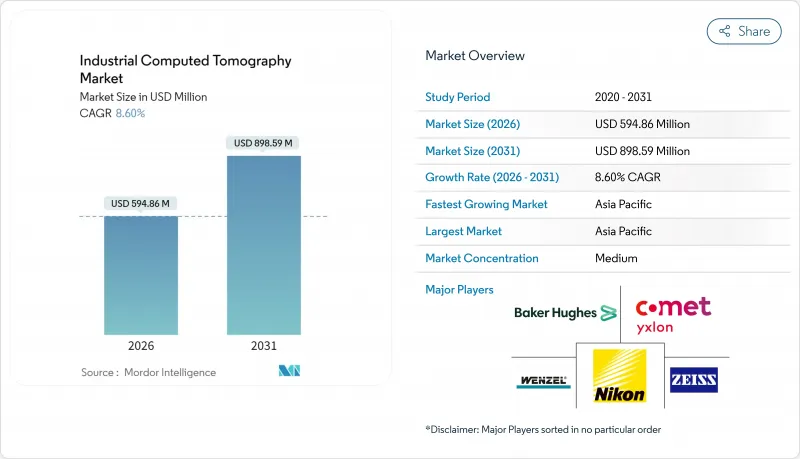
2025 年工業電腦斷層掃描 (CT) 市值為 5.4775 億美元,預計到 2031 年將達到 8.9859 億美元,高於 2026 年的 5.9486 億美元。
預計在預測期(2026-2031 年)內,複合年成長率將達到 8.60%。
這種強勁的成長反映了CT技術從一種小眾偵測工具轉向航太、汽車、電子和積層製造等行業主流品質保證平台的轉變。推動需求成長的因素包括:電動車供應鏈中日益嚴格的電池安全法規、積層製造技術的普及(需要體積檢驗)、基於人工智慧的自動化缺陷識別(可縮短週期時間)以及微型化電子產品對亞微米解析度檢測的需求。系統供應商也受益於更快的檢測器技術、可在單次掃描中分離材料的雙能源來源以及硬體價格的下降,這些因素使得小型製造商也能採用該技術。高昂的初始投資成本和全球訓練有素的CT操作員短缺限制了CT技術的普及,但租賃和X光即服務等資金籌措模式正在擴大基本客群。目前,亞太地區在收入方面主導,其中中國、日本和韓國的成長速度最快,這得益於它們在電子和精密製造生產線中部署CT技術。
全球工業電腦斷層掃描(CT)市場趨勢與洞察
航太和汽車產業對無損檢測的需求日益成長
民航機計畫正在利用CT技術檢驗複合材料機翼和3D列印支架,將檢測方法從輔助檢測轉變為首件檢驗和生產的關鍵環節。汽車製造商正在將CT技術的應用範圍從引擎缸體鑄件檢測擴展到電池組檢驗,後者需要精確的內部幾何圖形來進行熱傳播分析。該技術能夠檢測碳纖維增強部件中亞毫米級的孔隙,有助於在滿足AS9100和ISO/TS 16949品質標準的同時,實現輕量化目標。
擴大積層製造品管的應用
通用電氣LEAP引擎燃油噴嘴的生產檢測案例表明,工業CT是3D列印金屬零件逐層缺陷檢測的參考工具。即時重建和自動缺陷分類將掃描到決策的時間從8小時縮短至2小時,使CT技術能夠應用於大規模積層製造生產線。 ISO/ASTM 52900標準納入了CT驗收標準,使其成為一項合規性要求,而非可選檢查。
高功率CT系統的購置與營運成本高
一台解析度低於10微米的儀器造價在150萬美元到300萬美元之間,其中包括屏蔽、安全系統和設備維修。每年更換的電子管和100千瓦的電力消耗會增加運作成本。租賃協議可以分期付款,但會增加總擁有成本並限制日程安排的柔軟性。
細分市場分析
到2025年,高壓設備(300kV以上)將佔據工業CT市場62.15%的佔有率,這主要得益於對深度滲透性的需求,例如航太鋼鑄件和厚壁鋁製部件。中低壓設備所佔佔有率較小,但預計到2031年將以9.78%的複合年成長率成長,這主要得益於電子元件生產線中桌面系統的興起。 Lumafield售價低於10萬美元的桌上型掃描器透過降低經濟門檻,擴大了潛在市場。結構化陽極技術提高了散熱性能,使160kV和225kV的設備無需額外冷卻即可對聚合物和鋁進行成像。
高壓設備的擁有者為了獲得高密度元件的清晰圖像,將接受面積較大的設備以及相應的屏蔽措施;而專門從事電路基板和塑膠組裝分析的實驗室則會選擇低能耗設備,因為其體積小巧且運行成本更低。這種層級構造的趨勢將持續影響供應商的產品系列和資金籌措模式,直到2031年。
到2025年,缺陷檢測的需求將佔總需求的47.65%,這主要得益於其在鑄造和複合材料檢測中的重要角色。同時,隨著汽車製造商和電子產品製造商轉向以生產為基礎的計量方式,組裝分析預計將以10.05%的複合年成長率成長。電池組製造商在電池組密封前會繪製電芯位置和焊接位置的完整性圖,以預防事故。微電子生產線正在將CT體素與CAD數據進行比較,以產生晶粒堆疊裝置的自動化GD&T報告。
研究機構的故障分析部門雖然規模較小,但卻是重要的使用者群體,他們在現場發生故障時會應用CT進行故障排查和分析。新型藥物輸送裝置和醫療植入是另一個規模小規模但成長迅速的領域,它們也需要進行無損內部檢測。
區域分析
預計到2025年,亞太地區將佔全球收入的36.85%,並在2031年之前以11.76%的複合年成長率持續成長,這主要得益於中國電子和電動汽車供應鏈、日本精密汽車製造業以及韓國存儲器代工廠的強勁發展。中國的GB38031-2025電池法規正在推動本土電動車領先企業加大對電池組檢驗單元的CT投資。日本OEM廠商正在利用µ-CT技術確保混合動力平台中複合材料的組裝和表面光潔度,而韓國晶圓廠則利用micro-CT技術檢驗3D NAND快閃記憶體堆疊結構。
北美佔據了相當大的市場佔有率,波音和洛克希德·馬丁等航太巨頭需要對複合材料機翼和3D列印的Ti-6Al-4V支架進行高解析度檢測。美國也在人工智慧缺陷識別技術的應用方面處於領先地位,一些Start-Ups正在將基於雲端的分析整合到CT工作流程中。墨西哥的電動車電池生產線以及加拿大的民用和航太叢集也進一步推動了該地區的需求。
歐洲市場正穩步成長,德國汽車製造商正在驗證鋁製引擎外殼和晶粒電池機殼。歐盟電池法規2023/1542要求更廣泛的安全檢驗,通常會採用電腦斷層掃描來偵測內部短路。一家法國一級航太產業供應商正在複合複合材料風扇葉片上應用雙能CT技術,而英國創新署(Innovate 英國)正在資助一個公私合作實驗室,以改進用於積層製造零件的在線連續CT技術。
其他福利:
- Excel格式的市場預測(ME)表
- 3個月的分析師支持
目錄
第1章 引言
- 研究假設和市場定義
- 調查範圍
第2章調查方法
第3章執行摘要
第4章 市場情勢
- 市場概覽
- 市場促進因素
- 航太和汽車產業對無損檢測的需求日益成長
- 積層製造中品管的日益普及
- 檢測器解析度和影像重建技術的進步
- 隨著電子設備體積越來越小,微型CT檢測變得不可或缺。
- 人工智慧驅動的自動缺陷識別可縮短週期時間
- 電動車(EV)供應鏈電池安全法規
- 市場限制
- 高功率電流互感器系統的高安裝和運作成本
- 遵守輻射安全法規和設施維修的負擔
- 熟練的CT操作員和數據分析師短缺
- 與新興的兆赫和超音波技術的競爭
- 產業供應鏈分析
- 監管環境
- 技術展望
- 宏觀經濟因素的影響
- 波特五力分析
- 供應商的議價能力
- 買方的議價能力
- 新進入者的威脅
- 替代品的威脅
- 競爭對手之間的競爭
第5章 市場規模與成長預測
- 按電壓範圍
- 低壓和中壓(低於300千伏特)
- 高壓(300千伏以上)
- 透過使用
- 缺陷檢測/檢驗
- 故障分析
- 組裝分析
- 其他用途
- 透過技術/掃描技術
- 扇形束CT
- 錐狀射束CT
- 其他
- 按最終用戶行業分類
- 航太與國防
- 車
- 電子和半導體
- 醫療設備
- 學術研究機構
- 其他行業
- 按地區
- 北美洲
- 美國
- 加拿大
- 墨西哥
- 南美洲
- 巴西
- 阿根廷
- 南美洲其他地區
- 歐洲
- 德國
- 英國
- 法國
- 義大利
- 西班牙
- 俄羅斯
- 其他歐洲
- 亞太地區
- 中國
- 日本
- 印度
- 韓國
- 亞太其他地區
- 中東和非洲
- 中東
- 沙烏地阿拉伯
- 阿拉伯聯合大公國
- 土耳其
- 其他中東地區
- 非洲
- 南非
- 奈及利亞
- 其他非洲地區
- 中東
- 北美洲
第6章 競爭情勢
- 市場集中度
- 策略趨勢
- 市佔率分析
- 公司簡介
- Baker Hughes Company(Waygate Technologies)
- Carl Zeiss AG
- Nikon Corporation-Nikon Metrology NV
- Comet Group-Yxlon International GmbH
- Wenzel Group GmbH and Co. KG
- North Star Imaging Inc.
- Diondo GmbH
- Werth Messtechnik GmbH
- RX Solutions SAS
- VJ Technologies Inc.
- VisiConsult X-ray Systems and Solutions GmbH
- Rigaku Corporation
- Sanying Precision Instruments Co., Ltd.
- Aolong Radiative Instrument Group Co., Ltd.
- Seamark ZM Technology Co., Ltd.
- Royma Tech(Suzhou)Precision Co., Ltd.
- Shimadzu Corporation
- Hitachi High-Tech Corporation
- Thermo Fisher Scientific Inc.
- Lumafield Inc.
第7章 市場機會與未來展望
The industrial computed tomography market was valued at USD 547.75 million in 2025 and estimated to grow from USD 594.86 million in 2026 to reach USD 898.59 million by 2031, at a CAGR of 8.60% during the forecast period (2026-2031).
Robust expansion reflects the modality's transition from a niche inspection option to a mainstream quality-assurance platform in aerospace, automotive, electronics, and additive manufacturing workflows. Demand is driven by tighter battery-safety regulations for electric-vehicle supply chains, the surge of additive manufacturing that necessitates volumetric validation, AI-based automated defect recognition that reduces cycle time, and miniaturized electronics that require sub-micron resolution inspection. System vendors are also benefiting from faster detector technology, dual-energy sources that separate materials within a single scan, and declining hardware prices that make the modality accessible to smaller manufacturers. High initial capital costs and a global shortage of trained CT operators temper adoption; however, financing models such as leasing and X-as-a-service are broadening the customer base. The Asia-Pacific region leads in revenue today and exhibits the steepest growth curve, as China, Japan, and South Korea integrate CT into their electronics and precision manufacturing lines.
Global Industrial Computed Tomography Market Trends and Insights
Rising demand for non-destructive testing in aerospace and automotive
Commercial aircraft programs rely on CT to validate composite wings and 3D-printed brackets, converting the modality from supplementary inspection to a mandatory gate in first-article and serial production workflows. Automakers extend CT beyond engine-block casting checks to battery-pack validation, where thermal propagation analysis requires precise internal geometry mapping. The technology's ability to locate sub-millimeter voids in carbon-fiber-reinforced parts supports weight-reduction goals while meeting AS9100 and ISO/TS 16949 quality standards.
Growing adoption of additive manufacturing quality control
Industrial CT is the reference tool for layer-wise defect detection in 3D-printed metal parts, as demonstrated by GE's serial production inspection of LEAP engine fuel nozzles. Real-time reconstruction and automated defect classification cut scan-to-decision time from eight hours to two, making CT viable for higher-volume AM lines. ISO/ASTM 52900 standards incorporate CT acceptance criteria, making the modality a compliance requirement rather than an optional check.
High acquisition and operating cost of high-power CT systems
Installations capable of sub-10 µm resolution cost between USD 1.5 million and USD 3 million, once shielding, safety systems, and site upgrades are factored in. Annual tube replacement and 100 kW power consumption inflate running costs. Leasing spreads payments but raises the total cost of ownership and limits schedule flexibility.
Other drivers and restraints analyzed in the detailed report include:
- Advances in detector resolution and image reconstruction
- Miniaturization of electronics necessitating µ-CT inspection
- Radiation-safety compliance burden and facility upgrades
For complete list of drivers and restraints, kindly check the Table Of Contents.
Segment Analysis
High-voltage installations of>= 300 kV held a 62.15% industrial computed tomography market share in 2025, driven by the demand for aerospace steel castings and thick aluminum parts that require deep penetration. Low- to medium-voltage units account for a smaller slice but post a 9.78% CAGR to 2031 as desktop systems gain appeal in electronic lines. Lumafield's sub-USD 100,000 desktop scanners widen the addressable base by lowering the financial hurdle. Structured anode technology improves heat removal, allowing 160 kV and 225 kV units to image polymers and aluminum without adding a cooling burden.
High-voltage owners accept larger floor space and shielding needs in exchange for image clarity on dense parts, whereas labs focused on circuit boards and plastic assemblies choose lower-energy units for compactness and reduced operating costs. This two-tier dynamic shapes vendor portfolios and financing schemes through 2031.
Flaw detection retained 47.65% of the demand in 2025, thanks to its entrenched roles in casting and composite inspection. Assembly analysis, however, is forecast to climb at a 10.05% CAGR as automakers and electronics firms switch to volume-based metrology. Battery-pack builders map cell placement and weld alignment before sealing the pack to prevent thermal runaway events. Microelectronics lines compare CT voxels to CAD in automated GD&T reports for die-stack devices.
Failure-analysis groups at research institutes remain a niche but critical user set, applying CT to forensic teardown when field failures arise. New drug-delivery devices and medical implants form another small yet growing cluster seeking non-destructive interior confirmation.
The Industrial Computed Tomography Market Report is Segmented by Voltage Range (Low-Medium Voltage and High Voltage), Application (Flaw Detection/Inspection, Failure Analysis, and More), Technology/Scanning Technique (Fan-Beam CT, and More), End-User Industry (Aerospace and Defense, Automotive, and More), and Geography. The Market Forecasts are Provided in Terms of Value (USD).
Geography Analysis
Asia-Pacific generated 36.85% of 2025 revenue and is projected to compound at 11.76% CAGR through 2031 on the back of China's electronics and EV supply chain, Japan's precision car-making, and South Korea's memory fabs. China's GB38031-2025 battery rule prompts CT to invest in pack validation cells serving local EV leaders. Japanese OEMs utilize µ-CT to ensure composite fit and finish in hybrid platforms, while South Korean fabs rely on micro-CT to verify 3D NAND stacks.
North America posts a sizable share anchored by aerospace primes such as Boeing and Lockheed Martin, who demand high-resolution inspection for composite wings and 3D-printed Ti-6Al-4V brackets. The U.S. also leads the adoption of AI-assisted defect recognition, with startups integrating cloud-based analytics into CT workflows. Mexico's EV battery lines and Canada's civil and aerospace clusters further underpin regional demand.
Europe maintains steady growth as Germany's automakers verify aluminum engine housings and die-cast battery enclosures. The EU Battery Regulation 2023/1542 requires more extensive safety testing, often conducted via CT scans to detect internal shorts. France's aerospace tier-ones deploy dual-energy CT for composite fan blades, and the U.K.'s Innovate UK funding supports public-private labs refining in-line CT for additive manufacturing components.
- Baker Hughes Company (Waygate Technologies)
- Carl Zeiss AG
- Nikon Corporation - Nikon Metrology NV
- Comet Group - Yxlon International GmbH
- Wenzel Group GmbH and Co. KG
- North Star Imaging Inc.
- Diondo GmbH
- Werth Messtechnik GmbH
- RX Solutions SAS
- VJ Technologies Inc.
- VisiConsult X-ray Systems and Solutions GmbH
- Rigaku Corporation
- Sanying Precision Instruments Co., Ltd.
- Aolong Radiative Instrument Group Co., Ltd.
- Seamark ZM Technology Co., Ltd.
- Royma Tech (Suzhou) Precision Co., Ltd.
- Shimadzu Corporation
- Hitachi High-Tech Corporation
- Thermo Fisher Scientific Inc.
- Lumafield Inc.
Additional Benefits:
- The market estimate (ME) sheet in Excel format
- 3 months of analyst support
TABLE OF CONTENTS
1 INTRODUCTION
- 1.1 Study Assumptions and Market Definition
- 1.2 Scope of the Study
2 RESEARCH METHODOLOGY
3 EXECUTIVE SUMMARY
4 MARKET LANDSCAPE
- 4.1 Market Overview
- 4.2 Market Drivers
- 4.2.1 Rising demand for non-destructive testing in aerospace and automotive
- 4.2.2 Growing adoption of additive manufacturing quality control
- 4.2.3 Advances in detector resolution and image reconstruction
- 4.2.4 Miniaturisation of electronics necessitating µ-CT inspection
- 4.2.5 AI-driven automated defect recognition reducing cycle time
- 4.2.6 Battery-safety regulations for EV supply chains
- 4.3 Market Restraints
- 4.3.1 High acquisition and operating cost of high-power CT systems
- 4.3.2 Radiation-safety compliance burden and facility upgrades
- 4.3.3 Scarcity of skilled CT operators and data analysts
- 4.3.4 Competition from emerging terahertz and ultrasound modalities
- 4.4 Industry Supply Chain Analysis
- 4.5 Regulatory Landscape
- 4.6 Technological Outlook
- 4.7 Impact of Macroeconomic Factors
- 4.8 Porter's Five Forces Analysis
- 4.8.1 Bargaining Power of Suppliers
- 4.8.2 Bargaining Power of Buyers
- 4.8.3 Threat of New Entrants
- 4.8.4 Threat of Substitutes
- 4.8.5 Intensity of Competitive Rivalry
5 MARKET SIZE AND GROWTH FORECASTS (VALUE)
- 5.1 By Voltage Range
- 5.1.1 Low-Medium Voltage (Less than 300 kV)
- 5.1.2 High Voltage (Greater thann or Equal to 300 kV)
- 5.2 By Application
- 5.2.1 Flaw Detection / Inspection
- 5.2.2 Failure Analysis
- 5.2.3 Assembly Analysis
- 5.2.4 Other Applications
- 5.3 By Technology/Scanning Technique
- 5.3.1 Fan-Beam CT
- 5.3.2 Cone-Beam CT
- 5.3.3 Others
- 5.4 By End-user Industry
- 5.4.1 Aerospace and Defense
- 5.4.2 Automotive
- 5.4.3 Electronics and Semiconductors
- 5.4.4 Medical Devices
- 5.4.5 Academic and Research Institutes
- 5.4.6 Other Industries
- 5.5 By Geography
- 5.5.1 North America
- 5.5.1.1 United States
- 5.5.1.2 Canada
- 5.5.1.3 Mexico
- 5.5.2 South America
- 5.5.2.1 Brazil
- 5.5.2.2 Argentina
- 5.5.2.3 Rest of South America
- 5.5.3 Europe
- 5.5.3.1 Germany
- 5.5.3.2 United Kingdom
- 5.5.3.3 France
- 5.5.3.4 Italy
- 5.5.3.5 Spain
- 5.5.3.6 Russia
- 5.5.3.7 Rest of Europe
- 5.5.4 Asia-Pacific
- 5.5.4.1 China
- 5.5.4.2 Japan
- 5.5.4.3 India
- 5.5.4.4 South Korea
- 5.5.4.5 Rest of Asia-Pacific
- 5.5.5 Middle East and Africa
- 5.5.5.1 Middle East
- 5.5.5.1.1 Saudi Arabia
- 5.5.5.1.2 United Arab Emirates
- 5.5.5.1.3 Turkey
- 5.5.5.1.4 Rest of Middle East
- 5.5.5.2 Africa
- 5.5.5.2.1 South Africa
- 5.5.5.2.2 Nigeria
- 5.5.5.2.3 Rest of Africa
- 5.5.5.1 Middle East
- 5.5.1 North America
6 COMPETITIVE LANDSCAPE
- 6.1 Market Concentration
- 6.2 Strategic Moves
- 6.3 Market Share Analysis
- 6.4 Company Profiles (includes Global level Overview, Market level overview, Core Segments, Financials, Strategic Information, Market Rank/Share, Products and Services, Recent Developments)
- 6.4.1 Baker Hughes Company (Waygate Technologies)
- 6.4.2 Carl Zeiss AG
- 6.4.3 Nikon Corporation - Nikon Metrology NV
- 6.4.4 Comet Group - Yxlon International GmbH
- 6.4.5 Wenzel Group GmbH and Co. KG
- 6.4.6 North Star Imaging Inc.
- 6.4.7 Diondo GmbH
- 6.4.8 Werth Messtechnik GmbH
- 6.4.9 RX Solutions SAS
- 6.4.10 VJ Technologies Inc.
- 6.4.11 VisiConsult X-ray Systems and Solutions GmbH
- 6.4.12 Rigaku Corporation
- 6.4.13 Sanying Precision Instruments Co., Ltd.
- 6.4.14 Aolong Radiative Instrument Group Co., Ltd.
- 6.4.15 Seamark ZM Technology Co., Ltd.
- 6.4.16 Royma Tech (Suzhou) Precision Co., Ltd.
- 6.4.17 Shimadzu Corporation
- 6.4.18 Hitachi High-Tech Corporation
- 6.4.19 Thermo Fisher Scientific Inc.
- 6.4.20 Lumafield Inc.
7 MARKET OPPORTUNITIES AND FUTURE OUTLOOK
- 7.1 White-space and Unmet-need Assessment
 工業電腦斷層掃描(CT)市場-2026-2032年全球市場預測
 工業電腦斷層掃描(CT)市場規模、佔有率、趨勢和預測:按產品、應用、最終用戶行業和地區分類,2026-2034年台式X光電腦斷層掃描系統市場:按組件、系統配置、技術、應用和分銷管道分類-2026年至2032年全球預測汽車工業CT掃描市場:按設備類型、服務、解析度、應用和最終用途分類-2026-2032年全球市場預測工業電腦斷層掃描和X光成像市場:按產品、組件、服務、技術、應用和最終用戶產業分類,全球預測,2026-2032年
 工業電腦斷層掃描(CT)全球市場規模、佔有率、趨勢和成長分析報告(2026-2034)
 工業電腦斷層掃描市場-全球產業規模、佔有率、趨勢、機會與預測:產品、類型、掃描技術、應用、垂直產業、地區和競爭格局(2021-2031)工業電腦斷層掃描和檢測服務市場(按服務類型、成像技術、建築材料、產業細分、應用和部署模式分類),全球預測(2026-2032年)
 2025-2029年全球工業電腦斷層掃描市場
 亞太地區工業電腦斷層掃描 (CT):市場佔有率分析、產業趨勢與統計、成長預測(2025-2030 年)