


 |
市場調查報告書
商品編碼
1910598
快速消費品物流:市場佔有率分析、產業趨勢與統計、成長預測(2026-2031)FMCG Logistics - Market Share Analysis, Industry Trends & Statistics, Growth Forecasts (2026 - 2031) |
||||||
※ 本網頁內容可能與最新版本有所差異。詳細情況請與我們聯繫。
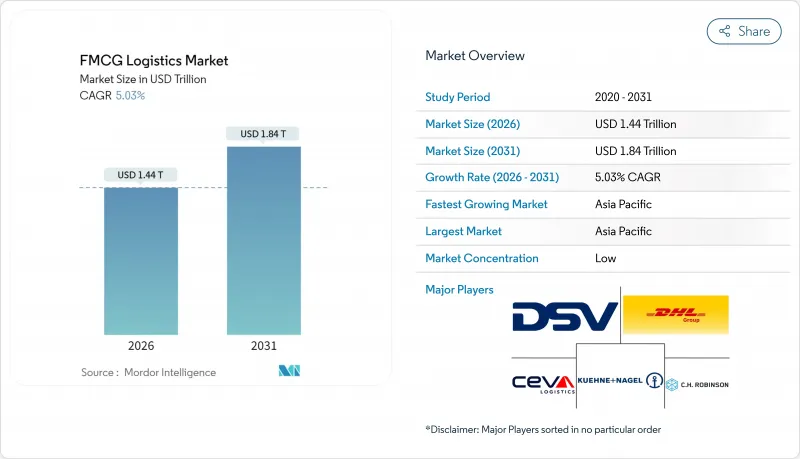
預計消費品物流市場規模將從 2025 年的 1.37 兆美元成長到 2026 年的 1.44 兆美元,到 2031 年將達到 1.84 兆美元,2026 年至 2031 年的複合年成長率為 5.03%。
電子商務的蓬勃發展、快速的都市化進程以及不斷壯大的中產階級消費者正在改變分銷模式,企業正朝著以技術為驅動、以永續性發展為核心的價值鏈轉型,以實現端到端的可視性和更快的履約速度。儘管運輸服務仍然是價值創造的主導力量,但隨著品牌尋求更貼近需求的客製化服務,聯合包裝和貼標等附加價值服務正日益受到重視。不斷擴展的低溫運輸正在推動冷凍食品和醫療保健產業的成長,而數位化視覺性平台則支援預測性決策,從而減少廢棄物和缺貨。日益激烈的競爭和近期的大型併購案正在推動規模經濟的實現,而專注於區域市場的公司則憑藉其本地化的「最後一公里」配送能力,在快速消費品物流市場保持著優勢。
全球快速消費品物流市場趨勢與洞察
電子商務加速發展及對最後一公里配送的期望
線上銷售的快速成長正在縮短配送時間並改變訂單模式,迫使快速消費品物流市場轉向微型倉配和都市區的當日達服務。在巴西,2024年上半年快速消費品線上銷售額成長了13.6%,其中健康美容產品成長了17.8%,食品成長了26.2%。隨著消費者對精準性和永續性的期望不斷提高,物流供應商正在部署前置物流中心、電動貨車和即時追蹤系統。對路線最佳化平台和逆向物流能力的投資也源源不斷,以幫助平衡不斷成長的B2B補貨量和持續成長的直銷需求。這些變化為依賴合作夥伴提供末端配送服務的輕資產品牌帶來了競爭挑戰。
第三方物流/合約物流在快速消費品產業的滲透
品牌商正擴大透過將固定物流成本外包給第三方物流 (3PL) 公司,將成本轉化為可變成本,並利用跨區域的規模經濟和專業知識。 McClain 與 Circle K 簽訂的 2025 年契約,充分展現了整合庫存可視性和車隊最佳化的運輸和配送解決方案的吸引力。合約物流供應商透過聯合包裝、促銷捆綁和全通路退貨等方式實現差異化,從而建立牢固的長期合作關係。這種模式使快速消費品 (FMCG) 公司能夠在不佔用大量資金的情況下快速部署自動化、合規系統和分析工具。這種模式加速了快速消費品物流市場向服務型生態系統的演進。
燃油價格波動
柴油價格波動對運輸預算造成沉重負擔,燃料成本約佔全球卡車運輸營運成本的25%。雖然額外費用公式和避險協議可以緩解部分影響,但時間上的差異往往會導致承運人和快速消費品托運人之間的運費談判出現摩擦。外匯波動使跨境路線的成本計算更加複雜,促使人們更多地採用路線最佳化軟體、引入液化天然氣等替代燃料,以及重新設計運輸網路以減少空駛里程。因此,價格的不確定性正在抑制投資,並降低快速消費品物流市場的利潤率。
細分市場分析
到2025年,運輸業將佔總收入的66.35%,凸顯其在龐大的分銷網路中運輸大批量貨物的關鍵作用。公路貨運仍然是該網路的核心,連接著製造地、區域配送中心和最後一公里配送中心,而海運和鐵路運輸則支持跨洲的大批量貨物運輸。如今,競爭優勢主要體現在多模態整合、永續的車隊更新以及能夠降低運輸波動性的、數據驅動的路線規劃。附加價值服務雖然規模較小,但正以4.74%的複合年成長率快速成長,因為品牌商尋求在更靠近需求點的地方進行聯合包裝、貼標和配套服務,以縮短前置作業時間和降低行銷風險。透過將核心運輸業務與客製化服務相結合,供應商有機會在快速消費品物流市場中佔據更大的佔有率。
全通路活動的活性化導致訂單類型更加複雜,從而推動了對延遲配置和退貨管理的需求。倉庫內自動化分類系統、協作機器人和品質保證單元的投資將提高處理速度並減少錯配錯誤。能夠在單一合約中提供運輸、倉儲和客製化服務的營運商將提高客戶留存率並增加客戶錢包佔有率。因此,儘管運輸環節仍將是基礎,但快速消費品物流市場的高收入成長正在轉向能夠增強客戶親密度並鎖定長期需求的更高服務層級。
常溫運輸網路將維持其2025年價值的63.40%,這反映了在標準溫度下安全運輸乾貨、家居用品和個人保健產品的優勢。統一的通訊協定和高容積利用率實現了規模經濟,從而能夠進行更密集的路線規劃並降低單位成本。營運商優先考慮存貨周轉演算法和污染控制,以確保高週轉率SKU的產品品質。貨架設計和即時狀態監控方面的同步基礎設施升級,進一步提高了運轉率並減少了廢棄物。
同時,受消費者對加工食品和原料藥(API)等需要冷藏運輸的藥品的需求推動,到2031年,冷藏物流的複合年成長率將達到4.45%。投資重點集中在高層冷凍庫、自動化托盤穿梭車和配備遠端資訊處理系統的冷藏貨櫃(可實現門到門-18°C的低溫運輸)。高效節能的冷媒和可再生能源設施將有助於降低營運成本並實現環境、社會和治理(ESG)目標。冷藏和超低溫物流將分別滿足乳製品、生鮮食品和生技藥品等細分市場的需求,並強化多層次的服務組合,從而為快速消費品(FMCG)物流市場的供應商拓展收入來源。
區域分析
到2025年,亞太地區將佔全球營收的36.20%,並維持最快的區域成長勢頭,到2031年年均複合成長率將達到4.63%。快速的都市化、不斷壯大的中產階級以及數位支付的廣泛普及,正在推動對現代分銷和電子商務的需求。高速鐵路走廊、港口擴建和公路改善正在縮短運輸時間、降低物流成本,刺激投資流入。雀巢馬來西亞投資5,600萬美元建設的巴生港樞紐,體現了現有(棕地)和新建(待開發區)設施擴容以同時服務區域出口和國內分銷的趨勢。
在北美,先進的基礎設施、早期採用的數位化視覺化工具以及永續性試點計畫正在融合發展。 Green Line為億滋印度公司部署液化天然氣卡車,與美國-加拿大路線上正在推行的類似碳減排舉措遙相呼應。在歐洲,碳邊境調節機制(CBAM)和循環經濟指令等法規環境正鼓勵營運商升級到低排放量車輛並實現倉庫電氣化。密集型跨境運輸需要完善的單證和即時海關整合,以避免英國脫歐後可能出現的擁塞和新制裁帶來的複雜情況。
在南美洲,不斷成長的線上需求推動了對保稅倉庫和「最後一公里」群眾外包車輛的需求,從而繞過了擁擠的城市高速公路。巴西2024年上半年的電子商務銷售額達到286.6億美元就印證了這一點。同時,中東和非洲的物流能力也在穩步提升,這得益於自由貿易區、機場物流園區以及捐助者資助的低溫運輸走廊,這些設施為生鮮食品和疫苗的運輸提供了支持。雖然地域多角化降低了對單一經濟週期的依賴風險,但要想在快速消費品物流市場取得成功,服務模式必須柔軟性,以適應當地基礎設施的差異和監管環境的差異。
其他福利:
- Excel格式的市場預測(ME)表
- 3個月的分析師支持
目錄
第1章 引言
- 研究假設和市場定義
- 調查範圍
第2章調查方法
第3章執行摘要
第4章 市場情勢
- 市場概覽
- 市場促進因素
- 電子商務加速發展及對最後一公里配送的期望
- 第三方物流/合約物流在快速消費品產業的滲透
- 建構低溫運輸網路
- 端到端數位視覺化平台
- 重新設計中心輻射式網路主導本地消費
- 透過碳排放稅整合配送中心網路
- 市場限制
- 燃油價格波動
- 跨境監管的複雜性
- 二、三線倉庫勞動力短缺
- 第三方/第四方物流業者之間的資料互通性差距
- 價值/供應鏈分析
- 監管環境
- 技術展望
- 波特五力模型
- 新進入者的威脅
- 買方的議價能力
- 供應商的議價能力
- 替代品的威脅
- 競爭對手之間的競爭
- 專題報導:電子商務對快速消費品物流的影響
- 亮點——合約物流和綜合物流的需求趨勢
第5章 市場規模與成長預測
- 透過服務
- 運輸
- 路
- 鐵路
- 航空
- 海
- 倉儲和配送
- 附加價值服務及更多
- 運輸
- 透過溫度控制
- 冷藏(0-5°C)
- 冷凍(-18 至 0°C)
- 環境的
- 冷凍/超低溫產品(低於-20°C)
- 按產品類型
- 食品/飲料
- 個人護理
- 家居用品
- 非處方藥和醫療保健
- 其他
- 透過分銷管道
- 線上
- 離線
- 按地區
- 北美洲
- 美國
- 加拿大
- 墨西哥
- 南美洲
- 巴西
- 秘魯
- 智利
- 阿根廷
- 其他南美洲
- 亞太地區
- 印度
- 中國
- 日本
- 澳洲
- 韓國
- 東南亞(新加坡、馬來西亞、泰國、印尼、越南、菲律賓)
- 亞太其他地區
- 歐洲
- 英國
- 德國
- 法國
- 西班牙
- 義大利
- 比荷盧經濟聯盟(比利時、荷蘭、盧森堡)
- 北歐國家(丹麥、芬蘭、冰島、挪威、瑞典)
- 其他歐洲地區
- 中東和非洲
- 阿拉伯聯合大公國
- 沙烏地阿拉伯
- 南非
- 奈及利亞
- 其他中東和非洲地區
- 北美洲
第6章 競爭情勢
- 市場集中度
- 策略趨勢
- 市佔率分析
- 公司簡介
- DHL Group
- Kuehne+Nagel
- DSV
- CH Robinson
- Ceva Logistics
- XPO Logistics
- Rhenus Logistics
- FM Logistic
- Hellmann Worldwide Logistics
- Penske Logistics
- Kenco Logistics
- JD Logistics
- FedEx Supply Chain
- Nippon Express
- Yusen Logistics
- Geodis
- GXO Logistics
- Savino Del Bene
- ID Logistics Group
- Brimich Logistics
第7章 市場機會與未來展望
The FMCG Logistics Market is expected to grow from USD 1.37 trillion in 2025 to USD 1.44 trillion in 2026 and is forecast to reach USD 1.84 trillion by 2031 at 5.03% CAGR over 2026-2031.
Robust e-commerce uptake, rapid urbanization, and rising middle-class consumption are reshaping distribution models, pushing companies toward technology-enabled, sustainability-minded supply chains that deliver end-to-end visibility and faster fulfillment. Transportation services continue to dominate value creation, while value-added offerings such as co-packing and labeling gain momentum as brands seek customization closer to demand. Cold-chain build-outs unlock growth in frozen and healthcare categories, and digital visibility platforms foster predictive decision-making that lowers waste and stockouts. Intensifying competition and recent megamergers encourage scale economies even as regional specialists retain an edge in localized, last-mile agility within the FMCG logistics market.
Global FMCG Logistics Market Trends and Insights
E-commerce Acceleration and Last-Mile Expectations
Faster online growth compresses delivery windows and fragments order profiles, forcing the FMCG logistics market to pivot toward urban micro-fulfillment and same-day drops. Brazil's FMCG online sales rose 13.6% in H1 2024, with health & beauty up 17.8% and food up 26.2%. Providers are staging inventory in forward hubs, layering in electric vans, and rolling out real-time tracking to satisfy consumers who now expect precision and sustainability together. Investment flows into route-optimization platforms and reverse-logistics capabilities that help balance bulk B2B replenishment with escalating direct-to-consumer volumes. These shifts embed competitive stakes for asset-light brands that rely on partners for last-mile excellence within the FMCG logistics market.
3PL / Contract-Logistics Penetration in FMCG
Brands increasingly convert fixed logistics costs to variable spend by outsourcing to 3PLs, unlocking scale and specialized expertise across multiple geographies. McLane's 2025 agreement with Circle K illustrates the appeal of integrated transportation and distribution solutions that bundle inventory visibility and fleet optimization. Contract logistics players differentiate through co-packing, promotional bundling, and omnichannel returns, creating sticky, multi-year relationships. The model relieves FMCG firms from capital commitments while ensuring rapid deployment of automation, compliance systems, and analytics an arrangement that accelerates the FMCG logistics market evolution toward service-rich ecosystems.
Fuel-Price Volatility
Diesel cost swings weigh on transport budgets, with fuel accounting for roughly 25% of trucking operating expenses worldwide. Surcharge formulas and hedging contracts cushion some exposure, yet timing gaps often spark rate tensions between carriers and FMCG shippers. Currency shifts complicate cost calculations on cross-border lanes, prompting greater adoption of route-optimization software, alternative fuels such as LNG, and network redesigns that slash empty miles. Price unpredictability therefore tempers investment appetites and erodes margins across the FMCG logistics market.
Other drivers and restraints analyzed in the detailed report include:
- Cold-Chain Network Build-Out
- End-to-End Digital Visibility Platforms
- Cross-Border Regulatory Complexity
For complete list of drivers and restraints, kindly check the Table Of Contents.
Segment Analysis
Transportation generated 66.35% of 2025 revenue, underscoring its foundational role in moving high-turnover goods through sprawling distribution webs. Road freight anchors the network, bridging manufacturing hubs, regional DCs, and last-mile nodes, while sea and rail support bulk intercontinental moves. Competitive differentiation now hinges on multi-modal integration, sustainable fleet upgrades, and data-rich route planning that trims transit variance. Value-added services, though smaller, expand at a 4.74% CAGR as brands seek co-packing, labeling, and kitting near demand centers to shrink lead times and marketing risks. This blend of core haulage with tailored services positions providers to capture greater share of the FMCG logistics market.
Intensifying omnichannel activity propels order-profile complexity, boosting needs for postponed configuration and returns management. Investments in automated sortation, collaborative robots, and quality-assurance cells inside warehouses translate into faster throughput and reduced mismatch errors. Providers capable of bundling transport, storage, and customization in a single contract deepen stickiness while growing wallet share. Consequently, the transportation segment remains the backbone, but high-margin growth tilts toward service layers that raise customer intimacy and lock in long-term demand within the FMCG logistics market.
Ambient networks retained 63.40% of 2025 value, reflecting the dominance of dry groceries, household goods, and personal-care items that travel safely at standard temperatures. Scale efficiencies stem from uniform handling protocols and high cube utilization, allowing dense route planning and lower unit costs. Operators prioritize inventory rotation algorithms and contamination controls to preserve product integrity across high-velocity SKUs. Parallel infrastructure upgrades in racking design and real-time condition monitoring drive uptime gains and shrink waste.
Conversely, frozen logistics logs a 4.45% CAGR to 2031, riding consumer appetite for convenience foods and API-based pharmaceuticals requiring sub-zero transit. Investment pours into high-bay freezers, automated pallet shuttles, and telematics-equipped reefers that maintain <-18 °C thresholds door-to-door. Energy-efficient refrigerants and renewable-powered facilities help offset operating costs and meet ESG targets. Chilled and ultra-low categories sustain niche demand for dairy, fresh produce, and biologics, respectively, reinforcing a tiered service mix that broadens provider revenue channels across the FMCG logistics market.
The FMCG Logistics Market Report is Segmented by Service (Transportation, Warehousing & Distribution, Value-Added Services), Temperature Control (Chilled, Frozen, and More), Product Category (Food & Beverage, Personal Care, and More), Distribution Channel (Online, Offline), and Geography (North America, South America, Asia-Pacific, Europe, Middle East and Africa). The Market Forecasts are Provided in Terms of Value (USD).
Geography Analysis
Asia-Pacific generated 36.20% of 2025 global revenue and sustains the fastest regional momentum at a 4.63% CAGR to 2031. Rapid urbanization, burgeoning middle classes, and digital payment ubiquity accelerate demand for modern trade and e-commerce alike. High-speed rail corridors, port expansions, and highway upgrades cut transit times and reduce logistics costs, propelling investment inflows. Nestle Malaysia's USD 56 million Port Klang hub underscores the wave of brownfield and greenfield capacity designed to serve regional exports and domestic distribution simultaneously.
North America combines advanced infrastructure with early adoption of digital visibility tools and sustainability pilots. LNG-powered truck deployments such as GreenLine's fleet for Mondelez India mirror similar carbon-cutting initiatives across U.S. and Canadian lanes. Europe's regulatory environment, led by CBAM and circular-economy directives, nudges providers toward low-emission fleet renewals and warehouse electrification. Dense cross-border traffic demands impeccable documentation and real-time customs integration to avert post-Brexit congestion and emerging sanctions complexities.
South America's rising online propensity, evidenced by Brazil's USD 28.66 billion H1 2024 e-commerce haul, drives demand for bonded warehouses and last-mile crowdsourced fleets that bypass congested urban arterials. Meanwhile, Middle East & Africa witness incremental but steady capacity additions tied to free-trade zones, airport-centric logistics parks, and donor-funded cold-chain corridors supporting fresh produce and vaccines. Collectively, geographic diversification mitigates exposure to any single economic cycle, but service models must flex to local infrastructure gaps and regulatory heterogeneity to thrive in the FMCG logistics market.
- DHL Group
- Kuehne + Nagel
- DSV
- C.H. Robinson
- Ceva Logistics
- XPO Logistics
- Rhenus Logistics
- FM Logistic
- Hellmann Worldwide Logistics
- Penske Logistics
- Kenco Logistics
- JD Logistics
- FedEx Supply Chain
- Nippon Express
- Yusen Logistics
- Geodis
- GXO Logistics
- Savino Del Bene
- ID Logistics Group
- Brimich Logistics
Additional Benefits:
- The market estimate (ME) sheet in Excel format
- 3 months of analyst support
TABLE OF CONTENTS
1 Introduction
- 1.1 Study Assumptions and Market Definition
- 1.2 Scope of the Study
2 Research Methodology
3 Executive Summary
4 Market Landscape
- 4.1 Market Overview
- 4.2 Market Drivers
- 4.2.1 E-commerce acceleration and last-mile expectations
- 4.2.2 3PL / contract-logistics penetration in FMCG
- 4.2.3 Cold-chain network build-out
- 4.2.4 End-to-end digital visibility platforms
- 4.2.5 Rural consumption-led hub-and-spoke redesign
- 4.2.6 Carbon-tax-driven DC network consolidation
- 4.3 Market Restraints
- 4.3.1 Fuel-price volatility
- 4.3.2 Cross-border regulatory complexity
- 4.3.3 Tier-2/3 warehouse labour shortages
- 4.3.4 Data-interoperability gaps across 3PL/4PLs
- 4.4 Value / Supply-Chain Analysis
- 4.5 Regulatory Landscape
- 4.6 Technological Outlook
- 4.7 Porter's Five Forces
- 4.7.1 Threat of New Entrants
- 4.7.2 Bargaining Power of Buyers
- 4.7.3 Bargaining Power of Suppliers
- 4.7.4 Threat of Substitutes
- 4.7.5 Competitive Rivalry
- 4.8 Spotlight-Impact of E-commerce on FMCG Logistics
- 4.9 Spotlight-Contract and Integrated Logistics Demand
5 Market Size and Growth Forecasts
- 5.1 By Service (Value)
- 5.1.1 Transportation
- 5.1.1.1 Road
- 5.1.1.2 Rail
- 5.1.1.3 Air
- 5.1.1.4 Sea
- 5.1.2 Warehousing and Distribution
- 5.1.3 Value-added Services and Others
- 5.1.1 Transportation
- 5.2 By Temperature Control (Value)
- 5.2.1 Chilled (0-5 °C)
- 5.2.2 Frozen (-18-0°C)
- 5.2.3 Ambient
- 5.2.4 Deep-Frozen / Ultra-Low (less than-20 °C)
- 5.3 By Product Category (Value)
- 5.3.1 Food and Beverage
- 5.3.2 Personal Care
- 5.3.3 Household Care
- 5.3.4 OTC and Healthcare
- 5.3.5 Others
- 5.4 By Distribution Channel (Value)
- 5.4.1 Online
- 5.4.2 Offline
- 5.5 By Geography (Value)
- 5.5.1 North America
- 5.5.1.1 United States
- 5.5.1.2 Canada
- 5.5.1.3 Mexico
- 5.5.2 South America
- 5.5.2.1 Brazil
- 5.5.2.2 Peru
- 5.5.2.3 Chile
- 5.5.2.4 Argentina
- 5.5.2.5 Rest of South America
- 5.5.3 Asia-Pacific
- 5.5.3.1 India
- 5.5.3.2 China
- 5.5.3.3 Japan
- 5.5.3.4 Australia
- 5.5.3.5 South Korea
- 5.5.3.6 South East Asia (Singapore, Malaysia, Thailand, Indonesia, Vietnam, and Philippines)
- 5.5.3.7 Rest of Asia-Pacific
- 5.5.4 Europe
- 5.5.4.1 United Kingdom
- 5.5.4.2 Germany
- 5.5.4.3 France
- 5.5.4.4 Spain
- 5.5.4.5 Italy
- 5.5.4.6 BENELUX (Belgium, Netherlands, and Luxembourg)
- 5.5.4.7 NORDICS (Denmark, Finland, Iceland, Norway, and Sweden)
- 5.5.4.8 Rest of Europe
- 5.5.5 Middle East and Africa
- 5.5.5.1 United Arab of Emirates
- 5.5.5.2 Saudi Arabia
- 5.5.5.3 South Africa
- 5.5.5.4 Nigeria
- 5.5.5.5 Rest of Middle East And Africa
- 5.5.1 North America
6 Competitive Landscape
- 6.1 Market Concentration
- 6.2 Strategic Moves
- 6.3 Market Share Analysis
- 6.4 Company Profiles (includes Global level Overview, Market level overview, Core Segments, Financials as available, Strategic Information, Market Rank/Share for key companies, Products and Services, and Recent Developments)
- 6.4.1 DHL Group
- 6.4.2 Kuehne + Nagel
- 6.4.3 DSV
- 6.4.4 C.H. Robinson
- 6.4.5 Ceva Logistics
- 6.4.6 XPO Logistics
- 6.4.7 Rhenus Logistics
- 6.4.8 FM Logistic
- 6.4.9 Hellmann Worldwide Logistics
- 6.4.10 Penske Logistics
- 6.4.11 Kenco Logistics
- 6.4.12 JD Logistics
- 6.4.13 FedEx Supply Chain
- 6.4.14 Nippon Express
- 6.4.15 Yusen Logistics
- 6.4.16 Geodis
- 6.4.17 GXO Logistics
- 6.4.18 Savino Del Bene
- 6.4.19 ID Logistics Group
- 6.4.20 Brimich Logistics
7 Market Opportunities and Future Outlook
- 7.1 White-space and Unmet-Need Assessment
 快速消費品物流市場規模、佔有率、趨勢和預測:按產品類型、服務類型、運輸方式和地區分類,2026-2034年
 快速消費品物流市場:2026-2032年全球市場預測(依服務類型、溫度需求、包裝類型、通路和最終用戶產業分類)
 快速消費品物流市場規模、佔有率、成長及全球產業分析:按類型、應用和地區分類的洞察,2026-2034 年預測
 消費品物流市場規模、佔有率及成長分析(依產品類型、服務類型、運輸方式及地區分類)-2026-2033年產業預測
 快速物流市場分析及預測(截至 2033 年),按類型、產品、服務、技術、組件、應用、流程、最終用戶、解決方案分類
 歐洲快速消費品物流-市場佔有率分析、產業趨勢與統計、成長預測(2025-2030 年)
 全球快速消費品物流市場