


 |
市場調查報告書
商品編碼
1910551
氰化鈉:市場佔有率分析、產業趨勢與統計、成長預測(2026-2031)Sodium Cyanide - Market Share Analysis, Industry Trends & Statistics, Growth Forecasts (2026 - 2031) |
||||||
※ 本網頁內容可能與最新版本有所差異。詳細情況請與我們聯繫。
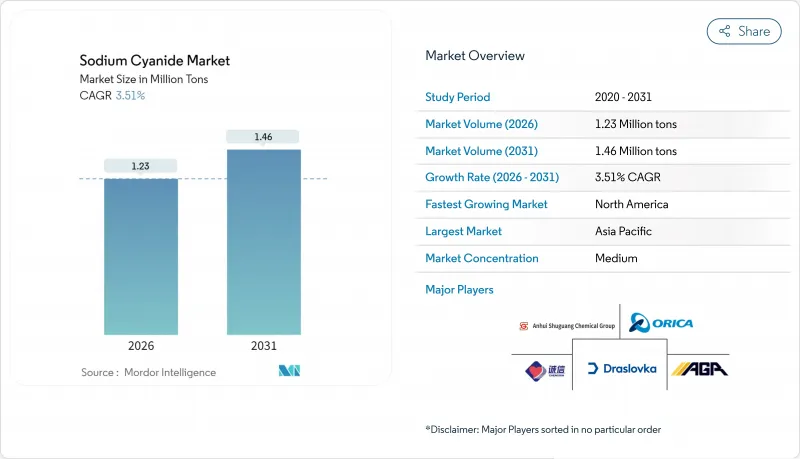
預計氰化鈉市場將從 2025 年的 119 萬噸增加到 2026 年的 123 萬噸,到 2031 年達到 146 萬噸,2026 年至 2031 年的複合年成長率為 3.51%。
傳統金礦區的需求日益成熟,同時,低品位礦石計劃、日益嚴格的環境法規以及模組化本地生產技術帶來的新機會(這些技術降低了物流風險)也構成了挑戰。北美和亞太地區的業者持續調整採購方式,轉向為偏遠堆浸場提供固態壓塊,而液態溶液則在自動化冶煉廠中越來越受歡迎,因為即時交貨可以降低庫存成本。市場領導領導者正透過收購來擴大產能和地理覆蓋範圍,從而加強垂直整合;同時,研發管線也正在推動替代浸出劑從試驗規模走向商業性化應用。儘管監管審查和運費溢價持續抑制銷售成長,但這些因素共同凸顯了氰化鈉市場的長期重要性。
全球氰化鈉市場趨勢及洞察
低品位金礦開採熱潮導致氰化鈉(NaCN)需求量激增
內華達金礦和紐蒙特塔奈米礦區等大型礦山礦石品位下降,導致氰化物用量比傳統方法增加了30-40%。儘管黃金產量保持穩定,但這項變化推高了試劑的平均用量。現代堆浸墊片可處理金品位低於1克/噸的礦石,並透過延長停留時間來確保經濟效益。礦石品位下降導致氰化鈉消費量不成比例地增加。西非氧化礦帶和西伯利亞不溶性礦床也出現了類似的趨勢,即使新礦床放緩,這些礦床的氰化鈉需求仍然穩定。儘管工程團隊不斷最佳化pH值、氧氣濃度和固液比,但化學原理仍表明,黃金溶解速率與氰化鈉濃度密切相關。這些因素共同支撐著全球氰化鈉市場結構性而非週期性的需求。
非洲和中亞堆浸計劃增加
從哈薩克的RG Gold金礦項目到Nordgold的Bissa-Buri礦區,探勘的地區的開發商已普遍採用堆浸工藝,該工藝依賴於穩定的氰化鈉投加量。許多礦床含有易被氰化物浸出的氧化礦石,可實現快速、低成本的建設。隨著中亞鐵路走廊和內陸港口的開通,區域氰化鈉生產商的供貨管道日益便利,降低了運費溢價,提高了利潤率。機構投資者現在要求企業必須符合國際氰化物控制規則(ICMC)才能獲得融資,這迫使營運商與能夠提供符合ICMC認證產品的供應商簽訂供應協議。因此,預計未來十年,在哈薩克、烏茲別克和薩赫勒地區擁有分銷中心的氰化鈉市場參與企業將佔據不斷成長的供應量的大部分佔有率。
毒性與日益增多的ICMC合規性審核
2024年,國際礦產監管委員會(ICMC)審核提高了標準,要求對氰化物的運輸、儲存和使用進行即時遙測,導致中型礦業公司的年度合規預算增加了15%至25%。英國發生的一起備受矚目的氰化物洩漏事故(造成90公斤魚類死亡)加劇了公眾的關注,並導致氰化物處理者的保險費上漲。歐盟和美國職業安全與健康管理局(OSHA)對空氣中氰化氫(HCN)的更嚴格規定,強制要求使用密封處理系統並升級個人防護設備。這些因素預計將限制產量成長,尤其是對於資金有限的小型礦業公司而言。
細分市場分析
2025年,固體氰化鈉佔出貨量的60.72%。這一比例得益於其低洩漏風險、長保存期限和簡化的ICMC文件(ORICA.COM)。大規模堆浸作業使用壓塊進行分級和控制溶解,從而在60-90天的浸出週期內調整氰化物濃度曲線。固體產品可透過ISO罐和1噸IBC貨櫃進行散裝運輸,並嚴格遵守監管鏈通訊協定。
同時,液態氰化鈉市場預計將以3.72%的複合年成長率成長,到2031年達到58.3萬噸。包裝和微型物流領域日益激烈的競爭正促使服務差異化從簡單的噸位轉向端到端的安全保障、遙測技術和試劑管理。以30-32%溶液形式供應的液態氰化鈉符合「循環取送」物流模式,有助於改善營運資金並實現精準的化學品供應比例。這些趨勢共同鞏固了氰化鈉市場的雙形態結構,液態氰化鈉市場正成為成長重點,而固體市場則繼續保持其主導地位。
本氰化鈉報告按產品形態(固體和液態溶液)、終端用戶產業(採礦、化學及其他終端用戶產業)和地區(亞太地區、北美、歐洲、南美以及中東和非洲)進行分析。市場預測以噸為單位。
區域分析
預計到2025年,亞太地區將佔全球氰化物市場29.95%的收入佔有率,主要得益於河北省的氰化物合成產業園、澳洲的世界級金礦以及印尼新興的堆浸計劃。然而,隨著更嚴格的環境法規和替代浸出劑試驗抑制了新增需求,預計該地區的成長速度將放緩至3%左右。同時,北美氰化鈉市場預計將實現3.98%的複合年成長率,主要受內華達黃金礦業合資企業、阿比蒂比綠岩帶探勘的重啟以及墨西哥模組化現場合成產能擴張的推動。在南美,秘魯和智利的尾礦再處理計劃正在推動該地區的試劑需求,而隨著哈薩克和烏茲別克開始開發新的氧化礦,中亞地區的產量小規模成長。歐洲仍然是一個穩定的、小規模的消費地區,德國和法國的工業用戶佔了大部分消費量。中東和非洲加起來所佔佔有率小規模,但隨著新礦床和基礎設施建設的推進,預計該地區將顯著成長。
其他福利:
- Excel格式的市場預測(ME)表
- 分析師支持(3個月)
目錄
第1章 引言
- 研究假設和市場定義
- 調查範圍
第2章調查方法
第3章執行摘要
第4章 市場情勢
- 市場概覽
- 市場促進因素
- 低品位金礦的快速開發需要更高的氰化鈉添加量。
- 非洲和中亞的堆浸計劃數量不斷增加
- 透過推廣本地安裝的模組化氰化鈉裝置來降低物流成本
- 亞太地區礦山氰化物曝氣系統應用範圍擴大
- 拉丁美洲含銀尾礦的回收。
- 市場限制
- 毒性及強化型ICMC合規性審核
- 中試規模改用甘胺酸/硫代硫酸鹽浸出劑
- 危險品海運附加費高
- 價值鏈分析
- 波特五力模型
- 供應商的議價能力
- 買方的議價能力
- 新進入者的威脅
- 替代品的威脅
- 競爭對手之間的競爭
第5章 市場規模與成長預測
- 按產品形式
- 固體(煤球/粉末)
- 液體溶液
- 按最終用戶行業分類
- 礦業
- 化學品
- 其他終端用戶產業
- 按地區
- 亞太地區
- 中國
- 澳洲和紐西蘭
- 印尼
- 亞太其他地區
- 北美洲
- 美國
- 加拿大
- 墨西哥
- 歐洲
- 俄羅斯
- 獨立國協(原俄羅斯)
- 其他歐洲地區
- 南美洲
- 巴西
- 秘魯
- 阿根廷
- 其他南美洲
- 中東和非洲
- 迦納
- 蘇丹
- 南非
- 其他中東和非洲地區
- 亞太地區
第6章 競爭情勢
- 市場集中度
- 策略趨勢
- 市佔率(%)/排名分析
- 公司簡介
- Anhui Shuguang Chemical Group
- Australian Gold Reagents Pty Ltd
- Changsha Hekang Chemical Co. Ltd
- CSBP(Wesfarmers Chemicals, Energy & Fertilisers)
- CyPlus GmbH
- Draslovka
- Hebei Chengxin Group Co. Ltd
- JINCHENG HONGSHENG CHEMICAL CO. LTD
- Orica Limited
- Taekwang Industrial Co. Ltd
- Tongsuh Petrochemical Corp. Ltd(Asahi Kasei Corporation)
- Unigel
- Ynnovate Sanzheng(Yingkou)Fine Chemicals Co. Ltd
第7章 市場機會與未來展望
The Sodium Cyanide market is expected to grow from 1.19 Million tons in 2025 to 1.23 Million tons in 2026 and is forecast to reach 1.46 Million tons by 2031 at 3.51% CAGR over 2026-2031.
Mature demand in traditional gold-mining jurisdictions co-exists with fresh momentum from low-grade ore projects, tighter environmental codes, and modular on-site production technologies that lower logistics risk. Operators in North America and Asia-Pacific continue to recalibrate procurement toward solid briquettes for remote heap-leach sites, while liquid solutions gain favor at automated mills where just-in-time delivery trims inventory costs. Market leaders strengthen vertical integration through acquisitions that expand capacity and regional reach, and research pipelines push alternative lixiviants from pilot scale toward commercial feasibility. Collectively, these forces reinforce the sodium cyanide market's long-term relevance even as regulatory scrutiny and freight premiums apply counterweights to volume growth.
Global Sodium Cyanide Market Trends and Insights
Boom in Low-Grade Gold Mining Requiring Higher NaCN Loadings
Declining ore grades at flagship operations such as Nevada Gold Mines and Newmont's Tanami asset now demand cyanide additions that are 30-40% above historical norms, a shift that lifts average reagent intensity even where gold output stays flat. Modern heap-leach pads handle ore below 1 g/t Au, using extended residence times to secure economic recoveries, and every incremental percentage point drop in head grade translates into a disproportionate rise in sodium cyanide consumption. Similar patterns play out in West African oxide belts and Siberia's refractory lodes, adding steady tonnage demand even as greenfield discoveries slow. Engineering teams continue to optimize pH, oxygen levels, and solid-liquid ratios, yet chemistry fundamentals still tether gold dissolution rates to cyanide concentration. These realities together underpin a structural, not cyclical, pull on the global sodium cyanide market.
Rising Heap-Leach Projects in Africa and Central Asia
From Kazakhstan's RG Gold circuit to Nordgold's Bissa-Bouly complex, developers in under-explored regions are standardizing heap-leach flowsheets that rely on consistent sodium cyanide dosing. Many deposits host oxidized ores that dissolve readily under cyanide leach, enabling capital-lite builds over short schedules. Proximity to regional NaCN producers is improving as rail corridors and dry ports open across Central Asia, trimming freight surcharges and strengthening margins. Institutional lenders now require International Cyanide Management Code (ICMC) compliance as a condition of finance, pushing operators to lock in supply contracts with vendors capable of delivering code-certified product. Consequently, sodium cyanide market participants with distribution hubs in Kazakhstan, Uzbekistan, and the Sahel stand to capture an outsized share of incremental volumes over the decade.
Toxicity and Tightening ICMC Compliance Audits
ICMC auditors raised the bar in 2024 by mandating real-time telemetry on cyanide transport, storage, and consumption, adding 15-25% to annual compliance budgets for mid-tier miners. A high-profile spill in the United Kingdom that resulted in 90 kg of fish mortality sharpened public scrutiny and triggered insurance premium hikes for cyanide handlers. Stringent European Union and U.S. Occupational Safety and Health Administration (OSHA) limits on airborne HCN now compel enclosed handling systems and personal protective equipment upgrades. These factors collectively temper volume growth, especially for junior miners with constrained capital.
Other drivers and restraints analyzed in the detailed report include:
- Increasing Adoption of Cyanide Sparging Systems in APAC Mines
- Recovery of Silver-Bearing Tailings in Latin America
- High Marine Freight Premiums for Hazardous Cargoes
For complete list of drivers and restraints, kindly check the Table Of Contents.
Segment Analysis
Solid sodium cyanide accounted for 60.72% of 2025 shipments, a position underpinned by the format's lower spill risk, longer shelf life, and simplified ICMC documentation ORICA.COM. Large heap-leach operations use briquettes to stage-gate dissolution, thereby regulating the cyanide concentration profile over 60-90 day leach cycles. Solid product handling also permits bulk ISO-tank or 1 ton IBC deliveries, aligning with strict chain-of-custody protocols.
Conversely, the liquids sub-segment is poised for 3.72% CAGR, closing in on 583,000 t by 2031. Competitive intensity intensifies around packaging and micro-logistics, with service differentiation shifting from mere tonnage to end-to-end safety, telemetry, and reagent stewardship. Delivered as 30-32% solution, liquids sync with "milk-run" logistics, improving working capital and enabling precise chem-feed ratios. Together these trends preserve the solid segment's command while elevating liquids as the growth spotlight, reinforcing the sodium cyanide market's dual-format architecture.
The Sodium Cyanide Report is Segmented by Product Form (Solid and Liquid Solution), End-User Industry (Mining, Chemicals, and Other End-User Industries), and Geography (Asia-Pacific, North America, Europe, South America, and Middle-East and Africa). The Market Forecasts are Provided in Terms of Volume (Tons).
Geography Analysis
Asia-Pacific held 29.95% revenue share in 2025 on the strength of China's cyanide synthesis park in Hebei, Australia's world-class gold camps, and Indonesia's emergent heap projects. However, regional growth cools to a mid-3% pace as tighter environmental norms and alternative lixiviant pilots moderate fresh demand. Conversely, North America's sodium cyanide market is expected to post 3.98% CAGR, underwritten by the Nevada Gold Mines joint venture, renewed exploration in the Abitibi greenstone belt, and modular on-site synth capacity adds in Mexico. South America's pipeline of tailings re-treatments in Peru and Chile nudges regional reagent needs upward, while Central Asian tonnage climbs off a small base as Kazakhstan and Uzbekistan open new oxide developments. Europe remains a steady yet small consumer, with industrial users in Germany and France dominating offtake. Africa and the Middle East together account for a modest share but deliver outsized growth where greenfield deposits intersect infrastructure upgrades.
- Anhui Shuguang Chemical Group
- Australian Gold Reagents Pty Ltd
- Changsha Hekang Chemical Co. Ltd
- CSBP (Wesfarmers Chemicals, Energy & Fertilisers)
- CyPlus GmbH
- Draslovka
- Hebei Chengxin Group Co. Ltd
- JINCHENG HONGSHENG CHEMICAL CO. LTD
- Orica Limited
- Taekwang Industrial Co. Ltd
- Tongsuh Petrochemical Corp. Ltd (Asahi Kasei Corporation)
- Unigel
- Ynnovate Sanzheng (Yingkou) Fine Chemicals Co. Ltd
Additional Benefits:
- The market estimate (ME) sheet in Excel format
- 3 months of analyst support
TABLE OF CONTENTS
1 Introduction
- 1.1 Study Assumptions and Market Definition
- 1.2 Scope of the Study
2 Research Methodology
3 Executive Summary
4 Market Landscape
- 4.1 Market Overview
- 4.2 Market Drivers
- 4.2.1 Boom in low-grade gold mining requiring higher NaCN loadings
- 4.2.2 Rising heap-leach projects in Africa and Central Asia
- 4.2.3 Growth of on-site modular NaCN plants lowering logistics cost
- 4.2.4 Increasing adoption of cyanide sparging systems in APAC mines
- 4.2.5 Recovery of silver-bearing tailings in Latin America
- 4.3 Market Restraints
- 4.3.1 Toxicity and tightening ICMC compliance audits
- 4.3.2 Pilot-scale switch to glycine/thiosulphate lixiviants
- 4.3.3 High marine freight premiums for hazardous cargoes
- 4.4 Value Chain Analysis
- 4.5 Porter's Five Forces
- 4.5.1 Bargaining Power of Suppliers
- 4.5.2 Bargaining Power of Buyers
- 4.5.3 Threat of New Entrants
- 4.5.4 Threat of Substitutes
- 4.5.5 Competitive Rivalry
5 Market Size and Growth Forecasts (Value)
- 5.1 By Product Form
- 5.1.1 Solid (Briquettes/Powder)
- 5.1.2 Liquid Solution
- 5.2 By End-user Industry
- 5.2.1 Mining
- 5.2.2 Chemicals
- 5.2.3 Other End-User Industries
- 5.3 By Geography
- 5.3.1 Asia-Pacific
- 5.3.1.1 China
- 5.3.1.2 Australia and New Zealand
- 5.3.1.3 Indonesia
- 5.3.1.4 Rest of Asia-Pacific
- 5.3.2 North America
- 5.3.2.1 United States
- 5.3.2.2 Canada
- 5.3.2.3 Mexico
- 5.3.3 Europe
- 5.3.3.1 Russia
- 5.3.3.2 CIS (ex-Russia)
- 5.3.3.3 Rest of Europe
- 5.3.4 South America
- 5.3.4.1 Brazil
- 5.3.4.2 Peru
- 5.3.4.3 Argentina
- 5.3.4.4 Rest of South America
- 5.3.5 Middle-East and Africa
- 5.3.5.1 Ghana
- 5.3.5.2 Sudan
- 5.3.5.3 South Africa
- 5.3.5.4 Rest of Middle-East and Africa
- 5.3.1 Asia-Pacific
6 Competitive Landscape
- 6.1 Market Concentration
- 6.2 Strategic Moves
- 6.3 Market Share (%)/Ranking Analysis
- 6.4 Company Profiles (includes Global level Overview, Market level overview, Core Segments, Financials as available, Strategic Information, Market Rank/Share for key companies, Products and Services, and Recent Developments)
- 6.4.1 Anhui Shuguang Chemical Group
- 6.4.2 Australian Gold Reagents Pty Ltd
- 6.4.3 Changsha Hekang Chemical Co. Ltd
- 6.4.4 CSBP (Wesfarmers Chemicals, Energy & Fertilisers)
- 6.4.5 CyPlus GmbH
- 6.4.6 Draslovka
- 6.4.7 Hebei Chengxin Group Co. Ltd
- 6.4.8 JINCHENG HONGSHENG CHEMICAL CO. LTD
- 6.4.9 Orica Limited
- 6.4.10 Taekwang Industrial Co. Ltd
- 6.4.11 Tongsuh Petrochemical Corp. Ltd (Asahi Kasei Corporation)
- 6.4.12 Unigel
- 6.4.13 Ynnovate Sanzheng (Yingkou) Fine Chemicals Co. Ltd
7 Market Opportunities and Future Outlook
- 7.1 White-space and Unmet-Need Assessment
 全球氰化鈉市場報告:2021-2032年歷史表現及預測
 氰化鈉市場商機、成長要素、產業趨勢分析及2026-2035年預測。
 全球固體氰化鈉市場研究報告(2026版)
 2026-2034年全球氰化鈉市場規模、佔有率、趨勢和成長分析報告
 氰化鈉市場按產品類型、純度等級、應用和分銷管道分類,全球預測(2026-2032年)
 氰化鈉市場規模、佔有率及成長分析(依產品類型、產業垂直領域、銷售管道及地區分類)-2026-2033年產業預測氰化鈉市場-2025-2030年預測
 固體氰化鈉:全球市佔率及排名、總收入及需求預測(2025-2031年)
 非洲氰化鈉市場 -市場佔有率分析、行業趨勢和統計、成長預測(2025-2030 年)
 氰化鈉市場:依產品類型、依最終用戶、按地區