


 |
市場調查報告書
商品編碼
1907303
全球塑膠包裝市場:市場佔有率分析、產業趨勢與統計、成長預測(2026-2031年)Global Plastic Packaging - Market Share Analysis, Industry Trends & Statistics, Growth Forecasts (2026 - 2031) |
||||||
※ 本網頁內容可能與最新版本有所差異。詳細情況請與我們聯繫。
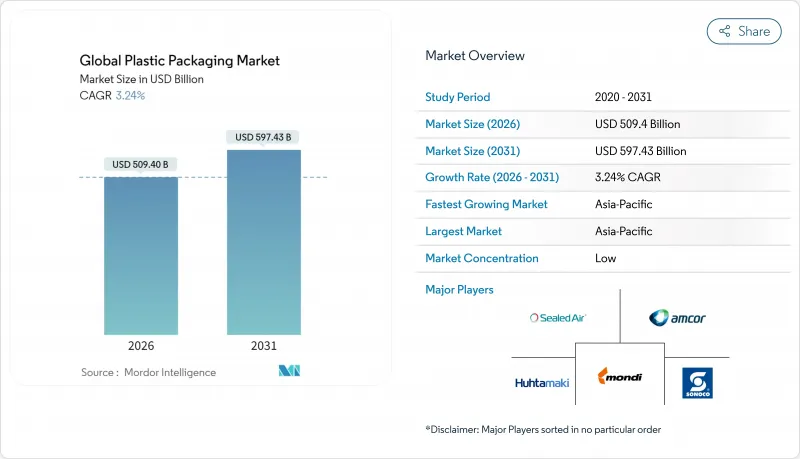
預計到2026年,塑膠包裝市場規模將達到5,094億美元,高於2025年的4,934.2億美元。預計到2031年,該市場規模將達到5,974.3億美元,2026年至2031年的複合年成長率為3.24%。
儘管監管力度加大,但蓬勃發展的電子商務、日益成長的簡便食品消費以及與替代材料的成本競爭力等因素,仍在支撐著市場的持續需求。能夠投資化學回收生產線、重新設計包裝以符合瓶蓋限制法規並實現高回收率的現有企業正在獲得競爭優勢,而規模較小的加工商則面臨著不斷上漲的合規成本。同時,物流成本的上升也強化了輕巧靈活包裝的價值提案,這種包裝形式能夠降低運輸成本,並加強電子商務、食品和醫療保健產業的供應商協議。規模正成為資金籌措先進研發和閉合迴路供應鏈協議的必要條件,加速了產業整合。
全球塑膠包裝市場趨勢與洞察
電子商務的蓬勃發展需要耐用的末端配送包裝。
在最後一公里配送模式中,包裹需要經過多次搬運並按體積重量收費,品牌商更傾向於使用薄膜、軟包裝袋和郵寄袋,與硬質包裝相比,這些包裝可減少高達 75% 的空隙率。亞馬遜的「無挫包裝」通訊協定(目前涵蓋超過 30 萬個 SKU)已成為事實上的行業標準,引導中小型賣家採用符合規範的聚乙烯和聚丙烯包裝解決方案。自動化分類線要求包裝採用單一材料結構以透過光學檢測;混合材料包裝則有被拒收和返工高成本的風險。包裝體積減少 15% 可轉化為運輸成本降低 12%,足以抵消高性能軟性薄膜材料成本 8-10% 的增加。阻隔塗層軟性包裝還能為電子產品和溫度敏感型藥品提供更全面的保護,使其應用範圍擴展到食品以外的領域。
簡便食品和飲料消費量的快速成長
都市化、家庭規模縮小和工作時間延長正在推動消費者對單一品類、常溫保存食品的需求。預計到2024年,都市區消費者對包裝食品的購買量將年增8.2%,創歷史新高。多層軟包裝結合了氧氣和水分阻隔性以及微波爐適用性,與紙質包裝相比,具有更長的保存期限和更高的安全性。為了避免監管處罰,飲料生產商會增加固定瓶蓋和防篡改功能,每單位成本增加0.02至0.04歐元。常溫保存包裝也使乳製品和果汁品牌能夠打入缺乏冷藏配送網路的農村市場,進一步鞏固了軟包裝在新興市場的優勢。
全球禁止及課稅一次性塑膠製品
加州塑膠袋禁令、英國濕紙巾禁令以及南澳發泡聚苯乙烯限制,幾乎在一夜之間摧毀了整個產品類型。包括進口限制和高額罰款在內的執法行動,促使企業緊急改善產品並進行資本投資。一項針對加納擬議塑膠袋禁令的學術研究估計,該禁令每週將造成34萬美元的稅收損失,凸顯了其廣泛的經濟連鎖反應。跨國公司在不同司法管轄區面臨「一次性」產品定義不一的問題,這使得全球SKU(庫存單位)的統一化變得更加複雜。隨著立法者將禁令範圍擴大到顯而易見的一次性產品之外,餐飲服務和二次包裝產品也面臨更大的銷售風險。
細分市場分析
預計到2025年,軟包裝將佔銷售額的54.10%,並在2031年之前以每年4.41%的速度成長,在塑膠包裝市場中顯著超越硬質包裝。燃油價格上漲和按體積重量計費的貨運價格正在推動市場結構轉向軟包裝轉變,例如採用袋裝、郵寄包裝和纏繞包裝,從而降低運輸物流成本。隨著加工商採用符合生產者延伸責任(EPR)框架且不影響保存期限的單一材料方案,薄膜和纏繞包裝的使用率正在不斷提高。在結構和高階展示至關重要的領域,硬質瓶、罐和托盤仍然必不可少,但隨著可重複密封的拉鍊、吸嘴和自主型形式的出現,其市場佔有率正在逐漸下降,因為它們正在削弱傳統的獨特優勢。提供軟硬包裝的綜合供應商正在獲得更高的市場佔有率,因為品牌所有者正在最佳化其供應商結構。
如果樹脂價格飆升超過其轉嫁能力,硬質包裝細分市場將面臨利潤率壓力。另一方面,軟包裝透過提供更低的單位重量來降低風險。玻璃和金屬替代品將繼續在飲料和罐頭食品等小眾市場佔有一席之地。托盤製造商將繼續在餐飲服務管道佔有一席之地,因為該通路需要烤箱適用和微波爐適用等增值功能。總體而言,軟包裝將在銷售和成長率方面佔據主導地位,並在整個預測期內鞏固其在推動塑膠包裝市場發展中的核心作用。
到2025年,聚乙烯仍將佔據塑膠包裝市場41.85%的佔有率,而聚丙烯則以5.55%的強勁複合年成長率(CAGR)成為成長最快的樹脂家族。聚丙烯具有高耐熱性、優異的透明度和良好的密封性,使其成為滿足可回收性要求並確保食品安全的單一材料解決方案。 PET由於其成熟的瓶到瓶回收循環,在飲料行業保持穩固的地位,但機械回收的局限性限制了在不增加高成本的化學回收產能的情況下提高再生材料含量。 PVC、聚苯乙烯和其他苯乙烯類樹脂由於日益嚴格的環境法規和品牌所有者偏好的轉變而逐漸減少,這為生物基樹脂和特種共聚物的細分市場創造了機會。
化學回收的經濟效益有利於那些具有穩定解聚路徑的樹脂。因此,PET和PP吸引了更多資本投資,而PS和PVC計劃則難以克服投資障礙。樹脂供應商正透過應用工程團隊來提升自身競爭力,這些團隊能夠指導加工商完成材料轉換,在不斷發展的生產者延伸責任(EPR)框架和FDA食品接觸法規的背景下,這項服務備受重視。
區域分析
預計到2025年,亞太地區將佔全球塑膠包裝市場收入的40.80%,年複合成長率達6.78%,成為塑膠包裝市場成長的強勁驅動力。中國目前佔最大佔有率,但日益嚴格的廢棄物進口法規和碳中和目標正迫使中國本土製造商投資建設回收能力。印度、越南和印尼的銷售成長均達到兩位數,這得益於有組織的零售和電子商務的滲透率不斷提高。匯率波動和地緣政治因素正促使跨國品牌所有者在東南亞國協實現採購多元化,並減少對單一國家的過度依賴。
北美地區正經歷穩定的個位數中成長,這主要得益於醫藥需求、生鮮食品物流以及先進回收設施的發展。省級塑膠廢棄物法規雖然增加了複雜性,但也為再生塑膠和單一材料技術的開發商創造了新的機會。加拿大即將實施的全國性生產者延伸責任制(EPR)有望加速向可回收包裝的轉型,並促進跨國合作。
歐洲是生產者延伸責任制(EPR)和固定排放限值規定的中心,其價值成長雖較為溫和,但對全球設計標準的影響卻舉足輕重。高昂的勞動力和能源成本推動了塑膠的製程自動化和輕量化,而不斷提高的再生材料含量基準值則刺激了對化學回收的投資。東歐的加工企業正吸引著許多品牌公司將生產基地遷回國內,這些公司希望在不承擔西歐高成本的情況下,盡可能接近性生產區域,從而推動了資本流入波蘭和匈牙利。
拉丁美洲和中東及非洲的市場佔有率落後,但部分地區正經歷快速成長。巴西受益於需要阻隔包裝的農產品出口,而海灣合作理事會(GCC)國家則利用其石化一體化優勢出口價格具有競爭力的樹脂。非洲市場正開始禁止一次性包裝,這為能夠提供價格實惠、克重低、阻隔性高的軟包裝解決方案的製造商創造了一個充滿前景的市場。
其他福利:
- Excel格式的市場預測(ME)表
- 3個月的分析師支持
目錄
第1章 引言
- 研究假設和市場定義
- 調查範圍
第2章調查方法
第3章執行摘要
第4章 市場情勢
- 市場概覽
- 市場促進因素
- 電子商務的蓬勃發展推動了對耐用型末端配送包裝的需求。
- 簡便食品和飲料的消費量迅速成長
- 與其他基材的成本競爭力比較
- 擴大化學品回收基礎設施
- 過渡到單一材料薄膜以符合生產者延伸責任制 (EPR) 的要求
- 歐盟繫繩帽法規推動了對特種封口的需求
- 市場限制
- 全球禁止及課稅一次性塑膠製品
- 石油原料價格波動
- 品牌擁有者轉向使用軟性紙包裝
- 由於可重複使用和補充裝模式的普及,銷量下降。
- 供應鏈分析
- 監理展望
- 技術展望
- 波特五力分析
- 新進入者的威脅
- 買方和消費者的議價能力
- 供應商的議價能力
- 替代品的威脅
- 競爭對手之間的競爭
- 投資分析
第5章 市場規模與成長預測
- 按包裝類型
- 硬包裝類型
- 瓶子和罐子
- 瓶蓋和封口
- 托盤和容器
- 其他產品類型
- 軟性包裝類型
- 麻袋和袋子
- 薄膜和包裝
- 其他產品類型
- 硬包裝類型
- 材料
- 聚乙烯(高密度聚苯乙烯、低密度聚乙烯、線性低密度聚乙烯)
- 聚對苯二甲酸乙二醇酯(PET)
- 聚丙烯(PP)
- 聚苯乙烯和EPS
- 聚氯乙烯(PVC)
- 其他(EVOH、生質塑膠等)
- 按最終用戶行業分類
- 食物
- 飲料
- 醫療和藥品
- 化妝品和個人護理
- 其他終端用戶產業
- 透過分銷管道
- 直銷
- 間接銷售
- 按地區
- 北美洲
- 美國
- 加拿大
- 墨西哥
- 歐洲
- 德國
- 英國
- 法國
- 義大利
- 西班牙
- 俄羅斯
- 其他歐洲地區
- 亞太地區
- 中國
- 印度
- 日本
- 韓國
- 澳洲和紐西蘭
- 亞太其他地區
- 中東和非洲
- 中東
- 阿拉伯聯合大公國
- 沙烏地阿拉伯
- 土耳其
- 其他中東地區
- 非洲
- 南非
- 奈及利亞
- 埃及
- 其他非洲地區
- 中東
- 南美洲
- 巴西
- 阿根廷
- 其他南美洲
- 北美洲
第6章 競爭情勢
- 市場集中度
- 策略趨勢
- 市佔率分析
- 公司簡介
- Amcor PLC
- Mondi PLC
- Sealed Air Corporation
- ALPLA Group
- International Paper
- Pact Group
- Plastipak Holdings Inc.
- Huhtamaki Oyj
- UFlex Limited
- Constantia Flexibles
- Tetra Pak International SA
- Novolex
- Anchor Packaging LLC
- Liquibox(Olympus Partners)
- Quadpack Industries SA
- Dart Container Corporation
- American Packaging Corporation
- Printpack Inc.
- Winpak Ltd.
- Sigma Plastics Group
- Sonoco Products Company
- Transcontinental Inc.
- Greif, Inc.
- Coveris Group
- Nampak Ltd.
第7章 市場機會與未來展望
plastic packaging market size in 2026 is estimated at USD 509.4 billion, growing from 2025 value of USD 493.42 billion with 2031 projections showing USD 597.43 billion, growing at 3.24% CAGR over 2026-2031.
Robust e-commerce activity, rising convenience-food consumption, and cost-competitive advantages over alternate substrates underpin sustained demand even as regulatory scrutiny intensifies. Incumbents able to fund chemical-recycling lines, redesign packs for tethered-cap rules, and meet high recycled-content thresholds secure competitive insulation while smaller converters confront escalating compliance costs. Concurrently, logistics inflation elevates the value proposition of lightweight flexible formats that trim freight bills, strengthening supplier contracts in e-commerce, food, and healthcare channels. Consolidation accelerates as scale becomes prerequisite for funding advanced R&D and closed-loop supply agreements.
Global Plastic Packaging Market Trends and Insights
E-commerce Boom Demanding Durable Last-Mile Packs
Last-mile delivery models expose packages to multiple handling events and dimensional weight billing, prompting brand owners to favor films, pouches, and mailers that shrink void space by up to 75% versus rigid alternatives. Amazon's frustration-free packaging protocol, now covering more than 300,000 SKUs, shapes de facto industry specifications and pushes SME sellers toward compliant polyethylene and polypropylene solutions. Automated sortation lines require mono-material constructions that withstand optical detection; mixed-material packs risk rejection and costly rework. A 15% reduction in package volume translates to 12% lower freight expenditure, more than offsetting the 8-10% material premium for high-performance flexible films. Barrier-coated flexibles also extend protection to electronics and temperature-sensitive pharmaceuticals, broadening addressable segments beyond food.
Surge in Convenience-Food and Beverage Consumption
Urbanization, smaller household sizes, and longer working hours spur demand for single-portion, shelf-stable meals. Processed-food uptake among urban consumers rose 8.2% year-on-year in 2024, the fastest climb on record.Multilayer flexibles combining oxygen and moisture barriers plus microwave compatibility outperform paper-based options on shelf-life and safety. Beverage innovators add tethered closures and tamper-evident features, absorbing EUR 0.02-0.04 extra per unit in manufacturing cost to avoid regulatory penalties. Extended shelf-life packs enable dairy and juice brands to reach rural areas lacking cold chains, further cementing flexible dominance in emerging markets.
Global Single-Use Plastic Bans and Taxes
California's bag prohibitions, the UK's wet-wipe ban, and South Australia's EPS restrictions remove entire product categories virtually overnight. Enforcement includes import restrictions and stiff fines, driving emergency reformulations and CapEx outlays. Academic work on Ghana's proposed bag bans estimates weekly tax-revenue losses of USD 0.34 million, underscoring broader economic spillovers. Multinationals grapple with divergent definitions of "single-use" across jurisdictions, complicating global SKU harmonization. As legislators widen scope beyond obvious disposable items, additional volume risks emerge for food-service and secondary-packaging formats.
Other drivers and restraints analyzed in the detailed report include:
- Cost-Competitive Performance Versus Alternate Substrates
- Expansion of Chemical-Recycling Infrastructure
- Volatile Petro-Feedstock Prices
For complete list of drivers and restraints, kindly check the Table Of Contents.
Segment Analysis
Flexible formats commanded 54.10% of 2025 sales and are forecast to grow at 4.41% annually through 2031, expanding the plastic packaging market far faster than rigid alternatives. Fuel cost inflation and dimensional-weight freight tariffs reinforce a structural migration toward pouches, mailers, and wrap films that cut outbound logistics charges. Films and wraps gain further traction as converters deploy mono-material options that satisfy EPR frameworks without compromising shelf life. Rigid bottles, jars, and trays retain indispensability where structure or premium shelf presence is paramount, yet their share gradually declines as resealable zippers, spouts, and stand-up formats erode historical feature advantages. Integrated suppliers offering both formats secure higher wallet share as brand owners streamline vendor bases.
Rigid-package sub-segments confront margin pressure when resin spikes outpace pass-through ability, whereas flexible peers mitigate exposure through lighter gram-weight per unit. Glass and metal replacements remain niche, limited to beverages and canned foods. Tray makers preserve relevance in food-service channels where oven-safe or microwave-ready features command price premium. Overall, flexibles' dual leadership in volume and growth cements their central role in driving the plastic packaging market over the forecast horizon.
Although polyethylene held 41.85% plastic packaging market share in 2025, polypropylene's superior 5.55% CAGR positions it as the fastest-advancing resin family. PP's higher heat resistance, improved clarity, and better seal integrity facilitate mono-material solutions that meet recyclability mandates while safeguarding food safety. PET protects its beverage stronghold owing to established bottle-to-bottle recycling loops, yet mechanical-recycling limitations cap recycled content without costly chemical-recycling capacity additions. PVC, polystyrene, and other styrenics retreat under stricter environmental rules and brand-owner deselection, opening space for bio-based and specialty co-polymer niches.
Chemical-recycling economics further favor resins with stable depolymerization pathways; hence PET and PP attract greater capex, while PS and PVC projects struggle to clear investment hurdles. Resin suppliers differentiate through application engineering teams that guide converters during material transitions, a service highly prized amid evolving EPR frameworks and FDA food-contact rules.
The Plastic Packaging Market Report is Segmented by Packaging Type (Rigid Packaging Type, Flexible Packaging Type), Material (Polyethylene, PET, Polypropylene, Polystyrene and EPS, PVC, Others), End-User Industry (Food, Beverage, Healthcare and Pharmaceuticals, and More), Distribution Channel (Direct Sales, Indirect Sales), and Geography. The Market Forecasts are Provided in Terms of Value (USD).
Geography Analysis
Asia-Pacific controlled 40.80% of global revenue in 2025 and is expanding at 6.78% CAGR, making it the undisputed engine of plastic packaging market growth. China accounts for the lion's share, though stricter waste-import rules and carbon-neutrality pledges compel local producers to invest in recycling capacity. India, Vietnam, and Indonesia record double-digit volume gains as organized retail and e-commerce penetration deepens. Currency volatility and geopolitics prompt multinational brand owners to diversify sourcing into ASEAN nations, reducing overreliance on any single country.
North America manifests steady mid-single-digit expansion underpinned by pharmaceutical demand, fresh-produce logistics, and the build-out of advanced-recycling hubs. State-level plastic-waste legislation adds complexity, yet it simultaneously opens opportunities for recycled and mono-material innovators. Canada's forthcoming nationwide EPR framework accelerates shift toward recyclable packs, encouraging cross-border partnerships.
Europe, the epicenter of EPR and tethered-cap mandates, experiences modest value growth but exerts outsized influence on global design standards. High labor and energy costs incentivize process automation and resin lightweighting, while regulators push recycled-content thresholds that drive chemical-recycling investments. Eastern European converters attract reshoring projects as brands seek regional proximity without Western Europe's cost base, spurring capital inflows into Poland and Hungary.
Latin America and the Middle East & Africa trail in share but register pockets of rapid expansion. Brazil benefits from agrifood exports that require barrier packaging, whereas GCC nations leverage petrochemical integration to export competitively priced resin. African markets begin to legislate single-use bans, creating fertile terrain for flexible producers that can deliver low-gram-weight, high-barrier solutions at affordable price points.
- Amcor PLC
- Mondi PLC
- Sealed Air Corporation
- ALPLA Group
- International Paper
- Pact Group
- Plastipak Holdings Inc.
- Huhtamaki Oyj
- UFlex Limited
- Constantia Flexibles
- Tetra Pak International SA
- Novolex
- Anchor Packaging LLC
- Liquibox (Olympus Partners)
- Quadpack Industries SA
- Dart Container Corporation
- American Packaging Corporation
- Printpack Inc.
- Winpak Ltd.
- Sigma Plastics Group
- Sonoco Products Company
- Transcontinental Inc.
- Greif, Inc.
- Coveris Group
- Nampak Ltd.
Additional Benefits:
- The market estimate (ME) sheet in Excel format
- 3 months of analyst support
TABLE OF CONTENTS
1 INTRODUCTION
- 1.1 Study Assumptions and Market Definition
- 1.2 Scope of the Study
2 RESEARCH METHODOLOGY
3 EXECUTIVE SUMMARY
4 MARKET LANDSCAPE
- 4.1 Market Overview
- 4.2 Market Drivers
- 4.2.1 E-commerce boom demanding durable last-mile packs
- 4.2.2 Surge in convenience-food and beverage consumption
- 4.2.3 Cost-competitive performance versus alternate substrates
- 4.2.4 Expansion of chemical-recycling infrastructure
- 4.2.5 Shift to mono-material films for EPR compliance
- 4.2.6 EU tethered-cap rule driving specialty closures volume
- 4.3 Market Restraints
- 4.3.1 Global single-use plastic bans and taxes
- 4.3.2 Volatile petro-feedstock prices
- 4.3.3 Brand owners pivoting to paper-based flexibles
- 4.3.4 Refill/reuse models cannibalising volume growth
- 4.4 Supply-Chain Analysis
- 4.5 Regulatory Outlook
- 4.6 Technological Outlook
- 4.7 Porter's Five Forces Analysis
- 4.7.1 Threat of New Entrants
- 4.7.2 Bargaining Power of Buyers/Consumers
- 4.7.3 Bargaining Power of Suppliers
- 4.7.4 Threat of Substitutes
- 4.7.5 Intensity of Competitive Rivalry
- 4.8 Investment Analysis
5 MARKET SIZE AND GROWTH FORECASTS (VALUE)
- 5.1 By Packaging Type
- 5.1.1 Rigid Packaging Type
- 5.1.1.1 Bottles and Jars
- 5.1.1.2 Caps and Closures
- 5.1.1.3 Trays and Containers
- 5.1.1.4 Other Product Types
- 5.1.2 Flexible Packaging Type
- 5.1.2.1 Pouches and Bags
- 5.1.2.2 Films and Wraps
- 5.1.2.3 Other Product Types
- 5.1.1 Rigid Packaging Type
- 5.2 By Material
- 5.2.1 Polyethylene (HDPE, LDPE, LLDPE)
- 5.2.2 Polyethylene Terephthalate (PET)
- 5.2.3 Polypropylene (PP)
- 5.2.4 Polystyrene and EPS
- 5.2.5 Polyvinyl Chloride (PVC)
- 5.2.6 Others (EVOH, Bioplastics, etc.)
- 5.3 By End-user Industry
- 5.3.1 Food
- 5.3.2 Beverage
- 5.3.3 Healthcare and Pharmaceuticals
- 5.3.4 Cosmetics and Personal Care
- 5.3.5 Other End-user Industry
- 5.4 By Distribution Channel
- 5.4.1 Direct Sales
- 5.4.2 Indirect Sales
- 5.5 By Geography
- 5.5.1 North America
- 5.5.1.1 United States
- 5.5.1.2 Canada
- 5.5.1.3 Mexico
- 5.5.2 Europe
- 5.5.2.1 Germany
- 5.5.2.2 United Kingdom
- 5.5.2.3 France
- 5.5.2.4 Italy
- 5.5.2.5 Spain
- 5.5.2.6 Russia
- 5.5.2.7 Rest of Europe
- 5.5.3 Asia-Pacific
- 5.5.3.1 China
- 5.5.3.2 India
- 5.5.3.3 Japan
- 5.5.3.4 South Korea
- 5.5.3.5 Australia and New Zealand
- 5.5.3.6 Rest of Asia-Pacific
- 5.5.4 Middle East and Africa
- 5.5.4.1 Middle East
- 5.5.4.1.1 United Arab Emirates
- 5.5.4.1.2 Saudi Arabia
- 5.5.4.1.3 Turkey
- 5.5.4.1.4 Rest of Middle East
- 5.5.4.2 Africa
- 5.5.4.2.1 South Africa
- 5.5.4.2.2 Nigeria
- 5.5.4.2.3 Egypt
- 5.5.4.2.4 Rest of Africa
- 5.5.4.1 Middle East
- 5.5.5 South America
- 5.5.5.1 Brazil
- 5.5.5.2 Argentina
- 5.5.5.3 Rest of South America
- 5.5.1 North America
6 COMPETITIVE LANDSCAPE
- 6.1 Market Concentration
- 6.2 Strategic Moves
- 6.3 Market Share Analysis
- 6.4 Company Profiles (includes Global level Overview, Market level overview, Core Segments, Financials as available, Strategic Information, Market Rank/Share for key companies, Products and Services, and Recent Developments)
- 6.4.1 Amcor PLC
- 6.4.2 Mondi PLC
- 6.4.3 Sealed Air Corporation
- 6.4.4 ALPLA Group
- 6.4.5 International Paper
- 6.4.6 Pact Group
- 6.4.7 Plastipak Holdings Inc.
- 6.4.8 Huhtamaki Oyj
- 6.4.9 UFlex Limited
- 6.4.10 Constantia Flexibles
- 6.4.11 Tetra Pak International SA
- 6.4.12 Novolex
- 6.4.13 Anchor Packaging LLC
- 6.4.14 Liquibox (Olympus Partners)
- 6.4.15 Quadpack Industries SA
- 6.4.16 Dart Container Corporation
- 6.4.17 American Packaging Corporation
- 6.4.18 Printpack Inc.
- 6.4.19 Winpak Ltd.
- 6.4.20 Sigma Plastics Group
- 6.4.21 Sonoco Products Company
- 6.4.22 Transcontinental Inc.
- 6.4.23 Greif, Inc.
- 6.4.24 Coveris Group
- 6.4.25 Nampak Ltd.
7 MARKET OPPORTUNITIES AND FUTURE OUTLOOK
- 7.1 White-space and Unmet-need Assessment
 塑膠包裝市場:2026-2032年全球市場預測(按包裝類型、包裝材料、製造技術、包裝形式和最終用途行業分類)
 PCR塑膠包裝市場:商業機會、成長要素、產業趨勢分析及2026-2035年預測
 醫療設備和植入用高純度塑膠市場規模、佔有率和成長分析:按產品、應用和地區分類-產業預測(2026-2033 年)
 塑膠包裝市場規模、佔有率和趨勢分析報告:按材料、產品、技術、應用、地區和細分市場分類(2026-2033 年)
 散裝聚苯乙烯包裝市場:按應用和地區分類
 塑膠包裝市場分析及預測(至2035年):依類型、產品類型、應用、材料類型、技術、最終用戶、功能及工藝分類
 再生塑膠包裝市場規模、佔有率、成長及全球產業分析:按類型、應用和地區分類,並提供2026-2034年的洞察和預測
 德國塑膠包裝市場:市場佔有率分析、產業趨勢與統計、成長預測(2026-2031)
 全球PCR塑膠包裝市場:按材料、產品、最終用戶和地區分類-市場規模、產業趨勢、機會分析和未來預測(2026-2035年)
 2026年全球PCR塑膠包裝市場報告