


 |
市場調查報告書
商品編碼
1907292
工業包裝:市場佔有率分析、產業趨勢與統計、成長預測(2026-2031)Industrial Packaging - Market Share Analysis, Industry Trends & Statistics, Growth Forecasts (2026 - 2031) |
||||||
※ 本網頁內容可能與最新版本有所差異。詳細情況請與我們聯繫。
預計到 2026 年,工業包裝市場價值將達到 745.1 億美元,高於 2025 年的 709.9 億美元。
預計到 2031 年,市場規模將達到 949.3 億美元,2026 年至 2031 年的複合年成長率為 4.96%。
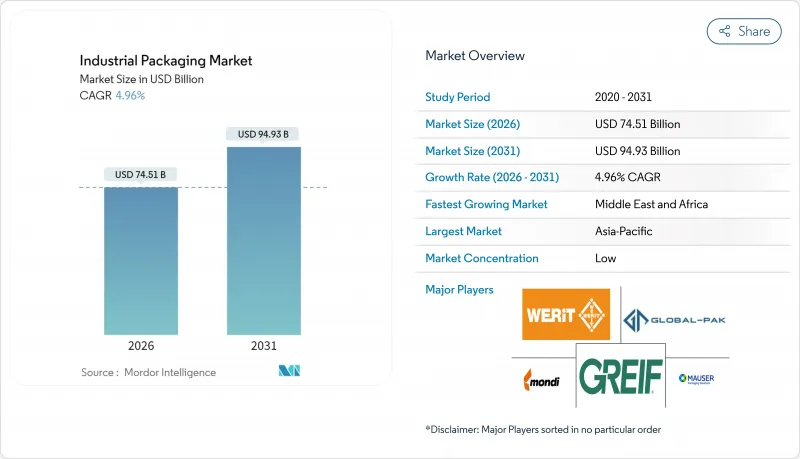
需求韌性反映了履約的擴張、現場包裝自動化程度的加速提升,以及日益嚴格的法規結構,這些因素正在影響整個製造業的材料選擇和營運重點。電子商務物流需要能夠承受多次配送且體積重量較小的保護性包裝,而自動化投資則有助於生產商在勞動力人手不足的市場中減少對勞動力的依賴。亞太地區在2024年將佔全球收入的40.45%,這主要得益於該地區高度集中的出口導向製造業。同時,中東和非洲地區將成為成長最快的地區,到2030年將以6.34%的複合年成長率成長,這主要得益於對能源、基礎設施和食品加工領域的投資計畫。
全球工業包裝市場趨勢與洞察
永續和可再生材料的興起
在工業採購中,再生材料含量要求和企業永續性目標正成為採購標準的核心。歐盟規定,到2030年,塑膠製品必須含有30%的再生材料,迫使加工商重新評估其原料來源。纖維素複合材料具有食品和製藥應用所需的強度和防潮性,並符合ISO 14855生物分解標準。輝瑞公司透過將包裝改為可回收形式,在遵守FDA 21 CFR 211無菌法規的前提下,減少了25%的包裝廢棄物。生產商透過投資生物基塗料來取代PFAS,從而規避樹脂價格波動風險,同時遵守新的禁令。隨著研發投入的增加,早期採用者正在獲得成本和合規優勢,並提高客戶維繫。
不斷擴大的電子商務和跨境貿易流量
2024年,美國電子商務銷售額將達到1.14兆美元,佔零售總額的16.4%。多次搬運的小包裹需要緩衝保護和高效的體積重量設計。日處理量超過2,000件的物流中心擴大使用機器人進行包裝,機器人包裝準確率高達99.5%,並可降低40%的人事費用。特斯拉在實施自適應包裝系統後,材料用量減少了18%。日益複雜的藥品監管正在推動藥品包裝轉向符合跨市場ICH通訊協定規範的標準化全球格式。
樹脂和鋼材價格波動
2024年,鋼材價格維持在每噸650-850美元的區間,給簽訂長期合約的鋼桶製造商帶來壓力。聚乙烯和聚丙烯價格波動15-20%,由於原物料成本佔總成本的60-70%,生產商必須自行承擔價格波動的影響。陶氏化學的供應商利潤率下降了12%。彈性價格設定和短期合約的使用正在增加,而重新談判的次數比2024年之前增加了25%,這給雙方關係帶來了壓力。
細分市場分析
預計到2031年,中型散貨箱將以6.98%的複合年成長率快速成長,這主要得益於氫氣計劃對350-700巴壓力下複合材料容器的需求。至2025年,桶裝容器將佔工業包裝市場的35.02%,並繼續保持其作為多用途化學品主要包裝容器的地位。
IBC(中型散裝容器)受惠於氫能中心70億美元的資金籌措,而鋼桶的需求則面臨原物料價格波動的挑戰,並享有聯合國認證的認可。軟性IBC符合ATEX標準,並採用防靜電材料製成,因此適用於爆炸性環境。
塑膠仍將保持其主導地位,2025年將佔據46.02%的市場佔有率,但面臨日益成長的監管壓力。隨著不含PFAS的阻隔塗層技術的成熟,紙張和紡織材料預計將以6.61%的複合年成長率成長。
根據 TAPPI 統計,阻隔性紙板產量增加了 25%,汽車製造商強制要求可回收塑膠容器含有 30% 的再生材料,先進的纖維素薄膜具有與聚乙烯相當的氧氣阻隔性能,從而擴大了紙張的用途。
區域分析
預計到2025年,亞太地區將佔全球收入的40.12%,這主要得益於出口主導製造業的發展以及國內包裝器材產量8.1%的成長。中東和非洲地區預計將引領區域成長,年複合成長率將達到6.18%,這主要得益於一項價值200億美元的石化計劃。
北美正受惠於近岸外包,墨西哥的出口額成長了 15%,達到 4,920 億美元,而歐洲正在加強其循環經濟通訊協定,優先考慮可回收形式。
沙烏地阿拉伯的產業政策正在推動對符合聯合國標準的大型桶和複合材料IBC貨櫃的需求。印度340億盧比(約4.08億美元)的食品加工投資正在推動紡織品二次包裝的發展。日本的化學品安全法規正在推動高阻隔多層包裝的轉變。阿拉伯聯合大公國的產業策略旨在將製造業佔GDP的比重提高到25%,從而刺激對區域托盤和貨櫃共享服務的需求。
非洲大陸自由貿易協定(AfCFTA)框架將促進區域內貿易,並為跨境部署標準化工業包裝市場解決方案鋪路。撒哈拉以南非洲的基礎建設將增加對水泥和化學品運輸用袋裝和桶裝包裝的需求。歐洲港口正在透過擴展電子資料交換(EDI)文件和採用國際標準散裝容器標籤來加快清關速度。
其他福利:
- Excel格式的市場預測(ME)表
- 3個月的分析師支持
目錄
第1章 引言
- 研究假設和市場定義
- 調查範圍
第2章調查方法
第3章執行摘要
第4章 市場情勢
- 市場概覽
- 市場促進因素
- 永續和可回收材料的興起
- 電子商務的擴張和跨境貿易的流動
- 食品級和藥品散裝物流的成長
- 現場包裝自動化實施狀態
- 可重複使用包裝池經營模式
- 氫氣供應鏈對複合材料IBC的需求
- 市場限制
- 樹脂和鋼材價格波動
- 加強全球環境法規
- 阻隔塗層中禁用 PFAS/微塑膠
- 近岸外包減少了長途運輸所需的包裝量。
- 產業價值鏈分析
- 監管環境
- 技術展望
- 波特五力分析
- 供應商的議價能力
- 買方的議價能力
- 新進入者的威脅
- 替代品的威脅
- 競爭對手之間的競爭
- 宏觀經濟因素如何影響市場
第5章 市場規模與成長預測
- 依產品
- 中型散貨箱(IBC)
- 鼓
- 薩克斯風
- 桶罐
- 其他產品
- 材料
- 塑膠
- 金屬
- 紙張和纖維基
- 其他成分
- 按最終用戶行業分類
- 化學品和製藥
- 食品/飲料
- 車
- 石油、天然氣和石化產品
- 建築/施工
- 其他終端用戶產業
- 按包裝容量
- 50公升或以下
- 51-500 L
- 501-1,000 L
- 1,001-2,000 L
- 超過2000公升
- 按地區
- 北美洲
- 美國
- 加拿大
- 墨西哥
- 南美洲
- 巴西
- 阿根廷
- 南美洲其他地區
- 歐洲
- 德國
- 英國
- 法國
- 西班牙
- 義大利
- 其他歐洲地區
- 亞太地區
- 中國
- 日本
- 印度
- 澳洲
- 韓國
- 亞太其他地區
- 中東和非洲
- 中東
- 沙烏地阿拉伯
- 阿拉伯聯合大公國
- 土耳其
- 其他中東地區
- 非洲
- 南非
- 肯亞
- 其他非洲地區
- 中東
- 北美洲
第6章 競爭情勢
- 市場集中度
- 策略趨勢
- 市佔率分析
- 公司簡介
- Greif, Inc.
- Mauser Packaging Solutions Holding Company
- Mondi plc
- Smurfit WestRock
- Amcor plc
- International Paper Company
- Packaging Corporation of America
- Schutz GmbH & Co. KGaA
- WERIT Kunststoffwerke W. Schneider GmbH & Co. KG
- Tank Holding Corp.
- Visy Industries Holdings Pty Ltd
- Pact Group Holdings Ltd
- Brambles Limited(CHEP)
- Global-Pak, Inc.
- Nefab AB
- Snyder Industries, LLC
- Myers Container, LLC
- Veritiv Corporation
- Snyder Industries, Inc.
- Pyramid Technoplast Ltd
第7章 市場機會與未來展望
Industrial packaging market size in 2026 is estimated at USD 74.51 billion, growing from 2025 value of USD 70.99 billion with 2031 projections showing USD 94.93 billion, growing at 4.96% CAGR over 2026-2031.
Demand resilience reflects the rise of e-commerce fulfillment, accelerating on-site packaging automation, and stricter regulatory frameworks that shape material choices and operational priorities across manufacturing sectors. E-commerce logistics require protective formats that survive multi-node shipping while keeping dimensional weight low, and automation investments help producers curb labor dependence amid tight labor markets. Asia-Pacific commanded 40.45% of 2024 revenue, supported by dense export-oriented manufacturing, while the Middle East and Africa are advancing the fastest at 6.34% CAGR to 2030 on the back of energy, infrastructure, and food processing investment pipelines.
Global Industrial Packaging Market Trends and Insights
Emergence of Sustainable and Recyclable Materials
Industrial buyers are making recycled-content mandates and corporate sustainability targets a central procurement criterion. The European Union requires 30% recycled content in plastic formats by 2030, compelling converters to overhaul feedstock sourcing. Cellulose-based composites deliver strength and moisture resistance suitable for food and pharma usage and meet ISO 14855 biodegradability thresholds. Pfizer's internal switch to recyclable formats cut packaging waste 25% yet complied with FDA 21 CFR 211 sterility rules. Producers hedge resin volatility by investing in bio-based coatings that replace PFAS while complying with emerging bans. As R&D scales, early adopters gain cost and compliance advantages that enhance customer retention.
Expansion of E-commerce and Cross-Border Trade Flows
E-commerce revenue in the United States hit USD 1.14 trillion in 2024, or 16.4% of retail sales. Multihandled parcels need cushioning and dimensional-weight efficient designs. Facilities shipping more than 2,000 orders per day are increasingly deploying robotics able to pack with 99.5% accuracy and cut labor costs by 40%. Tesla demonstrated an 18% materials drop after installing adaptive packaging systems. Regulatory complexity in pharmaceuticals pushes shippers toward standardized global formats that meet ICH labeling protocols across markets.
Volatile Resin and Steel Prices
Steel ranged from USD 650-850 / t in 2024, squeezing drum makers under long-term contracts. Polyethylene and polypropylene fluctuated 15-20%, with producers absorbing hits because raw inputs form 60-70% of cost. Dow's suppliers suffered 12% margin erosion. Flexible pricing and shorter contracts proliferate, yet renegotiations rose 25% over pre-2024 levels, straining relationships.
Other drivers and restraints analyzed in the detailed report include:
- Growth in Food-Grade and Pharma Bulk Logistics
- On-Site Packaging Automation Adoption
- PFAS / Micro-Plastic Bans on Barrier Coatings
For complete list of drivers and restraints, kindly check the Table Of Contents.
Segment Analysis
Intermediate bulk containers own the fastest 6.98% CAGR to 2031, propelled by hydrogen projects that require 350-700-bar composite vessels. Drums held 35.02% industrial packaging market share in 2025 and remain the backbone for multipurpose chemicals.
IBCs benefit from USD 7 billion in hydrogen hub funding, while steel drum demand faces raw-material swings yet enjoys entrenched UN certification familiarity. Flexible intermediate bulk containers adopt antistatic fabrics compliant with ATEX to serve explosive-atmosphere sectors.
Plastic dominated with 46.02% share in 2025 but faces mounting regulatory scrutiny. Paper and fiber options are set for a 6.61% CAGR as PFAS-free barrier coatings mature.
TAPPI measured 25% growth in barrier paperboard output, and automakers now mandate 30% recycled content in plastic returnable bins. Advanced cellulose films match oxygen barrier performance seen in polyethylene, enlarging paper's addressable use cases.
The Industrial Packaging Market Report is Segmented by Product (Intermediate Bulk Containers, Drums, Sacks, and More), Material (Plastics, Metal, Paper and Fiber-Based, and More), End-User Industry (Chemicals and Pharmaceuticals, Food and Beverage, Automotive, Oil Gas and Petrochemicals, and More), Packaging Capacity (<=50L, 51-500L, 501-1000L, and More), and Geography. The Market Forecasts are Provided in Terms of Value (USD).
Geography Analysis
Asia-Pacific supplied 40.12% of 2025 revenue thanks to export-heavy manufacturing and 8.1% growth in domestic packaging machinery output. Middle East and Africa will top regional growth charts at 6.18% CAGR, aided by USD 20 billion in petrochemical projects.
North America benefits from near-shoring as Mexico's exports rose 15% to USD 492 billion. Europe tightens circular-economy protocols that favor recyclable formats.
Saudi industrial policies drive demand for heavy-duty drums and composite IBCs meeting UN specs. India's food-processing investments worth INR 3,400 crore (USD 408 million) encourage fiber-based secondary packaging. Japanese chemical safety rules inspire high-barrier multilayer upgrades. The UAE's industrial strategy targets 25% manufacturing GDP share, stimulating regional pallet and container pools.
Africa's AfCFTA framework fosters intra-continental trade, opening gateways for standardized industrial packaging market solutions across borders. Sub-Saharan infrastructure work advances demand for large sacks and drums to move cement and chemicals. European ports expand EDI documentation to accelerate customs clearance, prompting adoption of globally harmonized labeling on bulk containers.
- Greif, Inc.
- Mauser Packaging Solutions Holding Company
- Mondi plc
- Smurfit WestRock
- Amcor plc
- International Paper Company
- Packaging Corporation of America
- Schutz GmbH & Co. KGaA
- WERIT Kunststoffwerke W. Schneider GmbH & Co. KG
- Tank Holding Corp.
- Visy Industries Holdings Pty Ltd
- Pact Group Holdings Ltd
- Brambles Limited (CHEP)
- Global-Pak, Inc.
- Nefab AB
- Snyder Industries, LLC
- Myers Container, LLC
- Veritiv Corporation
- Snyder Industries, Inc.
- Pyramid Technoplast Ltd
Additional Benefits:
- The market estimate (ME) sheet in Excel format
- 3 months of analyst support
TABLE OF CONTENTS
1 INTRODUCTION
- 1.1 Study Assumptions and Market Definition
- 1.2 Scope of the Study
2 RESEARCH METHODOLOGY
3 EXECUTIVE SUMMARY
4 MARKET LANDSCAPE
- 4.1 Market Overview
- 4.2 Market Drivers
- 4.2.1 Emergence of sustainable and recyclable materials
- 4.2.2 Expansion of e-commerce and cross-border trade flows
- 4.2.3 Growth in food-grade and pharma bulk logistics
- 4.2.4 On-site packaging automation adoption
- 4.2.5 Reusable packaging pool business models
- 4.2.6 Hydrogen-supply chain demand for composite IBCs
- 4.3 Market Restraints
- 4.3.1 Volatile resin and steel prices
- 4.3.2 Tightening global environmental regulations
- 4.3.3 PFAS / micro-plastic bans on barrier coatings
- 4.3.4 Near-shoring lowering long-haul packaging volumes
- 4.4 Industry Value Chain Analysis
- 4.5 Regulatory Landscape
- 4.6 Technological Outlook
- 4.7 Porter's Five Forces Analysis
- 4.7.1 Bargaining Power of Suppliers
- 4.7.2 Bargaining Power of Buyers
- 4.7.3 Threat of New Entrants
- 4.7.4 Threat of Substitutes
- 4.7.5 Intensity of Competitive Rivalry
- 4.8 The Impact of Macroeconomic Factors on the Market
5 MARKET SIZE AND GROWTH FORECASTS (VALUE)
- 5.1 By Product
- 5.1.1 Intermediate Bulk Containers (IBCs)
- 5.1.2 Drums
- 5.1.3 Sacks
- 5.1.4 Pails
- 5.1.5 Other Products
- 5.2 By Material
- 5.2.1 Plastics
- 5.2.2 Metal
- 5.2.3 Paper and Fiber-based
- 5.2.4 Other Materials
- 5.3 By End-user Industry
- 5.3.1 Chemicals and Pharmaceuticals
- 5.3.2 Food and Beverage
- 5.3.3 Automotive
- 5.3.4 Oil, Gas and Petrochemicals
- 5.3.5 Building and Construction
- 5.3.6 Other End-user Industries
- 5.4 By Packaging Capacity
- 5.4.1 <= 50 L
- 5.4.2 51 - 500 L
- 5.4.3 501 - 1,000 L
- 5.4.4 1,001 - 2,000 L
- 5.4.5 > 2,000 L
- 5.5 By Geography
- 5.5.1 North America
- 5.5.1.1 United States
- 5.5.1.2 Canada
- 5.5.1.3 Mexico
- 5.5.2 South America
- 5.5.2.1 Brazil
- 5.5.2.2 Argentina
- 5.5.2.3 Rest of South America
- 5.5.3 Europe
- 5.5.3.1 Germany
- 5.5.3.2 United Kingdom
- 5.5.3.3 France
- 5.5.3.4 Spain
- 5.5.3.5 Italy
- 5.5.3.6 Rest of Europe
- 5.5.4 Asia-Pacific
- 5.5.4.1 China
- 5.5.4.2 Japan
- 5.5.4.3 India
- 5.5.4.4 Australia
- 5.5.4.5 South Korea
- 5.5.4.6 Rest of Asia-Pacific
- 5.5.5 Middle East and Africa
- 5.5.5.1 Middle East
- 5.5.5.1.1 Saudi Arabia
- 5.5.5.1.2 United Arab Emirates
- 5.5.5.1.3 Turkey
- 5.5.5.1.4 Rest of Middle East
- 5.5.5.2 Africa
- 5.5.5.2.1 South Africa
- 5.5.5.2.2 Kenya
- 5.5.5.2.3 Rest of Africa
- 5.5.5.1 Middle East
- 5.5.1 North America
6 COMPETITIVE LANDSCAPE
- 6.1 Market Concentration
- 6.2 Strategic Moves
- 6.3 Market Share Analysis
- 6.4 Company Profiles (includes Global level Overview, Market level overview, Core Segments, Financials as available, Strategic Information, Market Rank/Share for key companies, Products and Services, and Recent Developments)
- 6.4.1 Greif, Inc.
- 6.4.2 Mauser Packaging Solutions Holding Company
- 6.4.3 Mondi plc
- 6.4.4 Smurfit WestRock
- 6.4.5 Amcor plc
- 6.4.6 International Paper Company
- 6.4.7 Packaging Corporation of America
- 6.4.8 Schutz GmbH & Co. KGaA
- 6.4.9 WERIT Kunststoffwerke W. Schneider GmbH & Co. KG
- 6.4.10 Tank Holding Corp.
- 6.4.11 Visy Industries Holdings Pty Ltd
- 6.4.12 Pact Group Holdings Ltd
- 6.4.13 Brambles Limited (CHEP)
- 6.4.14 Global-Pak, Inc.
- 6.4.15 Nefab AB
- 6.4.16 Snyder Industries, LLC
- 6.4.17 Myers Container, LLC
- 6.4.18 Veritiv Corporation
- 6.4.19 Snyder Industries, Inc.
- 6.4.20 Pyramid Technoplast Ltd
7 MARKET OPPORTUNITIES AND FUTURE OUTLOOK
- 7.1 White-space and Unmet-need Assessment
 工業包裝市場:依材料、包裝類型、技術、應用、最終用途產業和分銷管道分類-2026-2032年全球市場預測
 工業真菌包裝市場預測至2034年:按產品、基材來源、製造流程、最終用戶、分銷管道和地區分類的全球分析
 工業包裝市場分析及預測(至2035年):依類型、產品類型、服務、技術、材料類型、應用、製程、最終用戶、功能分類
 2026年全球工業包裝市場報告
 工業包裝市場規模、佔有率和趨勢分析報告:按材料、產品、最終用途、地區和細分市場預測(2026-2033 年)
 印尼工業包裝:市場佔有率分析、產業趨勢與統計、成長預測(2026-2031)
 日本工業包裝市場報告:按產品、材料、應用和地區分類(2026-2034年)全球桶裝包裝市場:預測至2032年-按材料類型、桶型、容量、服務類型、最終用戶和地區分類的分析
 工業包裝市場:2025-2030年未來預測
 工業包裝市場:依產品類型、材料類型、類別、應用和地區