


 |
市場調查報告書
商品編碼
1907240
分散式控制系統:市場佔有率分析、產業趨勢與統計、成長預測(2026-2031)Distributed Control Systems - Market Share Analysis, Industry Trends & Statistics, Growth Forecasts (2026 - 2031) |
||||||
※ 本網頁內容可能與最新版本有所差異。詳細情況請與我們聯繫。
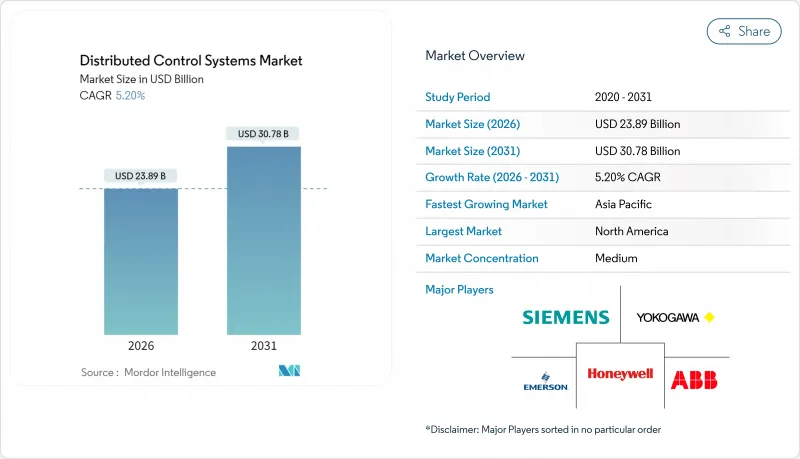
預計到 2025 年,分散式控制系統市場規模將達到 227.1 億美元,從 2026 年的 238.9 億美元成長到 2031 年的 307.8 億美元,在預測期(2026-2031 年)內,複合年成長率將達到 5.20%。
綠氫能的日益普及、碳捕獲計劃的推進、核能發電的增加以及製藥業向連續生產模式的轉變,共同推動了產業成長。供應商正積極拓展軟體定義架構、數位雙胞胎整合和邊緣連接,以提升營運效益;同時,小規模的工廠則採用精簡平台以降低准入門檻。日益成長的網路安全需求、認證工程師的短缺以及持續存在的半導體供應限制,雖然減緩了擴張速度,但並未抑製成長。競爭的焦點集中在預測性維護、模組化部署和訂閱授權模式等方面,以分散資本支出。
全球分散式控制系統市場趨勢與洞察
能源轉型推動了綠色氫能和碳捕獲、利用與封存(CCUS)設施對分散式控制系統(DCS)的需求。
預計到2024年,綠色氫氣產能將達到1,640萬噸,每座新建廠都將部署價值200萬至1,000萬美元的先進控制平台。分散式控制系統(DCS)架構必須足夠柔軟性,以應對間歇性可再生能源,確保氫氣安全,並適應電解槽效率的快速提升-預計五年內將提升20%至30%。供應商正在打包模組化控制節點,這些節點可根據工廠發展階段進行擴展,使營運商無需拆除更換即可進行升級。歐洲和中東地區在部署方面處於領先地位,但北美開發商也在迅速發布與《通貨膨脹控制法案》(IRA)激勵措施相關的詢價單。長期投資前景已催生出一批穩定的分散式控制系統市場計劃,其發展週期將遠超過2030年。
核能和小型模組化反應器計劃需要具備網路安全措施的安全級分散式控制系統 (DCS)
監管機構現在要求所有新核子反應爐都必須配備空氣間隙、安全等級符合標準的分散式控制系統(DCS)以及經過認證的冗餘系統。美國美國核能管理委員會(NRC)於2025年收緊了網路安全法規,這增加了合規成本,但也鎖定了合規平台的溢價。小型模組化反應器(SMR)供應商正在縮短實體佈線距離、加快建造進度,並指定數位安全通道以支援遠距離診斷。歐洲和中國正在採用類似的框架進行標準化,而海灣國家則正在增加核子反應爐機組以實現海水淡化廠的脫碳。長達18個月或更久的認證週期阻礙了新進者,並鞏固了現有供應商在分散式控制系統市場的地位。
與現代PLC/SCADA替代方案相比,初始資本支出較高
開放式流程自動化試點部署已證明,與傳統分散式控制系統(DCS)相比,成本可節省 52%,這使其成為謹慎控制資本支出的中小型營運商的理想選擇。供應商正透過訂閱許可、靈活的 I/O 和預製庫來減少硬體需求,以應對這項挑戰。然而,高昂的價格引發的擔憂導致東協、拉丁美洲和非洲部分地區的計劃延期,使分散式控制系統市場成長率下降了 0.8 個百分點。
細分市場分析
2025年,硬體在分散式控制系統市場中仍佔據54.35%的佔有率,這反映了終端用戶對經過現場驗證的控制器、通用I/O和冗餘網路的偏好。受能源和化學產業更新換代週期的推動,硬體分散式控制系統市場規模達123.4億美元。供應商現在提供的可配置I/O模組,可以在任何通道上接收類比、數位或HART訊號,從而減少高達30%的機櫃數量。通用卡還支援後期設計變更,這對於面臨工期緊張的EPC承包商來說極具吸引力。控制器平台能夠加快綠色氫能工廠中密集PID迴路的循環速度,並在可再生能源供電波動期間保持精度。
軟體收入雖然規模較小,但隨著營運商採用分析、虛擬化和OT-IT融合技術,正以每年7.55%的速度成長。嵌入歷史資料層的模型預測演算法能夠微調設定點,進而降低2-5%的能耗。虛擬化伺服器在單一虛擬機器管理程式上託管多個控制域,以便於容錯移轉和修補程式管理。服務組合也在不斷發展:艾默生的駐地工程師確保關鍵績效指標(KPI)的達成,而ABB的生命週期軟體計畫則整合了網路安全加固和警報簡化更新。這種轉變正在重塑整個分散式控制系統市場的價值獲取結構,將重點從資本財轉向經常性服務收入。
混合架構將集中式監控節點與分散式邊緣控制器結合,預計到2025年將佔據分散式控制系統市場45.40%的佔有率。工廠正在採用這種拓撲結構,以逐步遷移傳統的I/O,在保留現有佈線的同時,無需拆除和更換現有基礎設施即可添加新的分析功能。在典型的維修場景中,本地虛擬機器承載控制邏輯,而確定性乙太網路環連接現場模組,實現低於50微秒的低延遲。混合配置還簡化了網路安全區域分類,隔離安全迴路,同時允許透過安全代理進行資料存取。
全冗餘高可用性設計正以8.95%的複合年成長率快速成長,製藥、液化天然氣和核能等行業的終端用戶都要求零計劃外停機時間。冗餘設計涵蓋控制器、電源、開關,甚至包括GPS同步時間戳,以確保事件序列的準確性。西門子在奧迪生產線上展示了一種虛擬PLC,可在伺服器之間遷移工作負載,而不會中斷運動控制。雖然集中式控制器仍然用於渦輪島和間歇式消化器等優先考慮確定性循環而非柔軟性的裝置中,但隨著模組化數位化工廠在新資本投資中佔據主導地位,它們在分散式控制系統市場的佔有率正在下降。
分散式控制系統 (DCS) 市場報告從組件(硬體、軟體、服務)、最終用戶行業(發電、石油天然氣及其他)、架構(集中式控制器系統及其他)、部署模式(本地部署等)、工廠規模(小規模(小於 5000 個 I/O)等)和地區(北美、歐洲等)等方面對產業進行了分析。市場預測以美元計價。
區域分析
截至2025年,亞太地區將佔據分散式控制系統(DCS)市場37.60%的佔有率,這主要得益於中國強大的煉油和化工能力以及印度快速發展的基礎設施。區域供應商Supcon已贏得城市供水事業和中型化工廠項目,但全球巨頭仍主導著數十億美元的液化天然氣(LNG)和核能計劃。北京的智慧製造計畫正在資助將DCS數據與企業人工智慧(AI)連接起來的維修,從而推動了軟體需求。印度的生產關聯激勵(PLI)計畫正在幫助吸引製藥和電池工廠,這些工廠從一開始就指定使用模組化、擴充性的DCS。東南亞國家在軟性包裝生產線和生質柴油設施新增的推動下,維持著個位數的溫和成長。
中東地區以6.95%的複合年成長率成為成長最快的地區,這主要得益於沙烏地阿拉伯的「2030願景」。該願景旨在實現沙烏地阿拉伯40%電網的自動化,並建立綠色氫能產業叢集。海灣合作理事會(GCC)成員國已承諾投入3.1兆美元用於資本計劃,每個項目都從設計階段就融入了營運技術(OT)與資訊科技(IT)的整合。本地計劃正與跨國公司合作,以實現在在地採購生產,並拓展分散式控制系統市場的供應商生態系統。
北美正在對其老化的電力和化學基礎設施進行現代化改造,網路安全措施現已被納入能源部 (DOE) 和國防安全保障部 (DHS) 項目的資金籌措需求。 《通貨膨脹控制法案》(IRA) 促進了二氧化碳捕集技術和無污染燃料激勵措施的應用,並在重工業中廣泛採用分散式控制系統 (DCS)。歐洲優先考慮永續性,加工廠部署了先進的分析技術以降低能耗並達到「Fit for 55」目標。南美洲正在投資銅和鋰礦開採,並在偏遠地區採用邊緣連接控制系統,而非洲則在當地可再生能源併入海水淡化和電網升級的推動下,實現了兩位數的需求成長。
其他福利:
- Excel格式的市場預測(ME)表
- 3個月的分析師支持
目錄
第1章 引言
- 研究假設和市場定義
- 調查範圍
第2章調查方法
第3章執行摘要
第4章 市場情勢
- 市場概覽
- 市場促進因素
- 能源轉型推動了綠色氫能和碳捕獲、利用與封存(CCUS)設施對分散式控制系統(DCS)的需求。
- 核能和小型模組化反應器 (SMR)計劃需要具備網路安全措施的安全級分散式控制系統 (DCS)。
- 海上浮式液化天然氣(LNG)裝置日益複雜,推動了高可靠性分散式控制系統(DCS)的應用。
- 製藥業連續生產的興起正在推動模組化批次分散式控制系統(DCS)的應用。
- 數位雙胞胎整合DCS用於現有設施的預測性維護
- 採礦業遠端營運中心的興起推動了邊緣連接的分散式控制系統的發展。
- 市場限制
- 初始投資額高 / 與現代PLC/SCADA替代技術相比
- DCS認證工程師和全生命週期服務人員短缺
- 高效能控制器硬體所需的半導體供不應求
- 網路安全認證和合規週期過長
- 價值/供應鏈分析
- 監管或技術環境
- 波特五力分析
- 新進入者的威脅
- 買方的議價能力
- 供應商的議價能力
- 替代品的威脅
- 競爭對手之間的競爭
- 產業產能和投資趨勢
第5章 市場規模與成長預測
- 按組件
- 硬體
- 軟體
- 服務
- 建築設計
- 集中控制系統
- 混合/分散式混合系統
- 全冗餘高可用性系統
- 按部署模式
- 本地部署
- 雲端/邊緣託管
- 按行業
- 發電
- 火力發電廠
- 可再生能源和電池儲能電站
- 核能發電廠
- 石油和天然氣
- 上游
- 中產階級
- 下游和煉油廠
- 化學品和石油化工
- 採礦和金屬
- 紙漿和造紙
- 製藥和生命科學
- 食品/飲料
- 供水和污水處理
- 其他行業
- 發電
- 按工廠規模(控制器 I/O)
- 小規模(超過 5,000 個 I/O)
- 中等規模(5,000-15,000 I/O)
- 大型(I/O少於15,000)
- 按地區
- 北美洲
- 美國
- 加拿大
- 加勒比海
- 南美洲
- 巴西
- 阿根廷
- 其他南美洲
- 歐洲
- 德國
- 英國
- 法國
- 義大利
- 北歐國家
- 其他歐洲地區
- 中東
- 阿拉伯聯合大公國
- 沙烏地阿拉伯
- 卡達
- 其他中東地區
- 非洲
- 南非
- 奈及利亞
- 其他非洲地區
- 亞太地區
- 中國
- 日本
- 印度
- 韓國
- ASEAN
- 亞太其他地區
- 北美洲
第6章 競爭情勢
- 市場集中度
- 策略趨勢
- 市佔率分析
- 公司簡介
- ABB Ltd.
- Emerson Electric Co.
- Honeywell International Inc.
- Siemens AG
- Yokogawa Electric Corporation
- Schneider Electric SE
- Mitsubishi Electric Corporation
- Rockwell Automation, Inc.
- Valmet Oyj
- Azbil Corporation
- Omron Corporation
- Novatech LLC
- Toshiba Corporation
- Hitachi, Ltd.
- GE Digital(General Electric Co.)
- Fuji Electric Co., Ltd.
- Supcon Technology Co., Ltd.
- Hollysys Automation Technologies Ltd.
- Endress+Hauser Group Services AG
- BandR Industrial Automation GmbH
第7章 市場機會與未來展望
The distributed control systems market was valued at USD 22.71 billion in 2025 and estimated to grow from USD 23.89 billion in 2026 to reach USD 30.78 billion by 2031, at a CAGR of 5.20% during the forecast period (2026-2031).
The green-hydrogen build-out, carbon-capture projects, nuclear power additions, and the pharmaceutical shift to continuous production anchor growth. Vendors are expanding software-defined architectures, digital-twin integration, and edge connectivity to unlock operational gains, while small plants adopt scaled-down platforms that lower entry costs. Rising cybersecurity requirements, shortages of certified engineers, and residual semiconductor constraints temper the pace but do not derail the expansion. Competitive momentum centers on predictive maintenance, modular deployment, and subscription licensing that spread capital outlays.
Global Distributed Control Systems Market Trends and Insights
Energy Transition Drives DCS Demand in Green Hydrogen and CCUS Facilities
Green-hydrogen capacity announcements reached 16.4 million tons in 2024 and each new plant installs sophisticated control platforms valued at USD 2-10 million. DCS architectures must handle intermittent renewable power, ensure hydrogen safety, and flex for rapid electrolyzer efficiency gains forecast at 20-30% within five years. Vendors are packaging modular control nodes that scale with plant phases, letting operators upgrade without wholesale rip-and-replace. Europe and the Middle East lead early adoption, but North American developers are quickly issuing RFQs tied to Inflation Reduction Act incentives. The long investment horizon underpins a stable pipeline of distributed control systems market projects well beyond 2030.
Nuclear and SMR Projects Requiring Cyber-secure Safety-Classified DCS
Regulators now demand air-gapped, safety-class DCS with certified redundancy for every new reactor. The U.S. Nuclear Regulatory Commission tightened cyber rules in 2025, raising qualification costs but also locking in premium pricing for compliant platforms. SMR vendors specify digital safety channels that shorten physical wiring runs, cut construction schedules, and support remote diagnostics. Europe and China are standardizing on similar frameworks, while Gulf countries add nuclear units to decarbonize desalination. Certification cycles that run 18 months or more keep new entrants out and reinforce the position of incumbent suppliers in the distributed control systems market.
High Up-front CAPEX versus Modern PLC/SCADA Alternatives
Open process automation pilots show 52% cost savings over classic DCS builds, tempting small and mid-tier operators that weigh every capital dollar Vendors counter with subscription licenses, flexible I/O, and pre-engineered libraries that trim hardware counts. Yet sticker shock still postpones projects in ASEAN, Latin America, and parts of Africa, shaving 0.8 percentage points off distributed control systems market growth.
Other drivers and restraints analyzed in the detailed report include:
- Offshore Floating LNG Complexity Elevates High-Reliability DCS Adoption
- Pharma Continuous Manufacturing Spurs Modular Batch DCS Installations
- Scarcity of DCS-Certified Engineers and Lifecycle Service Staff
For complete list of drivers and restraints, kindly check the Table Of Contents.
Segment Analysis
Hardware retained a 54.35% distributed control systems market share in 2025, reflecting end-user preference for field-proven controllers, universal I/O, and redundant networks. The distributed control systems market size for hardware hit USD 12.34 billion, buoyed by replacement cycles in energy and chemicals. Vendors now ship configurable I/O slices that accept analog, digital, or HART signals on any channel, cutting cabinet counts by up to 30%. Universal cards also support late-stage design changes, a compelling feature for EPC contractors facing tight schedules. Controller platforms add fast cycle times for high-density PID loops in green hydrogen plants, safeguarding accuracy when power supply fluctuates with renewables.
Software revenue, though smaller, is rising 7.55% per year as operators embrace analytics, virtualization, and OT-IT convergence. Model-predictive algorithms embedded in historian layers fine-tune setpoints and shave energy consumption 2-5%. Virtualized servers host multiple control domains on a single hypervisor, easing failover and patch management. Service portfolios evolve as well: Emerson's factory resident engineers guarantee KPIs, while ABB's lifecycle software plans bundle cyber hardening and alarm-rationalization updates. This pivot reshapes value capture across the distributed control systems market, shifting focus from capital goods to recurring service streams.
Hybrid architectures blended centralized supervisory nodes with distributed edge controllers to secure 45.40% of the distributed control systems market size in 2025. Plants adopt this topology to migrate legacy I/O in phases, preserve wiring, and layer new analytics without wholesale rip-and-replace. In a typical retrofit, on-premise virtual machines host logic while deterministic Ethernet rings connect field modules, yielding latency under 50 microseconds. Hybrid layouts also simplify cybersecurity zoning, keeping safety loops isolated yet data-accessible via secure proxies.
Fully redundant high-availability designs grow fastest at 8.95% CAGR as pharma, LNG, and nuclear end-users mandate zero unplanned downtime. Redundancy spans controllers, power, switches, and even GPS-synchronized time stamps to maintain sequence-of-events accuracy. Siemens demonstrated a virtual PLC in a production Audi line that migrated workloads between servers without interrupting motion control. Centralized controllers still serve turbine islands and batch digesters where deterministic cycles trump flexibility, but their share of the distributed control systems market declines as modular digital plants dominate new capex.
Distributed Control System (DCS) Market Report Segments the Industry Into by Component (Hardware, Software, Services), by End-User Vertical (Power Generation, Oil & Gas, and More), Architecture (Centralized Controller Systems and More), Deployment Model(On-Premise and More), Plant Size(Small ( Less Than 5000 I/O) and More) and Geography (North America, Europe, and More). The Market Forecasts are Provided in Terms of Value (USD).
Geography Analysis
Asia-Pacific held 37.60% share of the distributed control systems market in 2025, anchored by China's refining and chemicals capacity and India's rapid infrastructure build-out. Regional suppliers like Supcon win municipal water and mid-tier chemical jobs, yet global majors still dominate multi-billion-dollar LNG and nuclear projects. Beijing's smart-manufacturing program funds retrofits that couple DCS data with enterprise AI, expanding software pull-through. India's PLI incentives spur pharmaceutical and battery plants that specify modular, scalable DCS from day one. Southeast Asian economies add flexible packaging lines and biodiesel units, sustaining mid-single-digit growth.
The Middle East posts the fastest 6.95% CAGR, powered by Saudi Arabia's Vision 2030, which automates 40% of the kingdom's grid and builds green-hydrogen clusters. GCC states commit to USD 3.1 trillion in capital projects, each embedding OT-IT convergence from design. Local integrators partner with multinationals to meet localization quotas, broadening the vendor ecosystem within the distributed control systems market.
North America modernizes aging power and chemicals infrastructure, embedding cybersecurity as a funding prerequisite under DOE and DHS programs. The Inflation Reduction Act funnels incentives to carbon capture and clean fuels, both heavy DCS users. Europe emphasizes sustainability; process plants deploy advanced analytics to trim energy and comply with Fit-for-55 targets. South America invests in copper and lithium mining that uses edge-connected control for remote sites, while Africa rolls out desalination and grid upgrades blending local renewables, creating pockets of double-digit demand.
- ABB Ltd.
- Emerson Electric Co.
- Honeywell International Inc.
- Siemens AG
- Yokogawa Electric Corporation
- Schneider Electric SE
- Mitsubishi Electric Corporation
- Rockwell Automation, Inc.
- Valmet Oyj
- Azbil Corporation
- Omron Corporation
- Novatech LLC
- Toshiba Corporation
- Hitachi, Ltd.
- GE Digital (General Electric Co.)
- Fuji Electric Co., Ltd.
- Supcon Technology Co., Ltd.
- Hollysys Automation Technologies Ltd.
- Endress+Hauser Group Services AG
- BandR Industrial Automation GmbH
Additional Benefits:
- The market estimate (ME) sheet in Excel format
- 3 months of analyst support
TABLE OF CONTENTS
1 INTRODUCTION
- 1.1 Study Assumptions and Market Definition
- 1.2 Scope of the Study
2 RESEARCH METHODOLOGY
3 EXECUTIVE SUMMARY
4 MARKET LANDSCAPE
- 4.1 Market Overview
- 4.2 Market Drivers
- 4.2.1 Energy Transition Drives DCS Demand in Green Hydrogen and CCUS Facilities
- 4.2.2 Nuclear and SMR Projects Requiring Cyber-secure Safety-Classified DCS
- 4.2.3 Offshore Floating LNG Complexity Elevates High-Reliability DCS Adoption
- 4.2.4 Pharma Continuous Manufacturing Spurs Modular Batch DCS Installations
- 4.2.5 Digital-Twin-Integrated DCS for Predictive Maintenance in Brownfields
- 4.2.6 Remote Operations Centres in Mining Accelerate Edge-Connected DCS
- 4.3 Market Restraints
- 4.3.1 High Up-front CAPEX versus Modern PLC/SCADA Alternatives
- 4.3.2 Scarcity of DCS-Certified Engineers and Lifecycle Service Staff
- 4.3.3 Semiconductor Supply Crunch for High-Performance Controller Hardware
- 4.3.4 Lengthy Cyber-security Certification and Compliance Cycles
- 4.4 Value / Supply-Chain Analysis
- 4.5 Regulatory or Technological Outlook
- 4.6 Porter's Five Forces Analysis
- 4.6.1 Threat of New Entrants
- 4.6.2 Bargaining Power of Buyers
- 4.6.3 Bargaining Power of Suppliers
- 4.6.4 Threat of Substitute Products
- 4.6.5 Intensity of Competitive Rivalry
- 4.7 Industry Capacity and Investment Trends
5 MARKET SIZE AND GROWTH FORECASTS (VALUE)
- 5.1 By Component
- 5.1.1 Hardware
- 5.1.2 Software
- 5.1.3 Services
- 5.2 By Architecture
- 5.2.1 Centralized Controller Systems
- 5.2.2 Hybrid / Distributed Hybrid Systems
- 5.2.3 Fully Redundant High-Availability Systems
- 5.3 By Deployment Model
- 5.3.1 On-Premise
- 5.3.2 Cloud / Edge-Hosted
- 5.4 By Industry Vertical
- 5.4.1 Power Generation
- 5.4.1.1 Thermal Power Plants
- 5.4.1.2 Renewable and Battery Storage Plants
- 5.4.1.3 Nuclear Power Plants
- 5.4.2 Oil and Gas
- 5.4.2.1 Upstream
- 5.4.2.2 Midstream
- 5.4.2.3 Downstream and Refineries
- 5.4.3 Chemicals and Petrochemicals
- 5.4.4 Mining and Metals
- 5.4.5 Pulp and Paper
- 5.4.6 Pharmaceuticals and Life Sciences
- 5.4.7 Food and Beverage
- 5.4.8 Water and Wastewater
- 5.4.9 Other Industries
- 5.4.1 Power Generation
- 5.5 By Plant Size (Controller I/O)
- 5.5.1 Small ( greater than 5 000 I/O)
- 5.5.2 Medium (5 000 - 15 000 I/O)
- 5.5.3 Large (less than 15 000 I/O)
- 5.6 By Geography
- 5.6.1 North America
- 5.6.1.1 United States
- 5.6.1.2 Canada
- 5.6.2 Caribbean
- 5.6.3 South America
- 5.6.3.1 Brazil
- 5.6.3.2 Argentina
- 5.6.3.3 Rest of South America
- 5.6.4 Europe
- 5.6.4.1 Germany
- 5.6.4.2 United Kingdom
- 5.6.4.3 France
- 5.6.4.4 Italy
- 5.6.4.5 Nordics
- 5.6.4.6 Rest of Europe
- 5.6.5 Middle East
- 5.6.5.1 UAE
- 5.6.5.2 Saudi Arabia
- 5.6.5.3 Qatar
- 5.6.5.4 Rest of Middle East
- 5.6.6 Africa
- 5.6.6.1 South Africa
- 5.6.6.2 Nigeria
- 5.6.6.3 Rest of Africa
- 5.6.7 Asia-Pacific
- 5.6.7.1 China
- 5.6.7.2 Japan
- 5.6.7.3 India
- 5.6.7.4 South Korea
- 5.6.7.5 ASEAN
- 5.6.7.6 Rest of Asia-Pacific
- 5.6.1 North America
6 COMPETITIVE LANDSCAPE
- 6.1 Market Concentration
- 6.2 Strategic Moves
- 6.3 Market Share Analysis
- 6.4 Company Profiles {(includes Global level Overview, Market level overview, Core Segments, Financials as available, Strategic Information, Market Rank/Share for key companies, Products and Services, and Recent Developments)}
- 6.4.1 ABB Ltd.
- 6.4.2 Emerson Electric Co.
- 6.4.3 Honeywell International Inc.
- 6.4.4 Siemens AG
- 6.4.5 Yokogawa Electric Corporation
- 6.4.6 Schneider Electric SE
- 6.4.7 Mitsubishi Electric Corporation
- 6.4.8 Rockwell Automation, Inc.
- 6.4.9 Valmet Oyj
- 6.4.10 Azbil Corporation
- 6.4.11 Omron Corporation
- 6.4.12 Novatech LLC
- 6.4.13 Toshiba Corporation
- 6.4.14 Hitachi, Ltd.
- 6.4.15 GE Digital (General Electric Co.)
- 6.4.16 Fuji Electric Co., Ltd.
- 6.4.17 Supcon Technology Co., Ltd.
- 6.4.18 Hollysys Automation Technologies Ltd.
- 6.4.19 Endress+Hauser Group Services AG
- 6.4.20 BandR Industrial Automation GmbH
7 MARKET OPPORTUNITIES AND FUTURE OUTLOOK
- 7.1 White-Space and Unmet-Need Assessment
 分散式自動化控制系統市場預測至2034年-按組件、架構、開發、應用、最終用戶和區域分類的全球分析
 分散式控制系統市場:按組件、架構、最終用戶產業和部署類型分類-2026-2032年全球市場預測
 分散式控制系統市場報告:按組件、流程、應用和地區分類(2026-2034 年)
 全球分散式控制系統(DCS)市場規模、佔有率、趨勢和成長分析報告,2026-2034年
 分散式控制系統市場:按組件、最終用戶產業和地區分類
 2026-2030年全球石油天然氣產業分散式控制系統(DCS)市場
 2026年全球分散式控制系統市場報告
 分散式控制系統市場分析及預測(至2035年):按類型、產品類型、技術、組件、應用、流程、部署類型、最終用戶、功能和安裝類型分類
 分散式控制系統市場 - 全球產業規模、佔有率、趨勢、機會及預測(按組件、應用、最終用戶產業、地區和競爭格局分類),2021-2031年
 工業自動化硬體