

 |
市場調查報告書
商品編碼
1907221
無損檢測(NDT):市佔率分析、產業趨勢與統計、成長預測(2026-2031)Non-Destructive Testing (NDT) - Market Share Analysis, Industry Trends & Statistics, Growth Forecasts (2026 - 2031) |
||||||
※ 本網頁內容可能與最新版本有所差異。詳細情況請與我們聯繫。
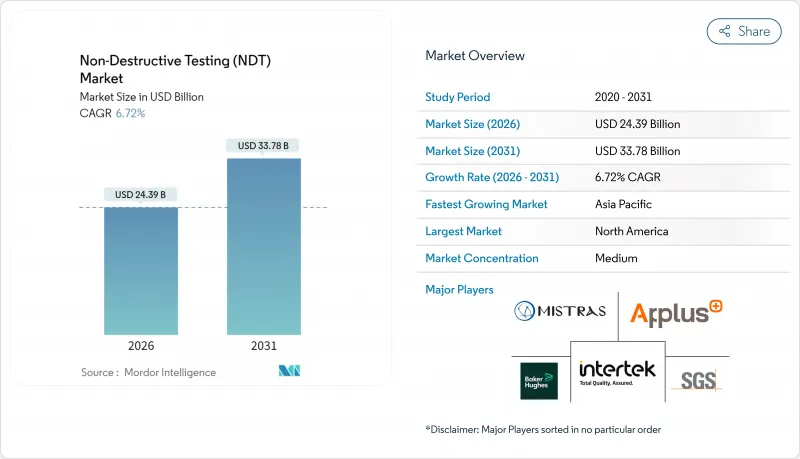
2025 年無損檢測 (NDT) 市值為 228.6 億美元,預計到 2031 年將達到 337.8 億美元,高於 2026 年的 243.9 億美元。
預計在預測期(2026-2031 年)內,複合年成長率將達到 6.72%。
在全球安全標準不斷提高、老舊資產加速更新換代以及人工智慧診斷平台快速普及的推動下,無損檢測 (NDE) 正從被動的缺陷檢測轉向預測性的資產管理。北美和歐洲的監管機構目前正在強制要求提高壓力容器、管道、飛機結構和核子反應爐的偵測頻率,從而建立起穩定的需求基礎。同時,人工智慧驅動的分析技術正在縮短檢查週期並大幅減少資料處理時間,為軟體供應商創造新的訂閱收入來源。服務供應商正在將可攜式相位陣列數位放射線射線照相設備與雲端分析相結合,以提高生產效率並降低檢測總成本。隨著一體化企業尋求提供包含硬體、軟體和認證人員的承包解決方案,簡化最終用戶的合規流程,產業透過併購的整合正在加速。
全球無損檢測 (NDT) 市場趨勢與洞察
更嚴格的安全和品質法規推動合規主導型成長
美國機械工程師協會 (ASME)、美國核能管理委員會(NRC) 和美國聯邦航空管理局 (FAA) 等監管機構已於 2024 年修訂了相關標準,提高了壓力容器、核子反應爐零件和複合材料飛機零件的無損檢測頻率和整體性。這些嚴格的法規正促使採購決策從可自由支配支出轉向強制性合規,從而確保即使在景氣衰退時期也能維持基本需求。高溫壓力容器強制進行相位陣列超音波檢測以及數位化記錄保存法規的實施,正推動資產所有者對其設備進行現代化改造。服務供應商受益於多年期檢測契約,提高了收入的可預測性;而設備供應商則受益於合規更新和持續軟體訂閱帶來的加速更換需求。隨著越來越多的地區遵守美國和歐洲標準,這些促進因素的影響力正在擴大,從而鞏固了無損檢測市場的長期成長趨勢。
老化的基礎設施更換週期推動了對測試的需求。
北美超過40%的橋樑已超過設計壽命,上世紀60年代建造的管道也即將達到關鍵的檢測週期。上世紀70年代運作的核能發電廠的延壽計畫要求在許可證續期前進行大量的超音波容器掃描。由此產生的檢測積壓導致對高通量檢測服務、智慧清管工具和自動化數據分析的需求創下歷史新高。由於基礎設施故障會造成巨大的社會和經濟損失,監管機構強制要求資產所有者執行嚴格的檢測計劃,而這些計劃是無法推遲的。這一長期趨勢鞏固了無損檢測業務收益的長期前景,並推動了對可提高現場效率的攜帶式設備的投資。隨著亞太地區的公共產業也開始類似的更新週期,全球需求曲線持續陡峭上升。
自動化無損檢測系統的高成本限制了其在價格敏感型市場的應用。
全自動相位陣列掃描器的成本在20萬至50萬美元之間,給中小型服務公司的預算帶來了沉重負擔。每年的校準、許可和培訓費用使生命週期成本翻倍,並延長了損益平衡點。在人事費用低廉的新興市場,許多操作人員即使週期較長,也更傾向於人工檢測,這減緩了高利潤自動化解決方案的普及。缺乏資本規模的小型供應商難以參與競爭,加速了市場整合。在融資工具和設備租賃模式成熟之前,這種限制將繼續阻礙自動化解決方案的普及,尤其是在高價值的能源和航太領域之外。
細分市場分析
到2025年,服務收入將構成比收入的78.90%,其中軟體業務預計將以11.71%的複合年成長率成長,從而在無損檢測市場中塑造出新的價值創造模式。人工智慧驅動的影像識別引擎可在數分鐘內將Terabyte的掃描資料轉化為可操作的維護洞察,從而將服務經濟模式從按小時計費收費為按績效計費。設備供應商目前正將雲端分析與硬體捆綁銷售,並採用年度訂閱模式,以確保在初始銷售之後仍能獲得持續收入。邊緣運算模組的普及使得在檢測現場進行即時分析成為可能,從而緩解了資料主權方面的擔憂並降低了頻寬成本。
軟體的興起並非取代現場工作,而是重新定義了現場工作。技術人員能夠更快地收集更高品質的數據,而中央負責人檢驗人工智慧產生的標記並產生符合合規要求的報告。這種模式減少了現場加班時間,提高了資產運轉率,並為平台提供者產生收入。隨著監管機構核准數位簽章簽章報告,無損檢測產業在速度和審核方面都得到了提升,凸顯了軟體在現代檢測工作流程中的關鍵作用。
由於超音波檢測在焊接、鍛造和複合材料檢測方面具有廣泛的適用性,預計到2025年,超音波檢測將佔據無損檢測市場27.95%的佔有率。先進的相位陣列配置無需拆卸設備即可快速繪製腐蝕分佈圖並測量體積缺陷尺寸。然而,渦流檢測預計到2031年將以9.07%的複合年成長率成長,這主要得益於其能夠檢測航太複合材料和積層製造零件中使用的導電材料中的微裂紋。
改進的探頭設計和多頻陣列能夠實現更深的穿透深度和更快的掃描速度,挑戰了超音波檢測在薄壁檢測方面的傳統優勢。同時,數位放射線在管道焊縫檢驗中繼續發揮關鍵作用,而磁粉檢測對於檢測鐵磁性部件的表面缺陷至關重要。結合這些互補技術,資產所有者可以根據缺陷類型和材料,獲得兼顧速度、靈敏度和合規性的均衡工具。
區域分析
截至2025年,北美地區將維持36.30%的市場佔有率,這主要得益於成熟的監管體系、老化的基礎設施以及人工智慧技術的早期應用。該地區擁有大規模現有設施,例如壓力容器、管道和飛機結構,從而保證了檢測量的穩定性。油氣業者也正在投資先進的機器人清管器檢測技術,以延長其資產的使用壽命。政府為支持核能發電廠延壽計畫提供的補助也推動了對容積式超音波掃描的需求。
歐洲雖然略顯落後,但得益於嚴格的安全指令以及歐盟「綠色交易」下對可再生能源計劃的推動,正從中受益。風力發電機葉片檢測、複合材料轉子缺陷監測以及氫氣管道試點計畫都在推動該地區無損檢測市場的發展。法國和英國正在進行的核子反應爐升級改造,促使長期檢測合約的需求增加;同時,日益成長的環境、社會和治理(ESG)問題也加速了從膠片射線照相向數位放射線的過渡,從而有助於減少有害廢棄物的產生。
亞太地區成長勢頭強勁,複合年成長率達7.61%,主要得益於中國和印度的大型基礎設施計劃,以及航太和半導體製造業的擴張。日本和韓國政府正努力使本國標準與ASME和IEC標準接軌,從而加強了檢驗力度。新興的東南亞國家擴大採用國際認證機構的合格評定,為全球企業創造了服務機會。 「一帶一路」沿線管線網路推動了對智慧清管器偵測的需求,而該地區新建的造船廠則要求對大型船體焊接進行磁粉探傷和相位陣列探傷。
在中東和非洲地區,海上油氣投資和石化工廠擴建將推動需求成長。紅海和西非近海的海底計劃需要深水檢測技術。部分國家的政治不穩定將導致計劃延期,增加區域預測的波動性,但如果計劃按計劃推進,也將帶來高回報。在拉丁美洲,預計成長將較為溫和,主要由巴西鹽鹽層下油氣開發和墨西哥煉油廠維修,這兩項工程都需要高規格的無損檢測技術。
其他福利:
- Excel格式的市場預測(ME)表
- 3個月的分析師支持
目錄
第1章 引言
- 研究假設和市場定義
- 調查範圍
第2章調查方法
第3章執行摘要
第4章 市場情勢
- 市場概覽
- 市場促進因素
- 更嚴格的安全和品質法規
- 老舊基礎建設的更新周期
- 海上石油計劃擴張
- 可攜式相控陣和DR設備的現狀
- 人工智慧驅動的缺陷分析平台
- 積層製造中的品質保證要求
- 市場限制
- 自動化無損檢測系統高成本
- 合格技術人員短缺
- 網路安全和資料主權障礙
- ESG(環境、社會與治理)對放射性試驗廢棄物的強烈反對
- 產業價值鏈分析
- 宏觀經濟因素的影響
- 監管環境
- 技術展望
- 波特五力分析
- 新進入者的威脅
- 供應商的議價能力
- 買方的議價能力
- 替代品的威脅
- 競爭對手之間的競爭
第5章 市場規模與成長預測
- 按組件
- 裝置
- 軟體
- 服務
- 消耗品
- 透過測試方法
- 超音波
- 放射線檢查
- 磁粉檢測
- 液體液體滲透探傷
- 目視檢查
- 渦流檢測
- 聲發射測試
- 熱成像/紅外線檢測
- 電腦斷層掃描
- 透過技術
- 傳統方法
- 配備人工智慧
- 按最終用戶行業分類
- 石油和天然氣
- 發電
- 航太工業
- 防禦
- 汽車/運輸設備
- 製造業和重工業
- 建築和基礎設施
- 化工/石油化工
- 海洋/造船
- 電子和半導體
- 礦業
- 醫療設備
- 其他終端用戶產業
- 按地區
- 北美洲
- 美國
- 加拿大
- 墨西哥
- 南美洲
- 巴西
- 阿根廷
- 南美洲其他地區
- 歐洲
- 德國
- 英國
- 法國
- 義大利
- 西班牙
- 其他歐洲地區
- 亞太地區
- 中國
- 日本
- 印度
- 韓國
- 東南亞
- 亞太其他地區
- 中東和非洲
- 中東
- 沙烏地阿拉伯
- 阿拉伯聯合大公國
- 土耳其
- 其他中東地區
- 非洲
- 南非
- 奈及利亞
- 其他非洲地區
- 中東
- 北美洲
第6章 競爭情勢
- 市場集中度
- 策略趨勢
- 市佔率分析
- 公司簡介
- Baker Hughes Company
- MISTRAS Group, Inc.
- SGS SA
- Intertek Group plc
- Applus+Services, SA
- Olympus Corporation
- Eddyfi/NDT Inc.
- Yxlon International GmbH
- Magnaflux(Illinois Tool Works Inc.)
- Ashtead Technology Ltd.
- Zetec Inc.
- Sonatest Ltd.
- Bureau Veritas SA
- TUV Rheinland AG
- Element Materials Technology Group Ltd.
- DEKRA SE
- DNV AS
- Acuren Inspection, Inc.
- NDT Global GmbH and Co. KG
- Cygnus Instruments Ltd.
- Sonotron NDT
- Bosello High Technology Srl
- LynX Inspection Inc.
- TD Williamson, Inc.
第7章 市場機會與未來展望
The non-destructive testing market was valued at USD 22.86 billion in 2025 and estimated to grow from USD 24.39 billion in 2026 to reach USD 33.78 billion by 2031, at a CAGR of 6.72% during the forecast period (2026-2031).
Heightened global safety rules, the accelerating replacement of aging assets, and the rapid adoption of AI-enabled diagnostic platforms are shifting non-destructive evaluation from reactive fault finding toward predictive asset management. Regulatory agencies in North America and Europe now mandate more frequent inspections for pressure vessels, pipelines, aircraft structures, and nuclear reactors, anchoring a steady demand floor. Meanwhile, AI-driven analytics shorten inspection cycles, slash data-processing time, and create new subscription revenue streams for software vendors. Service providers are responding by pairing portable phased-array and digital radiography equipment with cloud analytics, raising productivity and lowering total inspection costs. Consolidation through mergers and acquisitions is intensifying, as integrated players seek to bundle hardware, software, and certified labor into turnkey offerings that simplify compliance for end users.
Global Non-Destructive Testing (NDT) Market Trends and Insights
Stricter Safety And Quality Regulations Drive Compliance-Led Growth
Regulatory bodies, such as the American Society of Mechanical Engineers, the Nuclear Regulatory Commission, and the Federal Aviation Administration, updated their codes in 2024, which now require more frequent and comprehensive non-destructive examinations of pressure vessels, reactor components, and composite aircraft parts. These tighter rules have shifted purchasing decisions from discretionary spending to mandatory compliance, guaranteeing baseline demand even in downturns. The mandatory use of phased-array ultrasonics for high-temperature pressure vessels, combined with digital record-keeping rules, is prompting asset owners to modernize their equipment fleets. Service providers benefit from multiyear inspection contracts that improve revenue predictability. Equipment vendors win through accelerated replacement sales and recurring software subscriptions tied to code compliance updates. As additional jurisdictions align with U.S. and European standards, the driver's influence broadens, reinforcing a long-term growth thrust for the non-destructive testing market.
Aging Infrastructure Replacement Cycle Accelerates Inspection Demand
More than 40% of North American bridges now exceed design life, while pipelines installed during the 1960s are approaching critical inspection intervals. Life-extension programs for nuclear plants commissioned in the 1970s require extensive ultrasonic vessel scans to be performed before license renewal. The resulting inspection backlog fuels record demand for high-throughput testing services, intelligent pigging tools, and automated data analytics. Because infrastructure failures carry high social and economic costs, regulators enforce strict inspection calendars that asset owners cannot defer. This secular trend secures long-term visibility for non-destructive testing service revenue and spurs investment in portable equipment that improves site productivity. As Asia-Pacific utilities embark on similar upgrade cycles, global demand curves continue to steepen.
High Cost Of Automated NDT Systems Limits Adoption In Price-Sensitive Markets
Fully automated phased-array scanners can cost USD 200,000-500,000, a price point that strains the budgets of small and mid-sized service firms. Annual calibration, software licensing, and training double the lifetime ownership cost, extending breakeven periods. In emerging markets with lower labor costs, operators often favor manual inspection despite longer cycle times, which slows the penetration of high-margin automated solutions. Smaller vendors lacking capital scale struggle to compete, accelerating market consolidation. Until financing tools or equipment leasing models mature, this restraint will continue to dampen uptake, especially outside high-value energy and aerospace segments.
Other drivers and restraints analyzed in the detailed report include:
- Expansion Of Offshore Oil And Gas Projects Drives Subsea NDT Innovation
- Portable Phased-Array And Digital-Radiography Equipment Uptake Transforms Field Operations
- Shortage Of Certified Technicians Constrains Market Growth Potential
For complete list of drivers and restraints, kindly check the Table Of Contents.
Segment Analysis
Services held 78.90% of 2025 revenue, yet the software slice is forecast to expand at 11.71% CAGR, setting a new value-creation arc for the non-destructive testing market. AI-driven image-recognition engines convert terabytes of scan data into actionable maintenance insights within minutes, reshaping service economics from hourly billing toward outcome-based pricing. Equipment vendors now bundle cloud analytics with hardware, embedding annual subscriptions that stretch revenue beyond the initial sale. The surge in edge-computing modules enables real-time analytics at inspection sites, easing data sovereignty concerns and reducing bandwidth costs.
Software's rise does not eclipse field labor but redefines task allocation. Technicians capture higher-quality data more quickly, while centralized analysts validate AI-generated flags and produce compliance-ready reports. The model trims field overtime, increases fleet utilization, and creates new recurring revenue for platform providers. As regulatory bodies accept digitally signed reports, the non-destructive testing industry gains both speed and auditability, underscoring the pivotal role of software in modern inspection workflows.
Ultrasonic methods accounted for 27.95% of the 2025 non-destructive testing market share, owing to their versatility in inspections of welds, forgings, and composites. Advanced phased-array configurations enable rapid corrosion mapping and volumetric flaw sizing without the need for dismantling equipment. Yet, eddy-current testing is expected to grow at a 9.07% CAGR through 2031, driven by its ability to detect micro-cracks in conductive materials used in aerospace composites and additive-manufactured parts.
Improved probe design and multi-frequency arrays now deliver deeper penetration and faster scanning, challenging ultrasonics' historical stronghold in thin-wall inspections. Meanwhile, digital radiography continues to play a critical role in pipeline weld validation, and magnetic particle testing remains indispensable for detecting surface flaws in ferromagnetic components. Together, these complementary methods ensure that asset owners deploy a balanced toolbox that blends speed, sensitivity, and regulatory acceptance, depending on the defect type and material.
The Global Non-Destructive Testing (NDT) Market Report is Segmented by Component (Equipment, Software, Services, and Consumables), Testing Method (Ultrasonic Testing, Radiographic Testing, Magnetic Particle Testing, and More), Technique (Traditional/Conventional and AI-Enabled), End-User Industry (Oil and Gas, Power Generation, Aerospace, and More), and Geography. The Market Forecasts are Provided in Terms of Value (USD).
Geography Analysis
North America retained a 36.30% share in 2025, driven by mature regulatory oversight, aging infrastructure, and early adoption of AI. The region's large installed base of pressure vessels, pipelines, and aircraft structures ensures steady inspection volumes, while oil and gas operators fund advanced robotic pigging to extend the life of their assets. Government grants supporting nuclear plant life-extension programs also sustain demand for volumetric ultrasonic scanning.
Europe trails slightly, yet benefits from rigorous safety directives and the European Union's push for renewable energy projects under the Green Deal. Wind-turbine blade inspections, composite rotor defect monitoring, and hydrogen pipeline pilots collectively bolster the regional non-destructive testing market. Ongoing upgrades to nuclear reactors in France and the United Kingdom are driving the addition of long-term inspection contracts, while ESG concerns are accelerating the shift from film to digital radiography to reduce hazardous-waste volumes.
The Asia-Pacific region is delivering the strongest forward momentum, with a 7.61% CAGR, driven by massive infrastructure projects in China and India, as well as expanding aerospace and semiconductor manufacturing. Governments in Japan and South Korea align local codes with ASME and IEC standards, thereby raising the rigor of inspections. Emerging Southeast Asian economies often rely on international certifiers for compliance, presenting opportunities for service to global firms. Belt and Road pipeline networks drive demand for intelligent pigging, while new shipyards across the region require magnetic particle and phased-array inspections of large hull welds.
The Middle East and Africa gain from offshore oil and gas investments and petrochemical plant expansions. Subsea projects in the Red Sea and offshore West Africa call for deepwater-qualified inspection technologies. Political instability in certain countries can delay projects, injecting volatility into regional forecasts but also producing premium margins when projects advance under compressed timelines. Latin America records moderate growth, centered on Brazilian pre-salt developments and Mexican refinery upgrades, both of which require high-specification non-destructive examinations.
- Baker Hughes Company
- MISTRAS Group, Inc.
- SGS SA
- Intertek Group plc
- Applus+ Services, S.A.
- Olympus Corporation
- Eddyfi/NDT Inc.
- Yxlon International GmbH
- Magnaflux (Illinois Tool Works Inc.)
- Ashtead Technology Ltd.
- Zetec Inc.
- Sonatest Ltd.
- Bureau Veritas SA
- TUV Rheinland AG
- Element Materials Technology Group Ltd.
- DEKRA SE
- DNV AS
- Acuren Inspection, Inc.
- NDT Global GmbH and Co. KG
- Cygnus Instruments Ltd.
- Sonotron NDT
- Bosello High Technology Srl
- LynX Inspection Inc.
- T.D. Williamson, Inc.
Additional Benefits:
- The market estimate (ME) sheet in Excel format
- 3 months of analyst support
TABLE OF CONTENTS
1 INTRODUCTION
- 1.1 Study Assumptions and Market Definition
- 1.2 Scope of the Study
2 RESEARCH METHODOLOGY
3 EXECUTIVE SUMMARY
4 MARKET LANDSCAPE
- 4.1 Market Overview
- 4.2 Market Drivers
- 4.2.1 Stricter safety and quality regulations
- 4.2.2 Aging infrastructure replacement cycle
- 4.2.3 Expansion of offshore oil and gas projects
- 4.2.4 Portable phased-array and DR equipment uptake
- 4.2.5 AI-powered defect analytics platforms
- 4.2.6 Additive-manufacturing QA requirements
- 4.3 Market Restraints
- 4.3.1 High cost of automated NDT systems
- 4.3.2 Shortage of certified technicians
- 4.3.3 Cyber-security and data-sovereignty barriers
- 4.3.4 ESG pushback on radiography waste
- 4.4 Industry Value Chain Analysis
- 4.5 Impact of Macroeconomic Factors
- 4.6 Regulatory Landscape
- 4.7 Technological Outlook
- 4.8 Porter's Five Forces Analysis
- 4.8.1 Threat of New Entrants
- 4.8.2 Bargaining Power of Suppliers
- 4.8.3 Bargaining Power of Buyers
- 4.8.4 Threat of Substitutes
- 4.8.5 Competitive Rivalry
5 MARKET SIZE AND GROWTH FORECASTS (VALUE)
- 5.1 By Component
- 5.1.1 Equipment
- 5.1.2 Software
- 5.1.3 Services
- 5.1.4 Consumables
- 5.2 By Testing Method
- 5.2.1 Ultrasonic Testing
- 5.2.2 Radiographic Testing
- 5.2.3 Magnetic Particle Testing
- 5.2.4 Liquid Penetrant Testing
- 5.2.5 Visual Inspection Testing
- 5.2.6 Eddy-Current Testing
- 5.2.7 Acoustic Emission Testing
- 5.2.8 Thermography / Infrared Testing
- 5.2.9 Computed Tomography Testing
- 5.3 By Technique
- 5.3.1 Traditional/ Conventional
- 5.3.2 AI-enabled
- 5.4 By End-user Industry
- 5.4.1 Oil and Gas
- 5.4.2 Power Generation
- 5.4.3 Aerospace
- 5.4.4 Defense
- 5.4.5 Automotive and Transportation
- 5.4.6 Manufacturing and Heavy Engineering
- 5.4.7 Construction and Infrastructure
- 5.4.8 Chemical and Petrochemical
- 5.4.9 Marine and Ship Building
- 5.4.10 Electronics and semiconductor
- 5.4.11 Mining
- 5.4.12 Medical Devices
- 5.4.13 Other End-user Industries
- 5.5 By Geography
- 5.5.1 North America
- 5.5.1.1 United States
- 5.5.1.2 Canada
- 5.5.1.3 Mexico
- 5.5.2 South America
- 5.5.2.1 Brazil
- 5.5.2.2 Argentina
- 5.5.2.3 Rest of South America
- 5.5.3 Europe
- 5.5.3.1 Germany
- 5.5.3.2 United Kingdom
- 5.5.3.3 France
- 5.5.3.4 Italy
- 5.5.3.5 Spain
- 5.5.3.6 Rest of Europe
- 5.5.4 Asia-Pacific
- 5.5.4.1 China
- 5.5.4.2 Japan
- 5.5.4.3 India
- 5.5.4.4 South Korea
- 5.5.4.5 South-East Asia
- 5.5.4.6 Rest of Asia-Pacific
- 5.5.5 Middle East and Africa
- 5.5.5.1 Middle East
- 5.5.5.1.1 Saudi Arabia
- 5.5.5.1.2 United Arab Emirates
- 5.5.5.1.3 Turkey
- 5.5.5.1.4 Rest of Middle East
- 5.5.5.2 Africa
- 5.5.5.2.1 South Africa
- 5.5.5.2.2 Nigeria
- 5.5.5.2.3 Rest of Africa
- 5.5.5.1 Middle East
- 5.5.1 North America
6 COMPETITIVE LANDSCAPE
- 6.1 Market Concentration
- 6.2 Strategic Moves
- 6.3 Market Share Analysis
- 6.4 Company Profiles (includes Global level Overview, Market level overview, Core Segments, Financials as available, Strategic Information, Market Rank/Share for key companies, Products and Services, and Recent Developments)
- 6.4.1 Baker Hughes Company
- 6.4.2 MISTRAS Group, Inc.
- 6.4.3 SGS SA
- 6.4.4 Intertek Group plc
- 6.4.5 Applus+ Services, S.A.
- 6.4.6 Olympus Corporation
- 6.4.7 Eddyfi/NDT Inc.
- 6.4.8 Yxlon International GmbH
- 6.4.9 Magnaflux (Illinois Tool Works Inc.)
- 6.4.10 Ashtead Technology Ltd.
- 6.4.11 Zetec Inc.
- 6.4.12 Sonatest Ltd.
- 6.4.13 Bureau Veritas SA
- 6.4.14 TUV Rheinland AG
- 6.4.15 Element Materials Technology Group Ltd.
- 6.4.16 DEKRA SE
- 6.4.17 DNV AS
- 6.4.18 Acuren Inspection, Inc.
- 6.4.19 NDT Global GmbH and Co. KG
- 6.4.20 Cygnus Instruments Ltd.
- 6.4.21 Sonotron NDT
- 6.4.22 Bosello High Technology Srl
- 6.4.23 LynX Inspection Inc.
- 6.4.24 T.D. Williamson, Inc.
7 MARKET OPPORTUNITIES AND FUTURE OUTLOOK
- 7.1 White-space and Unmet-need Assessment
 TFM/FMC相位陣列超音波探傷市場按技術、產品類型、檢測模式、最終用戶和應用分類-2026-2032年全球預測
 無損檢測市場規模、佔有率及成長分析(依方法、技術、應用、組件、最終用戶及地區分類)-2026-2033年產業預測
 無人機測試服務:全球市場洞察與預測(至2031年)
 無損檢測市場規模、佔有率和趨勢分析報告:按產品、測試方法、產業、地區和細分市場預測(2025-2033 年)
 全球無損檢測設備市場:依檢測方法、技術、最終用戶和地區劃分-市場規模、產業趨勢、機會分析和預測(2025-2033 年)
 石油天然氣無損檢測:全球市場佔有率和排名、總收入和需求預測(2025-2031年)相位陣列探傷儀:全球市佔率及排名、總收入及需求預測(2025-2031年)工業無損檢測(NDT)X光檢測設備:全球市場佔有率和排名、總收入和需求預測(2025-2031年)非破壞性檢驗與檢驗市場(依技術、方法、服務與垂直產業)-2025-2032 年全球預測
 2025年無損檢測(NDT)和檢測全球市場報告