


 |
市場調查報告書
商品編碼
1906963
聚對苯二甲酸乙二醇酯(PET):市場佔有率分析、產業趨勢與統計、成長預測(2026-2031)Polyethylene Terephthalate (PET) - Market Share Analysis, Industry Trends & Statistics, Growth Forecasts (2026 - 2031) |
||||||
※ 本網頁內容可能與最新版本有所差異。詳細情況請與我們聯繫。
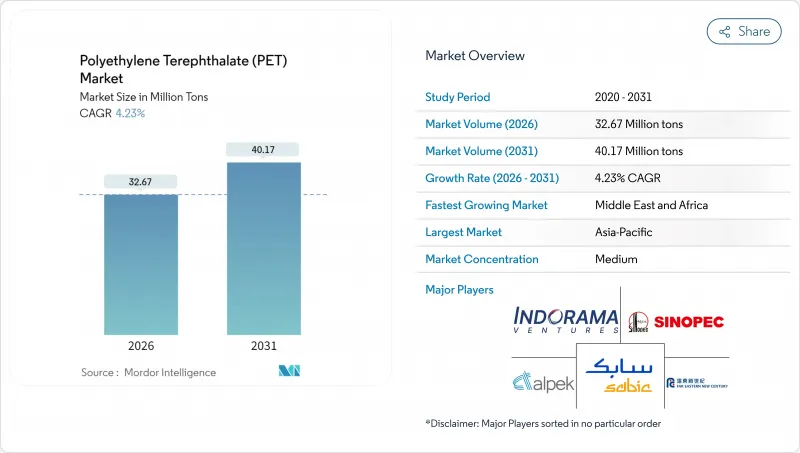
預計到 2026 年,聚對苯二甲酸乙二醇酯 (PET) 市場規模將達到 3,267 萬噸。
這意味著產量將從 2025 年的 3,134 萬噸增加到 2031 年的 4,017 萬噸,2026 年至 2031 年的年複合成長率(CAGR)為 4.23%。
成長的驅動力在於阻隔性能、成本競爭力和可回收性之間的平衡,這使其在飲料包裝領域的地位日益鞏固,同時在電子產品和工業紡織品領域的應用也在不斷擴展。亞太地區的強勁需求、日益嚴格的再生材料含量監管要求以及化學回收技術的進步是推動銷售成長的根本因素。品牌所有者的永續性措施為再生聚對苯二甲酸乙二醇酯(rPET)創造了穩定的需求,而新興市場對成本的謹慎採購則維持了對原生樹脂的需求。儘管原料價格波動以及聚Polyethylene Furanoate酯(PEF)和鋁替代的威脅帶來了不利影響,但對閉合迴路系統和特種等級產品的投資正為聚對苯二甲酸乙二醇酯(PET)市場提供多元化的成長機會。
全球聚對苯二甲酸乙二醇酯(PET)市場趨勢與洞察
過渡到封閉式瓶對瓶回收
預計2024年,歐洲聚對苯二甲酸乙二醇酯(PET)飲料瓶的回收率將達到75%,新瓶中再生材料的含量將上升至24%,接近計畫於2025年底生效的25%的強制性標準。由於托盤應用中產生的高品質碎片導致區域供應緊張,歐洲再生聚對苯二甲酸乙二醇酯(rPET)的價格仍維持在每噸750-800美元左右的高位,遠高於原生樹脂。儘管機械回收的限制促使企業投資於催化和熱解技術,但規模成本和原料波動限制了這些技術的即時效益。跨國公司繼續集中投資基礎設施以確保原料供應,並正在重新制定聚對苯二甲酸乙二醇酯(PET)市場的長期籌資策略。
新興市場無菌熱灌裝PET包裝的快速成長
在低溫運輸持續短缺的情況下,東南亞和拉丁美洲等新興市場正加速採用熱固型瓶。聚對苯二甲酸乙二醇酯(PET)的耐熱特性使得果汁和乳類飲料能夠在室溫下儲存,從而減少電力供應不穩定地區的食品變質。熱固型PET價格較高,有利於擁有專用設施的成熟生產商。同時,監管機構正日益將無菌包裝視為食品安全政策的支柱。這一趨勢正在將聚對苯二甲酸乙二醇酯(PET)市場拓展到碳酸飲料以外的領域,並促使區域樹脂加工商投資升級其拉伸吹塑成型成型設備。
對二甲苯 (PX) 和單乙二醇 (MEG) 原料價格波動
對二甲苯 (PX) 和乙二醇 (MEG) 約佔 PET 變動成本的 85%,其利潤率與原油價格波動密切相關。亞洲的一體化生產企業享有物流優勢,而歐美生產商則需承擔更高的運費和能源成本。地緣政治動盪和運輸限制加劇了區域價格差異,降低了獨立工廠的出口競爭力。避險工具雖然可以部分緩解這個問題,但也增加了合約的複雜性,加重了小規模的加工企業,尤其是那些財務基礎較弱的企業的負擔。
細分市場分析
由於成本效益高且品質穩定,到2025年,原生樹脂將佔全球出貨量的76.10%(約2,385萬噸)。再生PET的出貨量略低於750萬噸,預計將以8.02%的複合年成長率成長,成為成長最快的樹脂類型,這主要得益於監管要求和品牌目標帶來的市場需求成長。歐洲將主導再生PET的普及應用,預計2024年,本地生產的再生PET將有39%用於瓶裝生產。然而,原料短缺和分類回收的挑戰將導致北美地區再生PET的價格持續高於原生樹脂,溢價約為每噸150-200美元,歐盟地區則可能高達每噸800美元。
機械回收對顏色和污染物的限制促使人們關注化學解聚技術,但由於其資本密集,在2028年之前難以廣泛應用。食品級造粒生產線的投資正在擴大再生PET的供應比例,並縮小成本差距。原生PET供應商正利用其自身的回收設施來確保打包材料的供應,從而重塑了不斷發展的PET市場中原生PET與再生PET之間的競爭格局。
聚對苯二甲酸乙二醇酯(PET)市場報告按原料類型(原生PET和再生PET)、終端用戶產業(汽車、建築、電氣電子、工業機械及其他終端用戶產業)和地區(北美、南美、歐洲、亞太、中東和非洲)進行細分。市場預測以數量(噸)和價值(美元)為單位。
區域分析
亞太地區預計將引領市場,到2025年將佔全球產量的47.10%(約1480萬噸),這主要得益於其一體化的原料供給能力和快速成長的消費需求。中國仍將是最大的生產基地,而印度的消費量正因包裝食品市場的成長和回收投資而加速成長。印尼和泰國等東南亞國家正在擴大產能,以服務區域飲料和紡織業。 Indorama Ventures透過與Varun Beverages成立合資企業,加強了其在當地的業務佈局,展現了其兼顧規模擴張和本地市場准入的策略。
儘管產量有限,歐洲和北美在推動再生PET(rPET)應用的法規結構方面處於主導。歐盟的目標是到2024年實現75%的寶特瓶回收率,這將使歐盟對再生PET的國內需求高於全球標準。雖然高昂的能源和勞動力成本給當地生產商帶來了壓力,但與尋求低碳包裝的品牌所有者地理位置接近性,有利於生產高附加價值特種產品。北美頁岩原料的經濟效益良好,但來自亞洲的進口壓力限制了利潤率的成長,迫使生產商轉向生產技術級和再生級PET,以保持在PET市場的競爭力。
中東和非洲地區預計將以5.05%的複合年成長率實現最快成長。沿岸地區的生產商正充分利用有利的原料,例如博祿(Borouge)等公司計劃到2028年實現年產能超過660萬噸,目標出口亞洲和非洲。都市化和基礎設施投資正在推動國內需求成長,尤其是瓶裝水和乳類飲料的需求。儘管政治不穩定和水資源短缺構成挑戰,但該地區具有優勢的原料成本以及位於歐洲和亞洲之間的地理位置,為其提供了戰略性的運輸路線。
其他福利:
- Excel格式的市場預測(ME)表
- 3個月的分析師支持
目錄
第1章 引言
- 研究假設和市場定義
- 調查範圍
第2章調查方法
第3章執行摘要
第4章 市場情勢
- 市場概覽
- 市場促進因素
- 邁向閉合迴路瓶到瓶回收
- 新興市場無菌熱填充PET包裝的快速成長
- 長絲級PET在產業用紡織品的應用拓展
- 品牌擁有者承諾在2030年達到50%的再生聚乙烯(rPET)含量。
- 政府強制推行一次性塑膠替代品
- 市場限制
- PX和MEG原物料價格波動
- 瓶子製纖維的降級回收可能導致供應過剩
- PEF 和鋁替代品的威脅
- 價值鏈分析
- 波特五力模型
- 新進入者的威脅
- 供應商的議價能力
- 買方的議價能力
- 替代品的威脅
- 競爭對手之間的競爭
- 進出口趨勢
- 價格趨勢
- 形態趨勢
- 回收利用概述
- 法律規範
- 終端用戶產業趨勢
- 航太(航太零件生產收入)
- 汽車(汽車產量)
- 建築與施工(新建建築占地面積)
- 電氣電子設備(電氣電子設備生產收入)
- 包裝(塑膠包裝量)
第5章 市場規模及成長預測(以金額為準及數量)
- 依原料類型
- 處女寵物
- 再生PET(rPET)
- 按最終用戶行業分類
- 車
- 建築/施工
- 電氣和電子設備
- 工業和機械
- 包裝
- 其他終端用戶產業
- 按地區
- 亞太地區
- 中國
- 印度
- 日本
- 韓國
- 澳洲
- 馬來西亞
- 亞太其他地區
- 北美洲
- 美國
- 加拿大
- 墨西哥
- 歐洲
- 德國
- 法國
- 英國
- 義大利
- 俄羅斯
- 其他歐洲地區
- 南美洲
- 巴西
- 阿根廷
- 南美洲其他地區
- 中東和非洲
- 沙烏地阿拉伯
- 阿拉伯聯合大公國
- 南非
- 奈及利亞
- 其他中東和非洲地區
- 亞太地區
第6章 競爭情勢
- 市場集中度
- 策略趨勢
- 市佔率(%)/排名分析
- 公司簡介
- Alpek SAB de CV
- CR Chemical Materials Technology Inc.
- Far Eastern New Century Co., Ltd.
- Hengli Group Co. Ltd
- Indorama Ventures Public Company Limited.
- LOTTE Chemical CORPORATION
- Mitsubishi Chemical Group Corporation
- NAN YA Plastics Industrial Co., Ltd.
- Reliance Industries Limited
- SABIC
- Sanfangxiang Group Co., Ltd.
- Sinopec(China Petrochemical Corporation)
- Zhejiang Hengyi Group Co., Ltd.
- Zhink Group Co., Ltd.
第7章 市場機會與未來展望
第8章:執行長面臨的關鍵策略挑戰
Polyethylene Terephthalate Market size in 2026 is estimated at 32.67 Million tons, growing from 2025 value of 31.34 Million tons with 2031 projections showing 40.17 Million tons, growing at 4.23% CAGR over 2026-2031.
Growth rests on the material's balance of barrier performance, cost-competitiveness, and recyclability, reinforcing its role in beverage packaging even as electronics and technical textiles widen the application base. Robust demand in Asia-Pacific, expanding regulatory mandates for recycled content, and technology advances in chemical recycling underpin volume expansion. Brand-owner sustainability pledges create predictable offtake for rPET (Recycled Polyethylene Terephthalate), while cost-focused procurement in emerging markets sustains virgin resin demand. Feedstock volatility and substitution threats from PEF (polyethylene furanoate) or aluminum introduce headwinds; nonetheless, investment in closed-loop systems and specialty grades positions the PET (Polyethylene Terephthalate) market for diversified growth.
Global Polyethylene Terephthalate (PET) Market Trends and Insights
Shift Toward Bottle-to-bottle Closed-loop Recycling
Collection rates of 75% for Polyethylene Terephthalate (PET) beverage bottles in Europe during 2024 pushed recycled content in new bottles to 24%, edging toward the 25% mandate effective end-2025. High-quality flakes diverted from tray applications tightened regional supply and kept European rPET (Recycled Polyethylene Terephthalate) premiums near USD 750-800 per ton above virgin resin. Mechanical recycling limits spur investment in catalytic glycolysis and pyrolysis, yet scale-up costs and feedstock variability restrain immediate impact. Multinationals continue to co-finance infrastructure to secure feedstock, redefining long-term procurement strategies within the Polyethylene Terephthalate (PET) market.
Rapid Growth of Aseptic and Hot-fill PET Packaging in Emerging Markets
Emerging markets in Southeast Asia and Latin America accelerate the adoption of heat-set bottles as cold-chain gaps persist. Polyethylene Terephthalate (PET)'s thermal resistance enables ambient shelf life for juices and dairy drinks, reducing spoilage in areas with unreliable electricity. Premium pricing for heat-set grades favors incumbents with specialized equipment, while regulators increasingly cite aseptic packaging as a pillar of food-security policy. The trend widens the Polyethylene Terephthalate (PET) market beyond carbonated beverages and supports regional resin converters investing in stretch-blow molding upgrades.
Volatility in PX (Paraxylene) and MEG (Mono Ethylene Glycol) Feedstock Prices
Paraxylene (PX) and Mono Ethylene Glycol (MEG) account for roughly 85% of PET variable cost, tying margins to crude oil swings. Integrated Asian complexes enjoy logistic advantages, whereas European and North American makers absorb freight and energy premiums. Geopolitical disruptions and shipping constraints recently widened inter-regional price gaps, eroding export competitiveness for standalone plants. Hedging tools offer partial relief but increase contract complexity, particularly for small converters lacking balance-sheet strength.
Other drivers and restraints analyzed in the detailed report include:
- Expansion of Filament-grade PET in Technical Textiles
- Brand-owner Pledges for 50 % rPET (Recycled Polyethylene Terephthalate) Content by 2030
- Substitution Threat from PEF and Aluminum
For complete list of drivers and restraints, kindly check the Table Of Contents.
Segment Analysis
Virgin resin accounted for 76.10% of global shipments in 2025-roughly 23.85 million tons-owing to cost efficiency and uniform quality. Recycled PET, at just under 7.5 million tons, posted the steepest 8.02% CAGR projection as mandates and brand targets raise demand. Europe led adoption, with 39% of locally produced rPET re-entering bottles in 2024, yet tight feedstock and separate-collection gaps sustained price premiums of USD 150-200 per ton over virgin in North America and up to USD 800 per ton in the EU (European Union).
Mechanical recycling limitations in color and contamination have accelerated interest in chemical depolymerization, though capital intensity impedes widespread roll-out before 2028. Investment in food-grade pelletizing lines expands usable rPET fraction, narrowing the cost differential. Virgin suppliers hedge with captive recycling units to secure bale access, reframing competition along the virgin-recycled continuum in the evolving PET market.
The Polyethylene Terephthalate (PET) Market Report is Segmented by Source Type (Virgin PET and Recycled PET), End User Industry (Automotive, Building and Construction, Electrical and Electronics, Industrial and Machinery, and Other End-User Industries), and Geography (North America, South America, Europe, Asia-Pacific, and Middle East and Africa). The Market Forecasts are Provided in Terms of Volume (Tons) and Value (USD).
Geography Analysis
Asia-Pacific dominated with 47.10% of the 2025 volume, nearly 14.8 million tons, due to integrated feedstock capacity and burgeoning consumer demand. China retains the largest production base, while India's consumption accelerates through packaged food growth and recycling investments. Southeast Asian nations such as Indonesia and Thailand add capacity to serve regional beverage and textile hubs. Indorama Ventures strengthened its local footprint via a joint venture with Varun Beverages, illustrating the strategy of coupling scale with local market access.
Europe and North America contribute smaller shares but lead in regulatory frameworks that stimulate rPET uptake. The EU recorded a PET bottle recycling rate of 75% in 2024, driving domestic rPET demand above global norms. High energy and labor costs pressure local producers, but proximity to brand owners seeking low-carbon packaging supports high-value specialty production. North America benefits from shale-based feedstock economics; however, import pressure from Asia tempers margin gains, pushing producers toward technical and recycled grades to remain competitive in the PET market.
The Middle East and Africa region exhibited the fastest 5.05% CAGR outlook. Gulf producers exploit advantaged feedstocks, and companies such as Borouge plan capacity beyond 6.6 million tons per year by 2028, targeting exports to Asia and Africa. Domestic demand rises with urbanization and infrastructure spending, particularly for bottled water and dairy beverages. Political instability and water scarcity pose challenges, yet feedstock economics and geographic location between Europe and Asia provide strategic shipping routes.
- Alpek S.A.B. de C.V.
- CR Chemical Materials Technology Inc.
- Far Eastern New Century Co., Ltd.
- Hengli Group Co. Ltd
- Indorama Ventures Public Company Limited.
- LOTTE Chemical CORPORATION
- Mitsubishi Chemical Group Corporation
- NAN YA Plastics Industrial Co., Ltd.
- Reliance Industries Limited
- SABIC
- Sanfangxiang Group Co., Ltd.
- Sinopec (China Petrochemical Corporation)
- Zhejiang Hengyi Group Co., Ltd.
- Zhink Group Co., Ltd.
Additional Benefits:
- The market estimate (ME) sheet in Excel format
- 3 months of analyst support
TABLE OF CONTENTS
1 Introduction
- 1.1 Study Assumptions and Market Definition
- 1.2 Scope of the Study
2 Research Methodology
3 Executive Summary
4 Market Landscape
- 4.1 Market Overview
- 4.2 Market Drivers
- 4.2.1 Shift Toward Bottle-to-bottle Closed-loop Recycling
- 4.2.2 Rapid Growth of Aseptic and Hot-fill PET Packaging in Emerging Markets
- 4.2.3 Expansion of Filament-grade PET in Technical Textiles
- 4.2.4 Brand-owner Pledges for 50 % rPET Content by 2030
- 4.2.5 Government Mandates on Single-use Plastics Substitution
- 4.3 Market Restraints
- 4.3.1 Volatility in PX and MEG Feedstock Prices
- 4.3.2 Bottle-to-fibre Down-cycling Oversupply Risk
- 4.3.3 Substitution Threat from PEF and Aluminum
- 4.4 Value Chain Analysis
- 4.5 Porter's Five Forces
- 4.5.1 Threat of New Entrants
- 4.5.2 Bargaining Power of Suppliers
- 4.5.3 Bargaining Power of Buyers
- 4.5.4 Threat of Substitutes
- 4.5.5 Competitive Rivalry
- 4.6 Import And Export Trends
- 4.7 Price Trends
- 4.8 Form Trends
- 4.9 Recycling Overview
- 4.10 Regulatory Framework
- 4.11 End-use Sector Trends
- 4.11.1 Aerospace (Aerospace Component Production Revenue)
- 4.11.2 Automotive (Automobile Production)
- 4.11.3 Building and Construction (New Construction Floor Area)
- 4.11.4 Electrical and Electronics (Electrical and Electronics Production Revenue)
- 4.11.5 Packaging(Plastic Packaging Volume)
5 Market Size and Growth Forecasts (Value and Volume)
- 5.1 By Source Type
- 5.1.1 Virgin PET
- 5.1.2 Recycled PET (rPET)
- 5.2 By End User Industry
- 5.2.1 Automotive
- 5.2.2 Building and Construction
- 5.2.3 Electrical and Electronics
- 5.2.4 Industrial and Machinery
- 5.2.5 Packaging
- 5.2.6 Other End-user Industries
- 5.3 By Geography
- 5.3.1 Asia-Pacific
- 5.3.1.1 China
- 5.3.1.2 India
- 5.3.1.3 Japan
- 5.3.1.4 South Korea
- 5.3.1.5 Australia
- 5.3.1.6 Malaysia
- 5.3.1.7 Rest of Asia-Pacific
- 5.3.2 North America
- 5.3.2.1 United States
- 5.3.2.2 Canada
- 5.3.2.3 Mexico
- 5.3.3 Europe
- 5.3.3.1 Germany
- 5.3.3.2 France
- 5.3.3.3 United Kingdom
- 5.3.3.4 Italy
- 5.3.3.5 Russia
- 5.3.3.6 Rest of Europe
- 5.3.4 South America
- 5.3.4.1 Brazil
- 5.3.4.2 Argentina
- 5.3.4.3 Rest of South America
- 5.3.5 Middle East and Africa
- 5.3.5.1 Saudi Arabia
- 5.3.5.2 United Arab Emirates
- 5.3.5.3 South Africa
- 5.3.5.4 Nigeria
- 5.3.5.5 Rest of Middle East and Africa
- 5.3.1 Asia-Pacific
6 Competitive Landscape
- 6.1 Market Concentration
- 6.2 Strategic Moves
- 6.3 Market Share (%)**/Ranking Analysis
- 6.4 Company Profiles (includes Global Level Overview, Market Level Overview, Core Segments, Financials as available, Strategic Information, Market Rank/Share for key companies, Products and Services, and Recent Developments)
- 6.4.1 Alpek S.A.B. de C.V.
- 6.4.2 CR Chemical Materials Technology Inc.
- 6.4.3 Far Eastern New Century Co., Ltd.
- 6.4.4 Hengli Group Co. Ltd
- 6.4.5 Indorama Ventures Public Company Limited.
- 6.4.6 LOTTE Chemical CORPORATION
- 6.4.7 Mitsubishi Chemical Group Corporation
- 6.4.8 NAN YA Plastics Industrial Co., Ltd.
- 6.4.9 Reliance Industries Limited
- 6.4.10 SABIC
- 6.4.11 Sanfangxiang Group Co., Ltd.
- 6.4.12 Sinopec (China Petrochemical Corporation)
- 6.4.13 Zhejiang Hengyi Group Co., Ltd.
- 6.4.14 Zhink Group Co., Ltd.
7 Market Opportunities and Future Outlook
- 7.1 White-space and Unmet-Need Assessment
- 7.2 AI-driven Technologies to Optimize Processes
8 Key Strategic Questions for CEOs
 再生聚對苯二甲酸乙二醇酯市場:2026-2032年全球市場預測(依原料種類、形態、等級、製造流程、顏色及應用分類)
 2026年全球聚對苯二甲酸乙二醇酯(PET)杯市場報告
 全球聚對苯二甲酸乙二醇酯(PET)市場規模、佔有率、趨勢和成長分析報告(2026-2034年)
 聚對苯二甲酸乙二醇酯(PET)杯市場規模、佔有率和成長分析:按杯子設計與應用、原料、製造技術、最終用途和地區分類-2026-2033年產業預測
 生物基聚對苯二甲酸丙二醇酯(BioPTT)市場:市場規模-按地區、應用和預測至2034年
 聚對苯二甲酸乙二醇酯市場分析及預測(至2035年):類型、產品類型、應用、形態、材料類型、製程、最終用戶、功能、安裝類型
 南美洲聚對苯二甲酸乙二酯(PET):市場佔有率分析、產業趨勢與統計、成長預測(2026-2031)非洲聚對苯二甲酸乙二醇酯(PET):市場佔有率分析、產業趨勢與統計、成長預測(2026-2031)全球再生聚對苯二甲酸乙二醇酯市場規模、佔有率、趨勢和成長分析報告(2026-2034年)2026年全球再生聚對苯二甲酸乙二酯市場報告