


 |
市場調查報告書
商品編碼
1906947
北美資料中心電力市場:佔有率分析、產業趨勢、統計數據和成長預測(2026-2031 年)North America Data Center Power - Market Share Analysis, Industry Trends & Statistics, Growth Forecasts (2026 - 2031) |
||||||
※ 本網頁內容可能與最新版本有所差異。詳細情況請與我們聯繫。
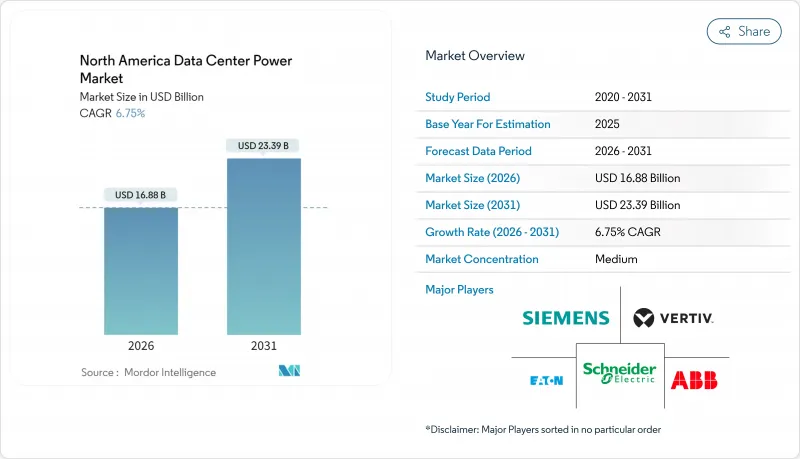
預計到 2026 年,北美資料中心電力市場規模將達到 168.8 億美元,高於 2025 年的 158.1 億美元,預計到 2031 年將達到 233.9 億美元,2026 年至 2031 年的複合年成長率為 6.75%。
強勁的成長主要得益於以人工智慧為中心的工作負載,這些工作負載正將機架密度從 5-15kW 推高至 40-140kW,迫使營運商對其電力架構進行現代化改造。超大規模園區正在建造千兆瓦級變電站以滿足需求,而邊緣運算則正在部署需要獨立 UPS 和發電機組的微型站點。嚴格的能源效率法規,例如 PUE閾值,正在加速液冷技術和電池儲能 (BESS) 的普及應用。在德克薩斯州、魁北克省和亞伯達省簽署的可再生能源購電協議 (PPA) 正在幫助企業實現其永續性目標,同時對沖電價波動風險。主要都會區日益成長的電網容量限制正在推動企業向美國次市場市場、水力資源豐富的加拿大省份以及墨西哥新興的託管地點擴張。
北美資料中心電力市場趨勢與洞察
超大規模和超級資料中心的日益普及
超大規模營運商目前正規劃興建多棟建築組成的園區,這些園區由現場變電站提供數百兆瓦的電力,並部署需要持續、高品質電力供應的液冷GPU機架。 Meta公司斥資650億美元,目標是將其北美所有園區的PUE值控制在1.1以下,這表明電力設計已成為永續性的基石。例如,位於亞伯達的Wonder Valley Park計劃,將天然氣燃氣渦輪機與地熱循環相結合,創造了1.4吉瓦的專用容量,凸顯了在電網延遲超過四年的情況下,向自發電模式的轉變。園區圍繞著廉價可再生能源的聚集造成了區域負載集中,迫使電力公司透過更早的電網升級來應對這些負載。提供工廠整合開關設備、母線槽和儲能模組的供應商,透過縮短電氣化流程和減少現場工作,正在贏得市場佔有率。不斷成長的投資也推動了軟體定義電力監控系統的應用,這些系統可以最佳化負載配置並實現發電機排序,從而防止電網閃爍。
雲端運算與OTT流量的爆炸性成長
協作工具、串流媒體和生成式人工智慧推理的快速發展正迫使通訊業者和雲端服務供應商將運算資源部署到更靠近終端用戶的位置。功率範圍從 250kW 到 1MW 的邊緣節點正安裝在零售商場、通訊樞紐和市政候車亭中,每個節點都配備了鋰離子不間斷電源 (UPS)、小型發電機和遠端系統管理韌體。由於電力線路電壓穩定性差異很大且斷電頻率高,分散式站點的容量規劃變得更加複雜。營運商正在利用雙饋自動換接開關和基於雲端的 SCADA 控制面板來降低風險,這些控制面板可以匯總數百個微型設施的警報資訊。加速的內容傳送也需要更高的突發功率來應對轉碼器轉換期間的功率突波,這推動了基於毫秒切換的靜態開關 UPS 拓撲結構的應用。數千個邊緣站點的累積效應增加了全部區域負荷,同時每個站點都必須遵守各州能源法規,這些法規對允許的 PUE閾值要求更加嚴格。
維修電力和冷卻設備需要較高的初始資本投入。
許多現有資料中心的設計機架功率為 5-15kW,若要滿足 40-140kW 的人工智慧負載,則需要進行大規模維修。電氣室通常需要增加變壓器、重新佈線母線槽,以及將風冷式精密空調機組更換為液冷式冷卻器,這些計劃專案成本高於運作中新建設的基準值。營運商被迫分階段進行建設以適應持續的工作負載,從而延長工期並增加風險。小規模的供應商在沒有客戶或政府主要獎勵的情況下,難以資金籌措進行大規模的電氣升級。即使資金到位,24kV 開關設備和 3MVA UPS 機架的供應鏈前置作業時間也可能超過 60 週。這種即時的現金支出阻礙了人工智慧最佳化電源解決方案在短期內進入市場。
細分市場分析
配電解決方案(開關設備、配電單元、母線槽)是任何設施的電氣基礎,預計到2025年將佔總收入的44.40%。然而,隨著業主對設計、整合和預測性維護的專業知識需求增加,服務業務正以6.98%的複合年成長率快速成長。諮詢服務在施工開始前數月就已啟動,涵蓋諧波分析、短路研究和儲能投資報酬率建模。整合專家負責在多相建設專案中建立「單線圖」的完整性,以避免閒置容量。支援團隊將邊緣分析技術嵌入到UPS模組中,產生數據,並在服務等級協定(SLA)失效前自動產生工單。這些附加價值服務提高了客戶留存率,並將硬體供應商轉變為長期合作夥伴。
供應商將韌體升級捆綁銷售,以實現更高級的正常運作計算,從而延長電池壽命並縮短更換週期。在勞動力嚴重短缺的地區,遠端維護合約可提供紅外線掃描、斷路器操作和過熱保護等服務。北美資料中心電力市場受益於服務獎勵模式,該模式能夠平滑大型企劃週期之間的收入波動,激勵企業在當地維持大規模的員工隊伍,並確保為超大規模客戶提供快速回應。
到2025年,超大規模資料中心園區將佔據47.55%的市場佔有率,這反映了其龐大的規模和標準化的電源模組。然而,隨著人工智慧推理將運算任務轉移到消費者端,邊緣資料中心和微型資料中心將以6.92%的複合年成長率實現最快的成長。為了最大限度地減少面積,這些小型資料中心採用208/415V的配電系統和高效的線上互動式UPS,而不是超大規模資料中心常用的13.8kV饋線和雙轉換UPS。因此,北美資料中心電力市場的規模正在向邊緣端擴展,不僅體現在兆瓦級,也體現在單元級。
同時,企業設施正在採用混合模式,擴展電力容量以支援私有雲端叢集,同時將對延遲敏感的任務卸載到附近的邊緣節點。營運商正在採用模組化電池櫃,可以以 100kW 為增量進行擴展,以適應 IT 的逐步擴展。超大規模資料中心建造者正在將直接可再生能源供電與短時飛輪式 UPS 結合,以降低營運成本。融合的設計理念使供應商能夠提供共用韌體和監控 API 的開關設備和 UPS“系列”,從而降低不同類型設施的整合成本。
其他福利:
- Excel格式的市場預測(ME)表
- 分析師支持(3個月)
目錄
第1章 引言
- 研究假設和市場定義
- 調查範圍
第2章調查方法
第3章執行摘要
第4章 市場情勢
- 市場概覽
- 市場促進因素
- 超大規模和超級資料中心的日益普及
- 雲端運算和OTT流量爆炸
- 嚴格的PUE/能源效率法規
- 由於銀行、金融和保險 (BFSI) 以及醫療保健行業的數位化,對託管服務的需求不斷成長。
- 公用事業規模的可再生能源購電協議有助於穩定電力成本。
- 在區域和郊區叢集中部署邊緣人工智慧微型資料中心
- 市場限制
- 維修電力和冷卻設備需要較高的初始資本投資成本。
- 主要大都會地區的輸電能力瓶頸
- 持證高壓技術員短缺
- 深入了解水冷散熱的隱性功耗損失
- 價值/供應鏈分析
- 監管環境
- 技術展望
- 波特五力模型
- 供應商的議價能力
- 買方的議價能力
- 新進入者的威脅
- 替代品的威脅
- 競爭對手之間的競爭
- 地緣政治對華盛頓特區基礎設施的影響
- 產業生態系分析
5. 北美資料中心安裝分析
- 北美資料中心現況分析(基於IT負載能力和資料中心數量)
- 北美射線熱點分析(該地區前 15 個熱點)
- 北美資料中心基礎設施總支出分析
第6章 市場規模與成長預測
- 按類型
- 按解決方案類型
- 配電解決方案
- 傳輸開關
- 開關設備
- 配電盤和組件
- 其他
- 備用電源解決方案
- UPS
- 發電機
- 配電解決方案
- 服務:設計與諮詢、系統整合、支援與維護
- 按解決方案類型
- 依資料中心類型
- 託管設施
- 企業/邊緣設施
- 超大規模/自建設施
- 按最終用戶行業分類
- BFSI
- 資訊科技和電信
- 政府/國防
- 製造業和工業部門
- 媒體與娛樂
- 醫療保健和生命科學
- 零售與電子商務
- 按功率容量
- 500千瓦或以下
- 501kW~1MW
- 1.1~3 MW
- 超過3兆瓦
- 按層級標準
- 一級和二級
- Tier III
- Tier IV
- 按國家/地區
- 美國
- 加拿大
- 墨西哥
第7章 競爭情勢
- 市佔率分析
- 公司簡介
- ABB Ltd
- Schneider Electric
- Vertiv Group Corp.
- Eaton Corp.(incl. Tripp Lite)
- Legrand(Raritan, Starline)
- nVent(Enlogic)
- Siemens AG
- Cummins Inc.
- Caterpillar Inc.
- Generac Power Systems
- Mitsubishi Electric
- Delta Electronics
- Huawei Technologies Co. Ltd.
- Piller Power Systems
- Kohler Co.
- LayerZero Power Systems
- Socomec Group
- Panduit Corp.
- Riello UPS
- Power Innovations International
- Starline(Legrand)
- Powin Energy
- Bloom Energy
第8章:市場機會與未來展望
- 閒置頻段與未滿足需求評估
The North America data center power market size in 2026 is estimated at USD 16.88 billion, growing from 2025 value of USD 15.81 billion with 2031 projections showing USD 23.39 billion, growing at 6.75% CAGR over 2026-2031.
Solid growth is tied to AI-centric workloads that push rack densities from 5-15 kW to 40-140 kW, forcing operators to modernize electrical architectures. Hyperscale campuses anchor demand as they build gigawatt-scale substations, while edge computing rolls out micro sites that need autonomous UPS and generator sets. Stricter efficiency regulations such as PUE thresholds are accelerating liquid-cooling adoption and battery-energy-storage integration. Renewable power purchase agreements (PPAs) signed in Texas, Quebec, and Alberta have become a hedge against volatile utility tariffs while meeting corporate sustainability goals. Heightened grid-capacity constraints in tier-1 metros now shift expansion toward secondary U.S. markets, hydro-rich Canadian provinces, and Mexico's emerging colocation hubs.
North America Data Center Power Market Trends and Insights
Rising Adoption of Hyperscale and Mega Data Centers
Hyperscale operators now plan multi-building campuses that draw hundreds of megawatts from on-site substations and deploy liquid-cooled GPU racks requiring continuous, high-quality power. Meta's USD 65 billion program targets sub-1.1 PUE across North American sites, underscoring how power design has become a cornerstone of sustainability commitments.Projects such as Alberta's Wonder Valley park pair natural-gas turbines with geothermal loops to create 1.4 GW of dedicated capacity, illustrating a shift toward self-generation when grid queues exceed four years. The clustering of campuses around cheap renewable resources generates regional load pockets that utilities must accommodate through accelerated transmission upgrades. Vendors that deliver factory-integrated switchgear, busways, and energy-storage modules win share by shortening electrification timelines and reducing site labor. The scale of investment also drives adoption of software-defined power monitoring that optimizes load placement and sequence-starts generators to prevent grid flicker.
Surge in Cloud Computing and OTT Traffic
Rapid growth in collaboration tools, streaming media, and generative AI inference pushes carriers and cloud providers to place compute closer to end users. Edge nodes ranging from 250 kW to 1 MW are now installed in retail strips, telco hubs, and municipal shelters, each fitted with lithium-ion UPS, compact gensets, and remote-management firmware. Distributed sites complicate capacity planning because utility feeders vary widely in voltage stability and outage frequency. Operators mitigate risk with dual-feed automatic transfer switches and cloud-based SCADA dashboards that aggregate alarms across hundreds of micro facilities. Content delivery acceleration also demands higher burst power to cover codec transcoding spikes, prompting adoption of static-switch UPS topologies that deliver millisecond transfer times. The cumulative effect of thousands of edge sites lifts overall regional load, yet each location must comply with state energy codes that increasingly cap allowable PUE thresholds.
High Upfront CAPEX for Power & Cooling Retrofits
Many brownfield data centers were designed for 5-15 kW racks and must be gutted to accommodate 40-140 kW AI loads. Electrical rooms often need transformer upsizing, busway rerouting, and replacement of air-cooled CRAC units with liquid chillers, driving project costs above new-build benchmarks. Operators must stage construction around live workloads, lengthening schedules and elevating risk. Smaller providers struggle to secure financing for large-scale electrical upgrades without anchor customers or government incentives. Even where funding is available, supply-chain lead times for 24-kV switchgear and 3 MVA UPS frames can exceed 60 weeks. The immediate cash outlay thus curbs near-term market penetration of AI-optimized power solutions.
Other drivers and restraints analyzed in the detailed report include:
- Stringent PUE / Energy-Efficiency Mandates
- Colocation Demand from BFSI and Healthcare Digitalization
- Grid-Capacity Bottlenecks in Tier-1 Metros
For complete list of drivers and restraints, kindly check the Table Of Contents.
Segment Analysis
The segment holding 44.40% of 2025 revenue remains power-distribution solutions-switchgear, PDU, and busway-that form the electrical backbone of every facility. However, services are expanding at a 6.98% CAGR because owners need design, integration, and predictive-maintenance expertise. Consulting engagements now begin months before ground-break, covering harmonic analysis, short-circuit studies, and energy-storage ROI modeling. Integration specialists engineer "single-line-diagram" conformity across multi-phase build-outs to avoid stranded capacity. Support teams embed edge analytics in UPS modules, generating data that auto-creates work orders before SLA breaches. Those value-added services raise stickiness, turning hardware suppliers into long-term partners.
Vendors bundle firmware upgrades that enable advanced runtime calculations, extending battery life and cutting replace-ment cycles. Where labor availability is tight, remote-hands contracts cover IR scanning, breaker racking, and thermal runway avoidance. The North America data center power market benefits because service annuities smooth revenue between mega-project cycles, incentivizing firms to maintain large regional field forces that in turn reassure hyperscale clients of rapid response times.
Hyperscale campuses held 47.55% share in 2025, reflecting their sheer size and standardized power blocks. Yet edge and micro data centers deliver the fastest 6.92% CAGR as AI inference shifts compute toward consumers. These pods rely on 208/415 V distribution with high-efficiency line-interactive UPS to minimize footprint, contrasting with 13.8 kV feeders and double-conversion UPS found in hyperscale builds. The North America data center power market size for edge form factors thus grows on a unit-count basis rather than megawatt alone.
In parallel, enterprise facilities embrace hybrid models, expanding electrical capacity to host private-cloud clusters while off-loading latency-sensitive tasks to nearby edge nodes. Operators adopt modular battery cabinets that scale in 100 kW increments, matching phased IT expansions. Hyperscale builders experiment with direct renewable feeders combined with short-duration flywheel UPS to shave opex. The convergence of design philosophies drives suppliers to offer "families" of switchgear and UPS that share firmware and monitoring APIs, cutting integration costs across facility classes.
The North America Data Center Power Market Report is Segmented by Type (Solution, and Service), Data Center Type (Colocation, Hyperscale, and More), End-User Industry (BFSI, IT and Telecom, and More), Power Capacity (<= 500 KW, Greater Than 3 MW, and More), Tier Standard (Tier I and II, Tier IV, and More), and Geography (United States, Canada and More). Market Forecasts are Provided in Terms of Value (USD).
List of Companies Covered in this Report:
- ABB Ltd
- Schneider Electric
- Vertiv Group Corp.
- Eaton Corp. (incl. Tripp Lite)
- Legrand (Raritan, Starline)
- nVent (Enlogic)
- Siemens AG
- Cummins Inc.
- Caterpillar Inc.
- Generac Power Systems
- Mitsubishi Electric
- Delta Electronics
- Huawei Technologies Co. Ltd.
- Piller Power Systems
- Kohler Co.
- LayerZero Power Systems
- Socomec Group
- Panduit Corp.
- Riello UPS
- Power Innovations International
- Starline (Legrand)
- Powin Energy
- Bloom Energy
Additional Benefits:
- The market estimate (ME) sheet in Excel format
- 3 months of analyst support
TABLE OF CONTENTS
1 INTRODUCTION
- 1.1 Study Assumptions and Market Definition
- 1.2 Scope of the Study
2 RESEARCH METHODOLOGY
3 EXECUTIVE SUMMARY
4 MARKET LANDSCAPE
- 4.1 Market Overview
- 4.2 Market Drivers
- 4.2.1 Rising adoption of hyperscale and mega data centers
- 4.2.2 Surge in cloud computing and OTT traffic
- 4.2.3 Stringent PUE / energy-efficiency mandates
- 4.2.4 Colocation demand from BFSI and healthcare digitalization
- 4.2.5 Utility-scale renewable PPAs stabilising power costs
- 4.2.6 Edge-AI micro DC rollout in rural and suburban clusters
- 4.3 Market Restraints
- 4.3.1 High upfront CAPEX for power and cooling retrofits
- 4.3.2 Grid-capacity bottlenecks in Tier-1 metros
- 4.3.3 Shortage of certified high-voltage technicians
- 4.3.4 Water-based cooling's hidden power penalty scrutiny
- 4.4 Value / Supply-Chain Analysis
- 4.5 Regulatory Landscape
- 4.6 Technological Outlook
- 4.7 Porter's Five Forces
- 4.7.1 Bargaining Power of Suppliers
- 4.7.2 Bargaining Power of Buyers
- 4.7.3 Threat of New Entrants
- 4.7.4 Threat of Substitutes
- 4.7.5 Intensity of Competitive Rivalry
- 4.8 Geopolitical Impact on DC Infrastructure
- 4.9 Industry Ecosystem Analysis
5 ANALYSIS OF DATA CENTER FOOTPRINT IN NORTH AMERICA
- 5.1 Analysis of current DC footprint in terms of IT load capacity and of Data Centers in the North America
- 5.2 Analysis of ley hotspots in the North America (top 15 hotspots will be analyzed in the region)
- 5.3 Analysis of overall spending on Data Center Infrastructure in North America
6 MARKET SIZE AND GROWTH FORECASTS (VALUE, USD)
- 6.1 By Type
- 6.1.1 By Solution Type
- 6.1.1.1 Power Distribution Solutions
- 6.1.1.1.1 Transfer Switches
- 6.1.1.1.2 Switchgear
- 6.1.1.1.3 Power Panels and Components
- 6.1.1.1.4 Others
- 6.1.1.2 Power Backup Solutions
- 6.1.1.2.1 UPS
- 6.1.1.2.2 Generators
- 6.1.1.1 Power Distribution Solutions
- 6.1.2 Service - Design and Consulting, Integration, Support and Maintenance
- 6.1.1 By Solution Type
- 6.2 By Data Center Type
- 6.2.1 Colocation Facilities
- 6.2.2 Enterprise/Edge Facilities
- 6.2.3 Hyperscale/Self-built Facilities
- 6.3 By End-User Industry
- 6.3.1 BFSI
- 6.3.2 IT and Telecom
- 6.3.3 Government and Defense
- 6.3.4 Manufacturing and Industrial
- 6.3.5 Media and Entertainment
- 6.3.6 Healthcare and Life Sciences
- 6.3.7 Retail and E-commerce
- 6.4 By Power Capacity
- 6.4.1 less than or equal to 500 kW
- 6.4.2 501 kW - 1 MW
- 6.4.3 1.1 - 3 MW
- 6.4.4 greater than 3 MW
- 6.5 By Tier Standard
- 6.5.1 Tier I and II
- 6.5.2 Tier III
- 6.5.3 Tier IV
- 6.6 By Country
- 6.6.1 United States
- 6.6.2 Canada
- 6.6.3 Mexico
7 COMPETITIVE LANDSCAPE
- 7.1 Market Share Analysis
- 7.2 Company Profiles (includes Global level Overview, Market level overview, Core Segments, Financials as available, Strategic Information, Market Rank/Share for key companies, Products and Services, and Recent Developments)
- 7.2.1 ABB Ltd
- 7.2.2 Schneider Electric
- 7.2.3 Vertiv Group Corp.
- 7.2.4 Eaton Corp. (incl. Tripp Lite)
- 7.2.5 Legrand (Raritan, Starline)
- 7.2.6 nVent (Enlogic)
- 7.2.7 Siemens AG
- 7.2.8 Cummins Inc.
- 7.2.9 Caterpillar Inc.
- 7.2.10 Generac Power Systems
- 7.2.11 Mitsubishi Electric
- 7.2.12 Delta Electronics
- 7.2.13 Huawei Technologies Co. Ltd.
- 7.2.14 Piller Power Systems
- 7.2.15 Kohler Co.
- 7.2.16 LayerZero Power Systems
- 7.2.17 Socomec Group
- 7.2.18 Panduit Corp.
- 7.2.19 Riello UPS
- 7.2.20 Power Innovations International
- 7.2.21 Starline (Legrand)
- 7.2.22 Powin Energy
- 7.2.23 Bloom Energy
8 MARKET OPPORTUNITIES AND FUTURE OUTLOOK
- 8.1 White-space and Unmet-Need Assessment
 資料中心電源市場:按組件類型、層級、資料中心類型和行業分類 - 全球市場預測(2026-2032 年)
 資料中心電源市場分析及預測(至2035年):類型、產品類型、服務、技術、組件、應用、部署模式、最終用戶、解決方案、交付模式
 2026年全球資料中心電力市場報告2026年全球資料中心電源管理市場報告伺服器電源市場:依產品類型、組件、額定功率、外形規格、應用、最終用戶和通路分類-2026-2030年全球預測資料中心以AC-DC電源市場:按組件、電源類型、冗餘方式和應用分類-2026-2032年全球預測資料中心電源系統氮化鎵市場分析及預測(至2035年):依類型、產品、服務、技術、組件、應用、形式、材料類型、裝置及部署方式分類
 全球資料中心電力市場規模、佔有率、趨勢和成長分析報告(2026-2034)全球資料中心電力市場:市場規模、佔有率、成長率、產業分析、依類型、應用和地區劃分的分析及預測(2026-2034 年)
 資料中心結構化佈線市場 - 全球產業規模、佔有率、趨勢、機會及預測(按組件、線纜類型、最終用戶、地區和競爭格局分類,2021-2031年)