


 |
市場調查報告書
商品編碼
1906937
氦氣:市場佔有率分析、產業趨勢與統計、成長預測(2026-2031)Helium - Market Share Analysis, Industry Trends & Statistics, Growth Forecasts (2026 - 2031) |
||||||
※ 本網頁內容可能與最新版本有所差異。詳細情況請與我們聯繫。
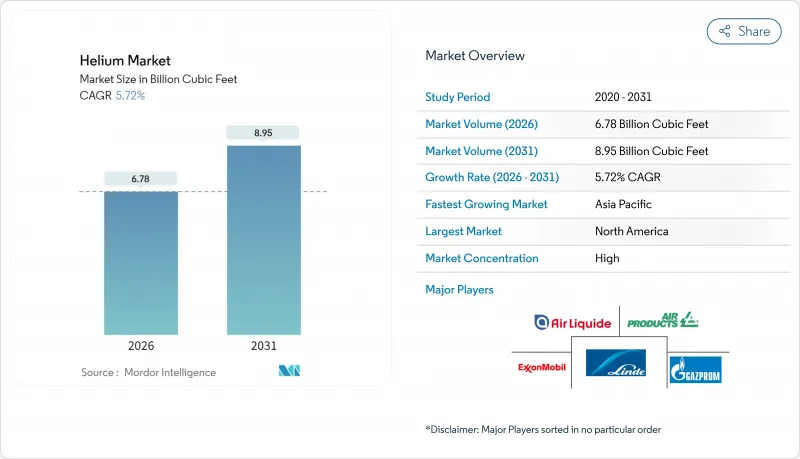
2025年氦氣市場價值將達到64.1億立方英尺,預計到2026年將成長至67.8億立方英尺,到2031年將成長至89.5億立方英尺。
預計在預測期(2026-2031 年)內,複合年成長率將達到 5.72%。
這主要得益於半導體製造、醫療成像、商業航太發射和量子計算等領域的強勁需求,這些領域都依賴氦氣的超低沸點和化學惰性。由於全球氦氣生產由不到15家生產商控制,以及美國聯邦氦氣儲備於2024年私有化,取消了補貼儲備,氦氣市場持續面臨供應波動。南非、卡達和俄羅斯的新增產能暫時緩解了供不應求,但結構性集中仍然促使用戶更加關注長期合約和循環投資。美國《晶片法案》(CHIPS Act)、歐洲《晶片法案》以及一些亞洲政府獎勵計劃推動了半導體產能的擴張,從而刺激了需求;同時,中等收入國家核磁共振造影系統的普及也幫助醫療保健行業保持了其作為最大終端用戶的地位。
全球氦氣市場趨勢與洞察
東亞半導體製造廠建設快速擴張
中國大陸、台灣、日本和韓國的晶圓代工廠擴張正在推動氦氣市場的發展。半導體晶圓廠依賴氣態氦進行晶圓清洗、光刻氣氛控制和電漿蝕刻。英特爾、台積電和三星正在美國和亞洲建造新的晶圓廠,這些晶圓廠的建設資金來自《晶片製造和整合計畫法案》(CHIPS Act)和區域性計畫。每座晶圓廠在運作週期內都需要數億標準立方英尺的高純度氦氣。台灣地區的產業群聚效應進一步放大了該地區的氦氣需求,因為先進的封裝生產線在晶粒鍵合和封裝製程中需要消耗氦氣。總體而言,隨著製程節點的不斷縮小,半導體消費量也在增加,這將確保到2030年氦氣市場的需求保持兩位數成長。
擴大中等收入國家核磁共振造影系統的使用
儘管消費量氦量更少的新技術問世,亞太、拉丁美洲和非洲的醫院仍在不斷安裝核磁共振造影系統,以滿足慢性病診斷的需求。傳統的1.5噸重的MRI設備在安裝過程中需要1500至2000公升液氦,在運作使用壽命期間的耗氦量高達1萬升。可回收92%蒸發氣體的節能型設備在三級醫療機構中越來越受歡迎,但其近10萬美元的初始成本限制了其在學術機構的應用。通用電氣醫療集團的「Freelium」和西門子醫療的「DryCool」平台可將氦氣消耗量降低99%,但由於設備更新換代速度緩慢,預計未來十年傳統磁鐵系統仍將是主流。
蘊藏量有限且集中在少數國家
已知氦氣蘊藏量約70%集中在美國、卡達、阿爾及利亞和俄羅斯,地緣政治影響和供應操縱對氦氣市場有直接影響。中國95%的氦氣需求依賴進口,使其面臨外交摩擦和海上物流風險。歐盟對俄羅斯氦氣的製裁就是一個鮮明的例子,說明政策如何能大幅改變貿易路線並推高價格。隨著脫碳政策導致天然氣產量下降,與天然氣伴生的氦氣很可能繼續被封存在地下。回收可以減少廢棄物,但並不能創造新的原生氦氣供應,進一步凸顯了策略儲備的必要性。
細分市場分析
到2025年,氣態氦將佔總銷售量的70.65%,這反映了其在增壓、吹掃和洩漏測試等領域的廣泛應用。由於先進製程節點對污染容忍度要求更加嚴格,氣態氦正以6.03%的複合年成長率成長,從而保持其在製程氣體市場的領先地位。此外,航太焊接和積層製造流程也受益於氦氣的高導熱性,這些製程能夠實現深而窄的焊接輪廓,從而推動了氣態氦市場的發展。
氫燃料測試和電動車電池洩漏檢測等新興應用將推動需求成長,進一步鞏固氣態氦在預測期內的市場主導地位。核磁共振造影系統的增加、量子系統的規模化應用以及高能量物理實驗室的發展將支持液氦的基礎設施需求。儘管現場液化設備和效率高達92%的回收撬裝設備的日益普及將減少蒸發損失,但絕對需求仍將持續成長。
此氦氣報告按狀態(液態氦、氣態氦)、應用(呼吸混合物、低溫技術、洩漏檢測、加壓和吹掃、焊接等)、終端用戶行業(航太航太、電子半導體、核能、醫療、焊接和金屬加工等)以及地區(亞太地區、北美、歐洲等)進行分析。
區域分析
2025年,北美將佔據全球38.55%的市場佔有率,這得益於其全球最大的已探明蘊藏量和成熟的中游基礎設施。 2024年聯邦氦氣儲備私有化改變了採購環境,迫使終端用戶直接與私營生產商以市場價格進行談判,但Honeywell的Dry Pine計劃和落基山脈的小規模計劃正在填補這一缺口。亞利桑那州、俄亥俄州和德克薩斯州半導體工廠的建設進一步推動了區域消費成長。
預計到2031年,亞太地區將以7.05%的複合年成長率實現最高成長,主要得益於中國、日本、印度和韓國半導體、衛星製造和醫療影像設備生產的擴張。中國95%的進口依賴促使其將合約多元化和在工業園區部署微液化設備視為戰略要務。日本對下一代記憶體製造廠的激勵措施正在推動氦氣支出,而印度新興的製造生態系統和蓬勃發展的醫療產業也在推動需求。對傳統型氦礦(主要位於澳洲和坦尚尼亞)的區域投資旨在對沖供應風險。
由於制裁導致俄羅斯氦氣供應中斷,歐洲正面臨供應鏈結構重組。儘管供應有限,終端用戶正從卡達和美國墨西哥灣沿岸採購氦氣,並透過增加運輸成本和建立本地回收設施來應對價格波動。
其他福利:
- Excel格式的市場預測(ME)表
- 3個月的分析師支持
目錄
第1章 引言
- 研究假設和市場定義
- 調查範圍
第2章調查方法
第3章執行摘要
第4章 市場情勢
- 市場概覽
- 市場促進因素
- 東亞半導體製造廠建設快速擴張
- 擴大核磁共振造影系統的應用:中等收入醫院的發展
- 商業航太發射的蓬勃發展增加了對液態氦的需求。
- 量子計算低溫恆溫器從實驗室走向中試生產線
- 用於中子探測和核融合研究與開發的試點規模氦-3提取。
- 市場限制
- 蘊藏量有限且集中在少數國家
- 替代方案的液化和物流成本高
- 更嚴格的廢氣法規限制了氦氣的共同生產。
- 價值鏈分析
- 波特五力模型
- 供應商的議價能力
- 消費者議價能力
- 新進入者的威脅
- 替代品的威脅
- 競爭程度
第5章 市場規模與成長預測
- 按階段
- 液態氦
- 氦氣
- 透過使用
- 呼吸氣體混合物
- 低溫學
- 洩漏檢測
- 增壓和排氣
- 焊接
- 受控氣氛
- 其他用途
- 按最終用戶行業分類
- 航太/飛機
- 電子和半導體
- 核能發電
- 衛生保健
- 焊接與金屬加工
- 其他終端用戶產業
- 按地區
- 亞太地區
- 中國
- 印度
- 日本
- 韓國
- 馬來西亞
- 台灣
- 泰國
- 印尼
- 越南
- 澳洲
- 紐西蘭
- 亞太其他地區
- 北美洲
- 美國
- 加拿大
- 墨西哥
- 歐洲
- 德國
- 英國
- 義大利
- 法國
- 波蘭
- 西班牙
- 俄羅斯
- 其他歐洲地區
- 南美洲
- 巴西
- 阿根廷
- 其他南美洲
- 中東和非洲
- 沙烏地阿拉伯
- 埃及
- 南非
- 其他中東和非洲地區
- 亞太地區
第6章 競爭情勢
- 市場集中度
- 策略趨勢
- 市佔率(%)/排名分析
- 公司簡介
- Air Liquide
- Air Products and Chemicals, Inc.
- AIR WATER INC
- Buzwair Industrial Gases Factories
- ExxonMobil Corporation
- Gazprom
- Gulf Cryo
- Iwatani Corporation
- Linde plc
- Matheson Tri-Gas Inc.
- Messer Group
- North American Helium
- PGNiG SA
- QatarEnergy LNG
- Renergen
- Weil Group Resources
第7章 市場機會與未來展望
The Helium Market was valued at 6.41 Billion Cubic Feet in 2025 and estimated to grow from 6.78 Billion Cubic Feet in 2026 to reach 8.95 Billion Cubic Feet by 2031, at a CAGR of 5.72% during the forecast period (2026-2031).
Robust demand stems from semiconductor manufacturing, medical imaging, commercial space launch, and quantum computing, each relying on helium's ultra-low boiling point and chemical inertness. The helium market continues to face supply volatility because fewer than 15 producers dominate global output, and the 2024 privatization of the U.S. Federal Helium Reserve removed subsidized stock from the system. New capacity from South Africa, Qatar, and Russia is temporarily easing scarcity, but structural concentration keeps users focused on long-term contracts and recycling investments. Semiconductor capacity additions under the U.S. CHIPS Act, the European Chips Act, and multiple Asian government incentive programs intensify demand, while MRI fleet growth in mid-income nations sustains healthcare's position as the largest end-user.
Global Helium Market Trends and Insights
Explosive Semiconductor Fab Build-Out in East Asia
Foundry expansions in China, Taiwan, Japan, and South Korea are propelling the helium market as chip plants rely on gaseous helium for wafer cleaning, lithography atmosphere control, and plasma etching. Intel, TSMC, and Samsung are building new U.S. and Asian fabs funded by the CHIPS Act and parallel regional programs, each fab requiring hundreds of millions of standard cubic feet of high-purity helium over its lifecycle. Taiwan's clustering effect compounds regional demand, as advanced packaging lines consume helium for die bonding and encapsulation. Overall, semiconductor consumption intensity increases with each node shrink, locking in double-digit demand growth for the helium market through 2030.
MRI Fleet Expansion Across Mid-Income Hospitals
Hospitals in Asia-Pacific, Latin America, and Africa are adding MRI scanners to meet chronic disease diagnostics despite newer helium-light technologies. A conventional 1.5-ton unit needs 1,500-2,000 liters of liquid helium at installation and up to 10,000 liters across its service life. Helium conservation skids that recapture 92% of boil-off gas are spreading to tertiary hospitals, although upfront costs near USD 100,000 restrict adoption mainly to teaching centers. GE HealthCare's Freelium and Siemens Healthineers' DryCool platforms cut helium usage by 99%, yet slow fleet turnover leaves conventional magnets dominant into the next decade.
Finite Reserves and Concentration in a Few Countries
Roughly 70% of known helium reserves sit in the United States, Qatar, Algeria, and Russia, fostering geopolitical leverage and supply manipulation that directly influence the helium market. China imports 95% of its helium needs, underscoring exposure to diplomatic friction and maritime logistics risks. EU sanctions on Russian helium illustrate how quickly policy can reroute trade and spike prices. Co-produced helium may remain trapped underground as natural-gas production tapers under decarbonization agendas. Recycling can cut wastage, but cannot create a new primary supply, reinforcing the imperative for strategic reserves.
Other drivers and restraints analyzed in the detailed report include:
- Commercial Space-Launch Boom Raising Liquid-He Demand
- Quantum-Computing Cryostats Moving from Lab to Pilot Lines
- Tightened Flare-Gas Rules Limiting Co-Produced Helium
For complete list of drivers and restraints, kindly check the Table Of Contents.
Segment Analysis
Gaseous helium held 70.65% of the 2025 volume, reflecting large-scale use in pressurization, purging, and leak-testing, and is growing at a 6.03% CAGR as leading-edge nodes tighten contamination tolerances, sustaining a substantial share of the helium market size for process gases. The gaseous segment also benefits from aerospace welding and additive-manufacturing processes that rely on helium's high thermal conductivity for deep, narrow weld profiles.
Emerging hydrogen-fuel testing and electric-vehicle battery leak detection add incremental volumes, extending gaseous helium's dominance well into the forecast horizon across the helium market. MRI fleet expansion, quantum-system scale-out, and high-energy physics laboratories anchor baseline liquid helium demand. Increasing deployment of on-site liquefiers and 92% efficient recovery skids mitigates boil-off losses, but absolute volumes continue to rise.
The Helium Report is Segmented by Phase (Liquid Helium, and Gaseous Helium), Application (Breathing Mixes, Cryogenics, Leak Detection, Pressurizing and Purging, Welding, and More), End-User Industry (Aerospace and Aircraft, Electronics and Semiconductor, Nuclear Power, Healthcare, Welding and Metal Fabrication, Other End-User Industries), and Geography (Asia-Pacific, North America, Europe, and More).
Geography Analysis
North America commanded 38.55% of 2025 volume, supported by the world's largest proven reserves and mature midstream infrastructure. The Federal Helium Reserve privatization in 2024 shifted the procurement landscape, compelling end-users to negotiate directly with private producers at market rates, but Honeywell's Dry Piney and smaller Rockies projects are filling the gap. Semiconductor fab construction in Arizona, Ohio, and Texas further supports regional consumption growth.
Asia-Pacific is projected to post the highest 7.05% CAGR through 2031 as China, Japan, India, and South Korea ramp up semiconductors, satellite manufacturing, and medical imaging. China's 95% import dependence creates a strategic imperative for contract diversification and micro-liquefier deployment at industrial parks. Japan's incentive packages for next-generation memory plants accelerate helium spending, while India's nascent fab ecosystem and fast-growing healthcare sector widen demand. Regional investment in unconventional helium fields, notably in Australia and Tanzania, aims to hedge supply exposure.
Though smaller in volume, Europe faces structural supply restructuring after sanctions eliminated Russian helium flows. End-users now source from Qatar and the U.S. Gulf Coast, absorbing freight premiums and installation of on-site recovery to cushion volatility.
- Air Liquide
- Air Products and Chemicals, Inc.
- AIR WATER INC
- Buzwair Industrial Gases Factories
- ExxonMobil Corporation
- Gazprom
- Gulf Cryo
- Iwatani Corporation
- Linde plc
- Matheson Tri-Gas Inc.
- Messer Group
- North American Helium
- PGNiG SA
- QatarEnergy LNG
- Renergen
- Weil Group Resources
Additional Benefits:
- The market estimate (ME) sheet in Excel format
- 3 months of analyst support
TABLE OF CONTENTS
1 Introduction
- 1.1 Study Assumptions and Market Definition
- 1.2 Scope of the Study
2 Research Methodology
3 Executive Summary
4 Market Landscape
- 4.1 Market Overview
- 4.2 Market Drivers
- 4.2.1 Explosive Semiconductor Fab Build-Out in East Asia
- 4.2.2 MRI Fleet Expansion across Mid-Income Hospitals
- 4.2.3 Commercial Space-Launch Boom Raising Liquid-He Demand
- 4.2.4 Quantum-Computing Cryostats Moving from Lab to Pilot Lines
- 4.2.5 Pilot-Scale Helium-3 Extraction for Neutron Detection and Fusion Research and Development
- 4.3 Market Restraints
- 4.3.1 Finite Reserves and Concentration In A Few Countries
- 4.3.2 High Liquefaction and Logistics Costs Vs. Substitutes
- 4.3.3 Tightened Flare-Gas Rules Limiting Co-Produced Helium
- 4.4 Value Chain Analysis
- 4.5 Porter's Five Forces
- 4.5.1 Bargaining Power of Suppliers
- 4.5.2 Bargaining Power of Consumers
- 4.5.3 Threat of New Entrants
- 4.5.4 Threat of Substitutes
- 4.5.5 Degree of Competition
5 Market Size and Growth Forecasts (Volume)
- 5.1 By Phase
- 5.1.1 Liquid Helium
- 5.1.2 Gaseous Helium
- 5.2 By Application
- 5.2.1 Breathing Mixes
- 5.2.2 Cryogenics
- 5.2.3 Leak Detection
- 5.2.4 Pressurizing and Purging
- 5.2.5 Welding
- 5.2.6 Controlled Atmosphere
- 5.2.7 Other Applications
- 5.3 By End-User Industry
- 5.3.1 Aerospace and Aircraft
- 5.3.2 Electronics and Semiconductor
- 5.3.3 Nuclear Power
- 5.3.4 Healthcare
- 5.3.5 Welding and Metal Fabrication
- 5.3.6 Other End-User Industries
- 5.4 By Geography
- 5.4.1 Asia-Pacific
- 5.4.1.1 China
- 5.4.1.2 India
- 5.4.1.3 Japan
- 5.4.1.4 South Korea
- 5.4.1.5 Malaysia
- 5.4.1.6 Taiwan
- 5.4.1.7 Thailand
- 5.4.1.8 Indonesia
- 5.4.1.9 Vietnam
- 5.4.1.10 Australia
- 5.4.1.11 New Zealand
- 5.4.1.12 Rest of Asia-Pacific
- 5.4.2 North America
- 5.4.2.1 United States
- 5.4.2.2 Canada
- 5.4.2.3 Mexico
- 5.4.3 Europe
- 5.4.3.1 Germany
- 5.4.3.2 United Kingdom
- 5.4.3.3 Italy
- 5.4.3.4 France
- 5.4.3.5 Poland
- 5.4.3.6 Spain
- 5.4.3.7 Russia
- 5.4.3.8 Rest of Europe
- 5.4.4 South America
- 5.4.4.1 Brazil
- 5.4.4.2 Argentina
- 5.4.4.3 Rest of South America
- 5.4.5 Middle-East and Africa
- 5.4.5.1 Saudi Arabia
- 5.4.5.2 Egypt
- 5.4.5.3 South Africa
- 5.4.5.4 Rest of Middle-East and Africa
- 5.4.1 Asia-Pacific
6 Competitive Landscape
- 6.1 Market Concentration
- 6.2 Strategic Moves
- 6.3 Market Share (%)/Ranking Analysis
- 6.4 Company Profiles (includes Global level Overview, Market level overview, Core Segments, Financials as available, Strategic Information, Market Rank/Share for key companies, Products and Services, and Recent Developments)
- 6.4.1 Air Liquide
- 6.4.2 Air Products and Chemicals, Inc.
- 6.4.3 AIR WATER INC
- 6.4.4 Buzwair Industrial Gases Factories
- 6.4.5 ExxonMobil Corporation
- 6.4.6 Gazprom
- 6.4.7 Gulf Cryo
- 6.4.8 Iwatani Corporation
- 6.4.9 Linde plc
- 6.4.10 Matheson Tri-Gas Inc.
- 6.4.11 Messer Group
- 6.4.12 North American Helium
- 6.4.13 PGNiG SA
- 6.4.14 QatarEnergy LNG
- 6.4.15 Renergen
- 6.4.16 Weil Group Resources
7 Market Opportunities and Future Outlook
- 7.1 White-space and Unmet-need Assessment
 氦氣市場:2026-2032年全球市場預測(依產品形態、來源、等級、應用及通路分類)
 全球氦氣市場規模、佔有率、趨勢和成長分析報告(2026-2034年)氦氣市場規模、佔有率、成長及全球產業分析:按類型、應用和地區的洞察,2026-2034年預測
 2026年全球氦氣市場報告
 氦氣市場規模、佔有率和成長分析(按階段、應用、最終用途和地區分類)—2026-2033年產業預測
 氦氣市場 - 全球產業規模、佔有率、趨勢、機會和預測,按階段、按應用、按最終用戶、按地區和競爭進行細分,2020-2030 年
 氦氣市場規模、佔有率、趨勢分析報告:按階段、應用、最終用途、地區、細分市場預測,2025-2030 年
 全球氦氣市場(2025-2035)
 氦氣市場規模和預測、全球和地區佔有率、趨勢和成長機會分析報告範圍:按類型、應用、最終用途行業和地理位置
 到 2030 年氦氣市場預測:按階段、分銷管道、應用、最終用戶和地區進行的全球分析