


 |
市場調查報告書
商品編碼
1906910
PET包裝:市場佔有率分析、產業趨勢與統計、成長預測(2026-2031年)PET Packaging - Market Share Analysis, Industry Trends & Statistics, Growth Forecasts (2026 - 2031) |
||||||
※ 本網頁內容可能與最新版本有所差異。詳細情況請與我們聯繫。
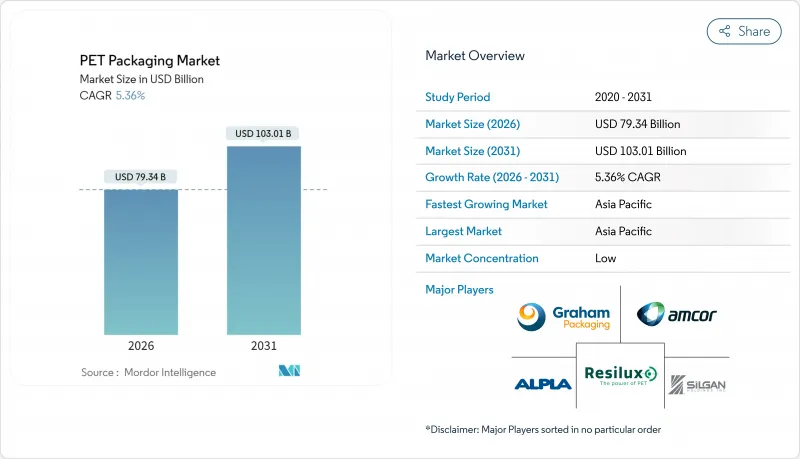
2025年PET包裝市場價值為753億美元,預計2031年將達到1,030.1億美元,高於2026年的793.4億美元。
預計在預測期(2026-2031 年)內,複合年成長率將達到 5.36%。
受飲料、食品和醫藥行業穩定需求的推動,儘管面臨永續性的永續發展壓力,PET包裝市場仍保持著穩步成長的勢頭。強制使用再生材料的法規、不斷成長的電子商務交易量以及化學回收技術的進步,共同鞏固了PET的市場地位。品牌所有者對最低再生PET標準的承諾,推動了對回收能力的大規模投資,而更輕的包裝則降低了物流排放和成本。同時,原生樹脂價格的波動以及各地不同的塑膠製品禁令,凸顯了建造能夠平衡原生材料和再生材料的一體化供應鏈的重要性。
全球PET包裝市場趨勢與洞察
高可回收性和輕量化優勢
PET可重複進行機械回收,且物理性質不會顯著劣化,因此在循環利用方面優於其他材料。其密度比玻璃低約40%,從而降低了區域和跨境物流的排放和成本。化學解聚裝置,例如利安德巴塞爾的德國工廠,可回收純度超過95%的單體,進而強化閉合迴路供應鏈。隨著化學和機械回收方式的不斷擴展,供應安全性得到提升,使PET包裝市場擁有其他材料無法比擬的成本優勢。因此,品牌所有者將PET視為實現氣候行動和循環目標的可行途徑,而無需進行昂貴的生產線改造。
歐盟和美國強制要求使用食品級rPET
歐盟法規2025/40要求飲料瓶到2030年必須含有30%的再生材料,到2040年必須含有65%的再生材料,這將大幅收緊本地再生PET的供應。美國食品藥物管理局(FDA)在21 CFR 177.1630中的指導意見也提供了類似的明確資訊,允許加工商對用於食品接觸應用的特定回收工藝進行認證。跨國飲料製造商正在設定更嚴格的中期目標,從而推動對高品質再生PET(rPET)的需求和溢價。這種供需缺口正在推動PET包裝市場價值鏈中新的和現有的回收計劃。投資者開始將PET回收能力視為一種策略資產,而不僅僅是一項環境義務。
關於一次性塑膠袋的新規定
澳洲各州和加拿大各省已開始禁止使用某些PET包裝袋和容器。雖然大多數飲料瓶仍不受此限制,但此舉造成了不確定性,並可能導致研發支出轉向可重複填充包裝。在調味品包裝袋等細分應用領域,加工商正在探索替代基材或專注於大包裝多份裝產品,以規避監管審查,這限制了該細分市場在更廣泛的PET包裝市場中的成長。
細分市場分析
到2025年,硬質PET將佔PET包裝總收入的83.12%,憑藉其在碳酸飲料瓶罐和保存食品包裝領域的應用,繼續保持其在PET包裝市場的地位。這項優勢源自於其與全球灌裝生產線的兼容性、優異的阻隔性能以及成本效益高的供應鏈。然而,軟包裝PET產品正在快速成長,由於多層薄膜的應用,其複合年成長率(CAGR)達到6.08%。這些多層薄膜不僅具有高氧氣阻隔性,還能減少40-60%的材料用量。品牌商正利用軟包裝來減輕運輸重量,並滿足電商對節省空間包裝形式日益成長的需求。
受果汁和乳製品生產線對熱灌裝袋的廣泛應用所推動,柔軟性PET市場規模正處於加速成長階段。網路零售商青睞這種包裝,因為它能降低運輸過程中的破損風險,同時也能維持與硬質容器相同的品質。隨著回收系統開始接受單一材料PET包裝袋,預計回收障礙將有所緩解,從而進一步增強該領域的長期發展前景。
到2025年,瓶罐將佔總收入的75.74%,反映出它們在飲用水、軟性飲料、食用油和個人護理液體等領域的廣泛應用。高速生產線、標準化瓶蓋以及消費者強大的認知度,使它們得以保持主導地位。儘管在能量飲料領域面臨鋁罐的競爭,在高階酒類領域面臨玻璃瓶的競爭, 寶特瓶仍佔據著較大的市場佔有率。目前的研發重點是開發輕質瓶坯,以在不犧牲瓶身強度的前提下,減少每個瓶子的樹脂用量。
儘管目前袋裝和小袋規模較小,但其成長率預計將達到最高,複合年成長率 (CAGR) 為 6.33%。單份家用清潔劑、嬰兒優格和便攜飲料都在過渡到可重複密封的袋裝產品。透明 PET 層滿足了品牌對產品可見度的需求,而吸嘴蓋則方便傾倒。澳洲和加拿大部分地區對一次性袋裝產品的監管更加嚴格,限制了這些地區的成長,但亞洲和拉丁美洲的擴張彌補了這一不足。
區域分析
亞太地區預計到2025年將佔全球收入的38.55%,並以7.42%的複合年成長率實現最快成長,這主要得益於中階消費的成長和本地產能的擴大。來自一體化石化聯合企業的低成本樹脂供應,以及政府為吸引外資投資回收產能所做的努力,正在推動成長。在印度尼西亞,Indorama Ventures、Ganesha Ecopet和PT Amandina的合資企業確保為跨國飲料品牌提供高品質的瓶裝再生PET(rPET)供應。儘管一些國家正在討論一次性塑膠瓶禁令,但寶特瓶通常不受近期法規的限制,這有利於其短期成長。
歐洲正通過強制性再生材料含量標準和嚴格的食品接觸法規,對區域外市場施加監管影響。在萊昂內爾·貝塞爾和伊士曼等公司化學回收工廠產能增加的推動下,歐洲PET包裝市場正穩步擴張。高分揀率和押金返還計劃支持瓶到瓶回收,使品牌能夠實現其2030年目標。高品質rPET的價格為一體化營運商提供了可觀的收入來源。
北美擁有成熟的填充網路和完善的上門回收系統,但各州對一次性包裝的監管規定不盡相同。 FDA的指導意見簡化了再生PET的核准,加速了其在飲用水和碳酸飲料生產線上的應用。南美以及中東和非洲地區的回收基礎設施相對滯後,但隨著人口成長和都市化進程推動包裝商品需求,這些地區仍有很大的發展空間。加工商擴大選擇PET,因為其他替代材料需要更冷的低溫運輸和耐刮擦塗層,推高了成本。
其他福利:
- Excel格式的市場預測(ME)表
- 分析師支持(3個月)
目錄
第1章 引言
- 研究假設和市場定義
- 調查範圍
第2章調查方法
第3章執行摘要
第4章 市場情勢
- 市場概覽
- 市場促進因素
- 高可回收性和輕量化優勢
- 歐盟和美國強制要求使用食品級rPET
- 在熱灌裝線和碳酸飲料生產線中擴大應用
- 電子商務包裝的成長
- 化學回收基礎建設
- 品牌所有者致力於實現 25-50% 的 rPET 含量
- 市場限制
- 原生PET樹脂價格波動
- 關於一次性塑膠袋的新規定
- 瓶裝到瓶裝循環供應缺口
- 消費者向「無塑膠」觀念的轉變
- 產業價值鏈分析
- 監管環境
- 技術展望
- 波特五力分析
- 新進入者的威脅
- 買方的議價能力
- 供應商的議價能力
- 替代品的威脅
- 競爭對手之間的競爭
- 宏觀經濟因素如何影響市場
第5章 市場規模與成長預測
- 按包裝類型
- 硬質PET包裝市場
- 軟性PET包裝市場
- 依產品類型
- 瓶子和罐子
- 小袋和包裝袋
- 托盤和翻蓋式容器
- 蓋子、瓶蓋和封裝件
- 預成型件和其他產品類型
- 依樹脂等級
- 原生PET(vPET)
- 再生PET(rPET)
- 按最終用戶行業分類
- 食品/飲料
- 製藥
- 個人護理和化妝品
- 家用
- 工業產品
- 其他終端用戶產業
- 按地區
- 北美洲
- 美國
- 加拿大
- 墨西哥
- 歐洲
- 德國
- 英國
- 法國
- 義大利
- 西班牙
- 其他歐洲地區
- 亞太地區
- 中國
- 日本
- 印度
- 韓國
- 澳洲
- 泰國
- 馬來西亞
- 亞太其他地區
- 南美洲
- 巴西
- 阿根廷
- 南美洲其他地區
- 中東和非洲
- 中東
- 阿拉伯聯合大公國
- 沙烏地阿拉伯
- 土耳其
- 其他中東地區
- 非洲
- 南非
- 奈及利亞
- 其他非洲地區
- 中東
- 北美洲
第6章 競爭情勢
- 市場集中度
- 策略趨勢
- 市佔率分析
- 公司簡介
- Amcor plc
- Resilux NV
- Gerresheimer AG
- ALPLA Werke Alwin Lehner GmbH and Co KG
- Silgan Holdings Inc.
- Graham Packaging Company LP
- GTX Hanex Plastic Sp. z oo
- Dunmore Corporation
- Comar LLC
- TOPPAN Holdings Inc.
- Huhtamaki Oyj
- Nampak Ltd.
- Plastipak Holdings Inc.
- ACTI PACK SAS
- RETAL Industries Ltd
- Sealed Air Corporation
- Pactiv Evergreen Inc.
- Uflex Ltd.
- Zhongfu Industrial Co. Ltd.
- Novapet SA
第7章 市場機會與未來展望
The PET packaging market was valued at USD 75.30 billion in 2025 and estimated to grow from USD 79.34 billion in 2026 to reach USD 103.01 billion by 2031, at a CAGR of 5.36% during the forecast period (2026-2031).
Consistent demand from beverages, food, and pharmaceuticals keeps the PET packaging market on a steady growth path even as sustainability pressures intensify. Regulatory mandates that require recycled content, rising e-commerce volumes, and advances in chemical recycling all reinforce PET's entrenched position. Brand-owner commitments to minimum recycled PET thresholds are catalyzing large-scale investments in recycling capacity, while lightweighting gains lower logistics emissions and costs. Meanwhile, volatile virgin resin prices and a patchwork of single-use plastic bans place a premium on integrated supply chains able to balance virgin and recycled inputs.
Global PET Packaging Market Trends and Insights
High Recyclability and Light-Weighting Advantage
PET allows repeated mechanical recycling without substantial property loss, which gives it a circular edge over rival substrates. Its density is roughly 40% lower than glass, cutting freight emissions and costs in regional and cross-border logistics. Chemical depolymerization plants such as LyondellBasell's German site reclaim 95%-plus pure monomers, reinforcing closed-loop supply chains. As both chemical and mechanical recycling options scale, supply stability improves, and the PET packaging market secures a cost advantage that competing materials struggle to match. Brand owners thus view PET as a pragmatic path to meet climate and circularity goals without costly line retrofits.
Food-Grade rPET Mandates in EU and US
Regulation (EU) 2025/40 compels beverage bottles to carry 30% recycled content by 2030 and 65% by 2040, instantly tightening regional rPET supply. FDA guidance under 21 CFR 177.1630 offers parallel clarity, allowing converters to qualify specific recycling processes for food contact. Multinational beverage firms have pledged even steeper interim targets, pulling demand forward and raising premiums for high-quality rPET. The resulting supply-demand gap is spurring green-field and brown-field recycling projects across the PET packaging market value chain. Investors now see PET recycling capacity as a strategic asset rather than an environmental obligation.
Emerging Plastic Bans on Single-Use Sachets
Australia's states and Canadian provinces have begun banning certain PET sachets and small containers. Although most beverage bottles remain exempt, the policy trend seeds uncertainty that may shift R&D spending toward refillable formats. For niche applications such as condiment sachets, converters now weigh alternate substrates or concentrate on larger multi-serve packs to avoid regulatory scrutiny, tempering segment growth within the broader PET packaging market.
Other drivers and restraints analyzed in the detailed report include:
- Increased Adoption in Hot-Fill and CSD Lines
- Deployment of Chemical Recycling Infrastructure
- Bottle-to-Bottle Loop Supply Gap
For complete list of drivers and restraints, kindly check the Table Of Contents.
Segment Analysis
Rigid PET commanded 83.12% of 2025 revenue and continues to anchor the PET packaging market thanks to bottles and jars in carbonated drinks and shelf-stable foods. This dominance is rooted in global filling-line compatibility, strong barrier performance, and cost-efficient supply chains. However, flexible PET options are scaling quickly, achieving 6.08% CAGR as converters adopt multilayer films with high oxygen barriers and 40-60% lower material use. Brand owners leverage flexible packs to cut shipping weight and adapt to e-commerce demand spikes that favor space-efficient formats.
The PET packaging market size for flexible formats is on an accelerating trajectory as hot-fill capable pouches enter juice and dairy lines. Smaller transportation footprints and lower breakage risk appeal to online retailers, while barrier films keep quality on par with rigid containers. As recycling systems begin accepting mono-material PET pouches, collection hurdles are projected to ease, which strengthens the long-term outlook for this segment.
Bottles and jars held 75.74% of 2025 revenue, reflecting their ubiquity across water, soft drinks, edible oils, and personal-care liquids. High line speeds, standardized closures, and consumer familiarity sustain leadership. The PET packaging market share for bottles remains sizable despite competition from aluminum in energy drinks and glass in premium spirits. R&D now targets lightweight preforms that trim resin usage per bottle without compromising top-load strength.
Pouches and sachets, though smaller today, exhibit the highest growth at 6.33% CAGR. Unit-dose household cleaners, toddler yogurts, and on-the-go beverages all migrate toward resealable pouches. Transparent PET layers satisfy brand demands for product visibility, while spouted caps enable convenient pouring. Regulatory scrutiny of single-use sachets in parts of Australia and Canada tempers growth in those regions but is outweighed by expansion in Asia and Latin America.
The PET Packaging Market Report is Segmented by Packaging Format (Rigid PET Packaging, and Flexible PET Packaging), Product Type (Bottles and Jars, Pouches and Sachets, Trays and Clamshells, and More), Resin Grade (Virgin PET, and Recycled PET), End-User Industry (Food and Beverage, Pharmaceuticals, Personal Care and Cosmetics, and More), and Geography. The Market Forecasts are Provided in Terms of Value (USD).
Geography Analysis
Asia-Pacific captured 38.55% of 2025 revenue and is expanding fastest at 7.42% CAGR, fueled by rising middle-class spending and local manufacturing scale. Integrated petrochemical complexes deliver low-cost resin, while governments court foreign investment in recycling capacity. Projects such as Indorama Ventures' venture with Ganesha Ecopet and PT Amandina in Indonesia guarantee bottle-to-bottle quality rPET for multinational beverage brands. Although some countries debate single-use bans, PET bottles usually remain outside immediate regulatory targets, preserving short-term growth.
Europe wields regulatory influence beyond its borders through mandatory recycled-content quotas and strict food-contact rules. The PET packaging market size in Europe steadily climbs as chemical recycling plants from LyondellBasell and Eastman augment supply. High sorting rates and deposit-return schemes underpin bottle-to-bottle loops that enable brands to meet 2030 targets. Premium rPET pricing generates attractive returns for integrated players.
North America hosts mature filler networks and a robust curbside collection system, but faces divergent state-level regulations on single-use packaging. FDA guidance simplifies rPET approvals, aiding adoption in water and carbonated drink lines. South America and the Middle East & Africa trail in collection infrastructure, yet present upside as population growth and urbanization accelerate packaged goods demand. Converters gravitate toward PET because alternative substrates require colder chains or scratch-resistant finishes that raise costs.
- Amcor plc
- Resilux NV
- Gerresheimer AG
- ALPLA Werke Alwin Lehner GmbH and Co KG
- Silgan Holdings Inc.
- Graham Packaging Company LP
- GTX Hanex Plastic Sp. z o.o.
- Dunmore Corporation
- Comar LLC
- TOPPAN Holdings Inc.
- Huhtamaki Oyj
- Nampak Ltd.
- Plastipak Holdings Inc.
- ACTI PACK S.A.S
- RETAL Industries Ltd
- Sealed Air Corporation
- Pactiv Evergreen Inc.
- Uflex Ltd.
- Zhongfu Industrial Co. Ltd.
- Novapet S.A.
Additional Benefits:
- The market estimate (ME) sheet in Excel format
- 3 months of analyst support
TABLE OF CONTENTS
1 INTRODUCTION
- 1.1 Study Assumptions and Market Definition
- 1.2 Scope of the Study
2 RESEARCH METHODOLOGY
3 EXECUTIVE SUMMARY
4 MARKET LANDSCAPE
- 4.1 Market Overview
- 4.2 Market Drivers
- 4.2.1 High Recyclability and Light-Weighting Advantage
- 4.2.2 Food-Grade rPET Mandates in EU and US
- 4.2.3 Increased Adoption in Hot-Fill and CSD Lines
- 4.2.4 Growth of E-Commerce Ready Packaging Formats
- 4.2.5 Deployment of Chemical Recycling Infrastructure
- 4.2.6 Brand-Owner Commitments to 25-50% rPET Content
- 4.3 Market Restraints
- 4.3.1 Volatility in Virgin PET Resin Prices
- 4.3.2 Emerging Plastic Bans on Single-Use Sachets
- 4.3.3 Bottle-to-Bottle Loop Supply Gap
- 4.3.4 Consumer Perception Shift Toward "Plastic-Free"
- 4.4 Industry Value Chain Analysis
- 4.5 Regulatory Landscape
- 4.6 Technological Outlook
- 4.7 Porter's Five Forces Analysis
- 4.7.1 Threat of New Entrants
- 4.7.2 Bargaining Power of Buyers
- 4.7.3 Bargaining Power of Suppliers
- 4.7.4 Threat of Substitute Products
- 4.7.5 Intensity of Competitive Rivalry
- 4.8 Impact of Macroeconomic Factors on the Market
5 MARKET SIZE AND GROWTH FORECASTS (VALUE)
- 5.1 By Packaging Format
- 5.1.1 Rigid PET Packaging
- 5.1.2 Flexible PET Packaging
- 5.2 By Product Type
- 5.2.1 Bottles and Jars
- 5.2.2 Pouches and Sachets
- 5.2.3 Trays and Clamshells
- 5.2.4 Lids-Caps and Closures
- 5.2.5 Preforms and Other Product Types
- 5.3 By Resin Grade
- 5.3.1 Virgin PET (vPET)
- 5.3.2 Recycled PET (rPET)
- 5.4 By End-User Industry
- 5.4.1 Food and Beverage
- 5.4.2 Pharmaceuticals
- 5.4.3 Personal Care and Cosmetics
- 5.4.4 Household
- 5.4.5 Industrial Goods
- 5.4.6 Other End-User Industries
- 5.5 By Geography
- 5.5.1 North America
- 5.5.1.1 United States
- 5.5.1.2 Canada
- 5.5.1.3 Mexico
- 5.5.2 Europe
- 5.5.2.1 Germany
- 5.5.2.2 United Kingdom
- 5.5.2.3 France
- 5.5.2.4 Italy
- 5.5.2.5 Spain
- 5.5.2.6 Rest of Europe
- 5.5.3 Asia-Pacific
- 5.5.3.1 China
- 5.5.3.2 Japan
- 5.5.3.3 India
- 5.5.3.4 South Korea
- 5.5.3.5 Australia
- 5.5.3.6 Thailand
- 5.5.3.7 Malaysia
- 5.5.3.8 Rest of Asia-Pacific
- 5.5.4 South America
- 5.5.4.1 Brazil
- 5.5.4.2 Argentina
- 5.5.4.3 Rest of South America
- 5.5.5 Middle East and Africa
- 5.5.5.1 Middle East
- 5.5.5.1.1 United Arab Emirates
- 5.5.5.1.2 Saudi Arabia
- 5.5.5.1.3 Turkey
- 5.5.5.1.4 Rest of Middle East
- 5.5.5.2 Africa
- 5.5.5.2.1 South Africa
- 5.5.5.2.2 Nigeria
- 5.5.5.2.3 Rest of Africa
- 5.5.5.1 Middle East
- 5.5.1 North America
6 COMPETITIVE LANDSCAPE
- 6.1 Market Concentration
- 6.2 Strategic Moves
- 6.3 Market Share Analysis
- 6.4 Company Profiles (includes Global level Overview, Market level overview, Core Segments, Financials as available, Strategic Information, Market Rank/Share for key companies, Products and Services, and Recent Developments)
- 6.4.1 Amcor plc
- 6.4.2 Resilux NV
- 6.4.3 Gerresheimer AG
- 6.4.4 ALPLA Werke Alwin Lehner GmbH and Co KG
- 6.4.5 Silgan Holdings Inc.
- 6.4.6 Graham Packaging Company LP
- 6.4.7 GTX Hanex Plastic Sp. z o.o.
- 6.4.8 Dunmore Corporation
- 6.4.9 Comar LLC
- 6.4.10 TOPPAN Holdings Inc.
- 6.4.11 Huhtamaki Oyj
- 6.4.12 Nampak Ltd.
- 6.4.13 Plastipak Holdings Inc.
- 6.4.14 ACTI PACK S.A.S
- 6.4.15 RETAL Industries Ltd
- 6.4.16 Sealed Air Corporation
- 6.4.17 Pactiv Evergreen Inc.
- 6.4.18 Uflex Ltd.
- 6.4.19 Zhongfu Industrial Co. Ltd.
- 6.4.20 Novapet S.A.
7 MARKET OPPORTUNITIES AND FUTURE OUTLOOK
- 7.1 White-Space and Unmet-Need Assessment
 2026年全球PET包裝市場報告2026年全球PET飲料包裝市場報告
 醫藥市場PET包裝:按包裝類型、藥品類型、填充和封裝工藝、永續性解決方案以及最終用戶分類-2026年至2032年全球市場預測
 PET包裝市場-2026-2031年預測
 日本PET包裝市場規模、佔有率、趨勢及預測(依包裝類型、形式、包裝類型、填充技術、最終用戶及地區分類),2026-2034年
 PET包裝市場規模、佔有率和成長分析(按產品類型、原料、包裝類型、最終用途和地區分類)-2026-2033年產業預測
 美國PET硬質熱成型塑膠包裝市場規模、佔有率和趨勢分析報告:按產品、應用和細分市場預測(2026-2033年)
 PET 包裝市場 - 全球產業規模、佔有率、趨勢、機會及預測,按類型、包裝類型、最終用戶、地區及競爭情況細分,2020-2030 年預測2025 年至 2033 年 PET 包裝市場規模、佔有率、趨勢及預測(按包裝類型、形式、包裝類型、填充技術、最終用戶和地區分類)
 PET 飲料包裝:市場佔有率分析、產業趨勢與統計、成長預測(2025-2030 年)