


 |
市場調查報告書
商品編碼
1906872
礦業化學品:市場佔有率分析、產業趨勢與統計、成長預測(2026-2031)Mining Chemicals - Market Share Analysis, Industry Trends & Statistics, Growth Forecasts (2026 - 2031) |
||||||
※ 本網頁內容可能與最新版本有所差異。詳細情況請與我們聯繫。
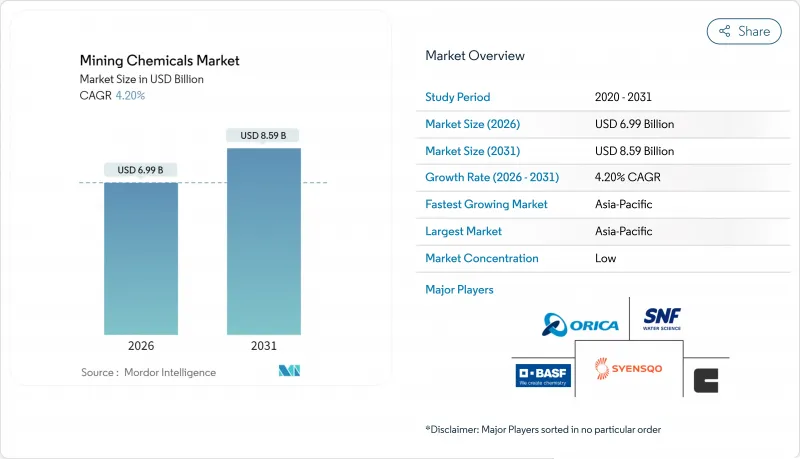
預計礦業化學品市場將從 2025 年的 67.1 億美元成長到 2026 年的 69.9 億美元,到 2031 年將達到 85.9 億美元,2026 年至 2031 年的複合年成長率為 4.2%。
電池金屬需求的成長、日益嚴格的環境法規以及加速的能源轉型,正推動採購決策轉向更具選擇性、更環保高效的試劑配方,以提高金屬回收率並降低水和電力消耗。亞太地區仍是主要的生產基地,而北美地區對新產能和濕式冶金的策略投資則支撐著其他礦業化學品市場需求的穩定成長。儘管浮選試劑仍然是收入的主要來源,但成長勢頭最強勁的是溶劑萃取試劑,它能夠實現鋰、鎳、鈷和稀土元素的低碳製程。市場競爭適中。現有供應商透過併購和數位化最佳化來捍衛市場佔有率,而小規模的新參與企業則利用生物基化學品和乾式加工助劑,在礦業化學品市場中開闢尚未開發的細分市場。
全球礦業化學品市場趨勢與洞察
亞太和北美地區的礦業資本投資增加
美國礦業化學品市場對試劑的需求強勁。僅在澳大利亞,資源出口收入預計在2024-2025年就將達到3800億美元,不斷成長的銅、鋰和鎳新計劃儲備推動了浮選、浸出和水處理試劑包的競標成長。銅冶煉廠的加工率在2024年轉為負值,顯示精礦供應緊張,並刺激了依賴高純度溶劑抽取劑的新型濕式冶金投資。金融分析師估計,廣泛的工業資本支出週期每年將向基礎設施注入2.5兆至5兆美元,透過增加對關鍵礦物的需求,間接增強礦業化學品市場。隨著營運商在新資產中實現工廠化學製程的標準化,能夠整合數位化計量控制和專業配方的供應商正在贏得長期供應合約。
電動車和可再生能源電網推動礦產需求激增
預計2024年運作的電池超級工廠將使美國電池產量增加40%,加速鋰、鎳和鈷的單位需求,並使全球礦產需求預測值在2030年達到三倍。每增加鋰輝石或紅土的加工量,化學試劑的消耗量將比傳統基底金屬冶煉製程高出40%至200%,這推動了整個礦業化學品市場對溶劑萃取和結晶試劑的需求。同時,電池製造商向磷酸鋰鐵和鈉離子電池技術轉型,帶來了新的製程控制挑戰,需要客製化的螯合劑。由於地緣政治摩擦可能導致關鍵礦產供應中斷,人們日益擔憂,礦業公司正在簽訂多年試劑合約以降低供應風險,這進一步鞏固了礦業化學品市場的結構性成長。
加強對有毒試劑的全球監管
世界各國政府現已要求氰化物、汞和黃原酸鹽使用者按照嚴格的監管法規進行註冊,這些法規要求持續監測、緊急時應對計畫並為礦場關閉後的水處理提供財務擔保。 《國際氰化物控制規範》和美國土地管理局關於長期處理資金的新規則正在增加合規成本。歐洲監管機構正在考慮進一步禁止使用全氟烷基和多氟烷基物質(PFAS)泡沫,這將加速礦業化學品市場向替代界面活性劑的轉型。供應商被迫在重新配製產品和麵臨市場進入限制之間做出選擇,這將減緩短期成長,但將促進長期創新。
細分市場分析
預計到2025年,浮選化學品將佔礦業化學品市場佔有率的55.30%,在從日益複雜的礦石中分離銅、鋅和貴金屬硫化物方面發揮至關重要的作用。捕收劑佔據了市場的大部分收入,其次是抑制劑、凝聚劑、發泡劑和分散劑,這些產品用於調節礦漿化學成分,以實現最佳動態效果。與傳統的黃原膠基化學品相比,Syensqo的AEROPHINE系列等優質捕收劑在用量降低高達30%的情況下即可提高選擇性,因此備受尋求成本節約和符合ESG(環境、社會和治理)要求的礦業公司的青睞。抑制劑可防止硫化鐵的稀釋作用,而合成發泡劑則可穩定粗粒浮選迴路中的氣泡尺寸。在礦業化學品市場中,由於礦石品位下降,需要進行更精細的研磨並添加更多化學品以維持回收率,因此預計浮選化學品市場將穩定成長。
抽取劑、稀釋劑、抽取劑和反萃取液的複合年成長率 (CAGR) 為 4.32%,在各功能領域中增速最高。這一成長趨勢主要得益於計畫建造的用於鋰鹵水、鎳紅土礦和多金屬精礦的大規模濕式冶金生產線。BASF的水相冶金平台生產高純度金屬鹽所需的能耗比冶煉低 40%,這使得溶劑萃取成為一種極具吸引力的脫碳途徑。
礦業化學品報告按功能(浮選化學品、萃取化學品、磨礦助劑)、應用(礦物加工和污水處理)以及地區(亞太地區、北美地區、歐洲地區、南美地區、中東和非洲地區)進行細分。市場預測以美元計價。
區域分析
預計到2025年,亞太地區將維持54.10%的礦業化學品市場佔有率,主要得益於中國在銅、鎳和稀土元素加工領域的領先地位,以及印度大力推進國內礦產資源商業化。中國的鋰和鎳提煉叢集,加上國家對非洲和拉丁美洲礦山的投資,即使在經濟放緩的情況下,也支撐著強勁的需求。
由於華盛頓推出政策保障先進電池和關鍵礦物的供應鏈,北美市場蓬勃發展。聯邦政府的獎勵促成了超過1500億美元的電池芯和原料計劃,從而提振了鋰鎳鈷提取生產線的試劑需求。預計到2024年,加拿大探勘支出將達到41億美元,中小礦業公司正積極推進稀土元素和關鍵金屬礦床的水冶金試驗。
歐洲的產量雖然不高,但創新活動卻十分活躍。歐盟《關鍵材料法》支持國內提煉和回收,促進電池材料循環中特種試劑的應用。BASF和科萊恩從其歐洲工廠供應不含全氟烷基和多氟烷基物質(PFAS)的發泡劑和生物收集劑,提高了區域自給自足能力,並增強了競爭優勢。南美洲的鋰三角和智利銅礦的擴張發揮著重要作用,而非洲的礦產資源為能夠克服基礎設施和管治複雜性的供應商提供了成長潛力。中東的需求量小規模,但磷酸鹽肥料和鋁的垂直整合大型企劃表明,某些特定領域存在成長空間。
其他福利:
- Excel格式的市場預測(ME)表
- 分析師支持(3個月)
目錄
第1章 引言
- 研究假設和市場定義
- 調查範圍
第2章調查方法
第3章執行摘要
第4章 市場情勢
- 市場概覽
- 市場促進因素
- 亞太和北美地區的礦業資本投資增加
- 電動車和可再生能源供應鏈推動礦產需求成長
- 提高大型礦山水循環利用標準
- 商品價格回升為探勘預算提供支持
- 為符合ESG法規,向生物基收集器過渡
- 市場限制
- 加強對有毒試劑的全球監管
- 原油衍生原料成本波動
- 新興的乾式加工技術避免使用濕試劑
- 價值鏈分析
- 波特五力模型
- 供應商的議價能力
- 買方的議價能力
- 新進入者的威脅
- 替代品的威脅
- 競爭程度
第5章 市場規模與成長預測
- 按功能
- 浮選化學品
- 集電極
- 抑制劑
- 凝聚劑
- 氣泡劑
- 分散劑
- 萃取化學品
- 沖淡
- 抽取劑
- 研磨助劑
- 浮選化學品
- 透過使用
- 礦物加工
- 污水處理
- 按地區
- 亞太地區
- 中國
- 印度
- 日本
- 韓國
- 印尼
- 馬來西亞
- 澳洲和紐西蘭
- 亞太其他地區
- 北美洲
- 美國
- 加拿大
- 墨西哥
- 歐洲
- 德國
- 英國
- 法國
- 義大利
- 俄羅斯
- 其他歐洲地區
- 南美洲
- 巴西
- 阿根廷
- 南美洲其他地區
- 中東和非洲
- 沙烏地阿拉伯
- 南非
- 其他中東和非洲地區
- 亞太地區
第6章 競爭情勢
- 市場集中度
- 策略趨勢
- 市佔率分析
- 公司簡介
- BASF
- 3M
- AECI
- Arkema
- Betachem(Pty)Ltd
- Celanese Corporation
- Chevron Phillips Chemical Company LLC
- Clariant
- CTC(Tennant Consolidated Group)
- Ecolab
- FMC Corporation
- Indorama Ventures Public Limited
- Kemira
- NASACO
- Orica Limited
- Qingdao Ruchang Mining Industry Co. Ltd
- Sasol
- SNF Group
- Syensqo
第7章 市場機會與未來展望
The Mining Chemicals Market is expected to grow from USD 6.71 billion in 2025 to USD 6.99 billion in 2026 and is forecast to reach USD 8.59 billion by 2031 at 4.2% CAGR over 2026-2031.
Rising demand for battery metals, stricter environmental regulations, and the accelerated energy transition are steering purchasing decisions toward more selective and eco-efficient reagent formulations that raise metal recovery while cutting water and power use. Asia-Pacific remains the dominant production hub, while new capacity in North America and strategic investments in hydrometallurgy underpin steady offtake growth across the rest of the mining chemicals market. Flotation agents continue to anchor revenue, yet the strongest momentum lies in solvent-extraction reagents that enable low-carbon flowsheets for lithium, nickel, cobalt, and rare earths. Competition is moderate: established suppliers defend share through mergers and acquisitions and digital optimization, whereas smaller entrants deploy bio-based chemistries and dry-processing aids to tap under-served niches in the mining chemicals market.
Global Mining Chemicals Market Trends and Insights
Increasing Mining CAPEX in APAC and North America
United States is translating into brisk reagent demand in the mining chemicals market. Australia alone expects resource export earnings to reach USD 380 billion in 2024-25, and the pipeline of new copper, lithium, and nickel projects is widening reagent tenders for flotation, leaching, and water treatment packages. Copper smelter treatment charges turned negative in 2024, signaling tight concentrate supply and encouraging fresh hydrometallurgical investments that rely on high-purity solvent-extraction agents. Financial analysts estimate that the broader industrial capex cycle could inject USD 2.5-5 trillion annually into infrastructure, indirectly fortifying the mining chemicals market through higher demand for critical minerals. Suppliers capable of bundling digital dosing control with specialty formulations are winning long-term supply contracts as operators standardize plant chemistry across new assets.
Surging Mineral Demand from EV and Renewable-Energy Supply Chains
Battery gigafactories commissioned in 2024 catapulted United States cell output by 40%, accelerating the hunt for lithium, nickel, and cobalt units and inflating global mineral demand forecasts three-fold by 2030. Each incremental tonne of spodumene or laterite processed consumes 40-200% more chemical reagents than legacy base-metal flowsheets, lifting solvent-extraction and crystallization reagent volumes across the mining chemicals market. In parallel, cell makers pivoting to lithium iron phosphate and sodium-ion chemistries are creating fresh process-control challenges that require tailor-made chelating agents. Miners are locking in multi-year reagent contracts to de-risk supply as geopolitical friction raises the specter of critical mineral disruptions, reinforcing structural growth for the mining chemicals market.
Tightening Global Regulations on Toxic Reagents
Governments now compel cyanide, mercury, and xanthate users to register under stricter codes that demand continuous monitoring, emergency response plans, and financial assurance for post-closure water treatment. The International Cyanide Management Code and recent U.S. Bureau of Land Management rules on long-term treatment funds have escalated compliance costs. European regulators consider additional bans on PFAS-based frothers, accelerating the shift toward alternative surfactants across the mining chemicals market. Suppliers must either reformulate or face restricted market access, dampening near-term growth but catalyzing long-run innovation.
Other drivers and restraints analyzed in the detailed report include:
- Stricter Water-Recycling Norms in Large Mines
- Shift to Bio-Based Collectors for ESG Compliance
- Emerging Dry-Processing Technologies That Bypass Wet Reagents
For complete list of drivers and restraints, kindly check the Table Of Contents.
Segment Analysis
Flotation reagents captured 55.30% of the mining chemicals market share in 2025, underscoring their essential role in separating copper, zinc, and precious-metal sulfides from increasingly complex ores. Collectors account for the largest slice of this revenue, followed by depressants, flocculants, frothers, and dispersants that adjust pulp chemistry for optimum kinetics. Premium collectors such as Syensqo's AEROPHINE series deliver improved selectivity at doses up to 30% lower than legacy xanthates, a feature prized by miners seeking both cost savings and ESG compliance. Depressants eliminate iron sulfide dilution, while synthetic frothers stabilize bubble size in coarse-particle flotation circuits. The mining chemicals market size for flotation reagents is forecast to grow steadily on the back of declining ore grades, which force operators to grind finer and add more chemistries to maintain recovery.
Extraction reagents, diluents, extractants, and stripping solutions, are expanding at a 4.32% CAGR, the highest among functional segments. This trajectory stems from large-scale hydrometallurgical lines planned for lithium brines, nickel laterites, and polymetallic concentrates. BASF's hydrometallurgy platform consumes 40% less energy than smelting and yields high-purity metal salts, making solvent extraction an attractive decarbonization pathway.
The Mining Chemicals Report is Segmented by Function (Flotation Chemicals, Extraction Chemicals, and Grinding Aids), Application (Mineral Processing and Wastewater Treatment), and Geography (Asia-Pacific, North America, Europe, South America, and Middle-East and Africa). The Market Forecasts are Provided in Terms of Value (USD).
Geography Analysis
Asia-Pacific maintained a 54.10% revenue hold on the mining chemicals market in 2025 thanks to China's dominant position in copper, nickel, and rare-earth processing as well as India's push to commercialize domestic mineral reserves. China's lithium and nickel refining clusters, coupled with state-backed investments in African and Latin American mines, underpin resilient demand even amid broader economic softening.
North America's market is growing as Washington pursues supply-chain security for advanced batteries and critical minerals. Federal incentives spurred more than USD 150 billion in announced cell and raw-material projects, reinforcing reagent demand in lithium, nickel, and cobalt extraction lines. Canada's exploration spend climbed to USD 4.1 billion in 2024, with junior players driving hydrometallurgy trials for rare-earth and critical-metal deposits.
Europe exhibits modest volume but intensive innovation. The EU Critical Raw Materials Act supports domestic refining and recycling, lifting specialty reagent uptake in battery material loops. BASF and Clariant supply PFAS-free frothers and bio-collectors from European plants, raising regional self-sufficiency and competitive differentiation. South America's lithium triangle and Chilean copper expansions secure a pivotal role, while Africa's mineral wealth offers upside for suppliers able to navigate infrastructure and governance complexities. Middle East demand is minor, yet vertically integrated mega-projects in phosphate fertilizers and aluminum point to selective growth pockets.
- BASF
- 3M
- AECI
- Arkema
- Betachem (Pty) Ltd
- Celanese Corporation
- Chevron Phillips Chemical Company LLC
- Clariant
- CTC (Tennant Consolidated Group)
- Ecolab
- FMC Corporation
- Indorama Ventures Public Limited
- Kemira
- NASACO
- Orica Limited
- Qingdao Ruchang Mining Industry Co. Ltd
- Sasol
- SNF Group
- Syensqo
Additional Benefits:
- The market estimate (ME) sheet in Excel format
- 3 months of analyst support
TABLE OF CONTENTS
1 Introduction
- 1.1 Study Assumptions and Market Definition
- 1.2 Scope of the Study
2 Research Methodology
3 Executive Summary
4 Market Landscape
- 4.1 Market Overview
- 4.2 Market Drivers
- 4.2.1 Increasing Mining CAPEX in APAC and North America
- 4.2.2 Surging Mineral Demand from EV And Renewable-Energy Supply Chains
- 4.2.3 Stricter Water-Recycling Norms in Large Mines
- 4.2.4 Commodity-Price Rebound Sustaining Exploration Budgets
- 4.2.5 Shift to Bio-Based Collectors for ESG Compliance
- 4.3 Market Restraints
- 4.3.1 Tightening Global Regulations on Toxic Reagents
- 4.3.2 Volatile Crude-Derived Raw-Material Costs
- 4.3.3 Emerging Dry-Processing Technologies that Bypass Wet Reagents
- 4.4 Value Chain Analysis
- 4.5 Porter's Five Forces
- 4.5.1 Bargaining Power of Suppliers
- 4.5.2 Bargaining Power of Buyers
- 4.5.3 Threat of New Entrants
- 4.5.4 Threat of Substitutes
- 4.5.5 Degree of Competition
5 Market Size and Growth Forecasts (Value)
- 5.1 By Function
- 5.1.1 Flotation Chemicals
- 5.1.1.1 Collectors
- 5.1.1.2 Depressants
- 5.1.1.3 Flocculants
- 5.1.1.4 Frothers
- 5.1.1.5 Dispersants
- 5.1.2 Extraction Chemicals
- 5.1.2.1 Diluents
- 5.1.2.2 Extractants
- 5.1.3 Grinding Aids
- 5.1.1 Flotation Chemicals
- 5.2 By Application
- 5.2.1 Mineral Processing
- 5.2.2 Wastewater Treatment
- 5.3 By Geography
- 5.3.1 Asia-Pacific
- 5.3.1.1 China
- 5.3.1.2 India
- 5.3.1.3 Japan
- 5.3.1.4 South Korea
- 5.3.1.5 Indonesia
- 5.3.1.6 Malaysia
- 5.3.1.7 Australia and New Zealand
- 5.3.1.8 Rest of Asia-Pacific
- 5.3.2 North America
- 5.3.2.1 United States
- 5.3.2.2 Canada
- 5.3.2.3 Mexico
- 5.3.3 Europe
- 5.3.3.1 Germany
- 5.3.3.2 United Kingdom
- 5.3.3.3 France
- 5.3.3.4 Italy
- 5.3.3.5 Russia
- 5.3.3.6 Rest of Europe
- 5.3.4 South America
- 5.3.4.1 Brazil
- 5.3.4.2 Argentina
- 5.3.4.3 Rest of South America
- 5.3.5 Middle-East and Africa
- 5.3.5.1 Saudi Arabia
- 5.3.5.2 South Africa
- 5.3.5.3 Rest of Middle-East and Africa
- 5.3.1 Asia-Pacific
6 Competitive Landscape
- 6.1 Market Concentration
- 6.2 Strategic Moves
- 6.3 Market Share Analysis
- 6.4 Company Profiles (includes Global level Overview, Market level overview, Core Segments, Financials as available, Strategic Information, Market Rank/Share for key companies, Products and Services, and Recent Developments)
- 6.4.1 BASF
- 6.4.2 3M
- 6.4.3 AECI
- 6.4.4 Arkema
- 6.4.5 Betachem (Pty) Ltd
- 6.4.6 Celanese Corporation
- 6.4.7 Chevron Phillips Chemical Company LLC
- 6.4.8 Clariant
- 6.4.9 CTC (Tennant Consolidated Group)
- 6.4.10 Ecolab
- 6.4.11 FMC Corporation
- 6.4.12 Indorama Ventures Public Limited
- 6.4.13 Kemira
- 6.4.14 NASACO
- 6.4.15 Orica Limited
- 6.4.16 Qingdao Ruchang Mining Industry Co. Ltd
- 6.4.17 Sasol
- 6.4.18 SNF Group
- 6.4.19 Syensqo
7 Market Opportunities and Future Outlook
- 7.1 White-space and Unmet-need Assessment
 礦業化學品市場預測至2034年-按產品類型、化學品類型、礦物類型、萃取方法、應用和地區分類的全球分析
 溶液採礦市場規模、佔有率和成長分析:按礦物類型、技術、應用和地區分類-2026-2033年產業預測
 礦業化學品市場:按類型、形態和應用分類 - 2026-2032年全球市場預測
 礦業化學品市場規模、佔有率、趨勢和預測:按產品類型、礦物類型、應用和地區分類,2026-2034年
 礦業化學品市場規模、佔有率和趨勢分析報告:按礦石類型、應用、地區和細分市場預測(2026-2033 年)
 礦業化學品市場:依產品類型、應用和地區分類
 2026年全球礦業化學品市場報告
 礦業化學品市場-全球產業規模、佔有率、趨勢、機會及預測(按類型、應用、地區和競爭格局分類,2021-2031年)
 2026-2030年全球礦業化學品市場
 礦業化學品市場規模、佔有率和成長分析(按礦石、產品、礦物、應用和地區分類)-2026-2033年產業預測