


 |
市場調查報告書
商品編碼
1906260
歐洲廢棄物管理市場:市場佔有率分析、產業趨勢與統計、成長預測(2026-2031 年)Europe Waste Management - Market Share Analysis, Industry Trends & Statistics, Growth Forecasts (2026 - 2031) |
||||||
※ 本網頁內容可能與最新版本有所差異。詳細情況請與我們聯繫。
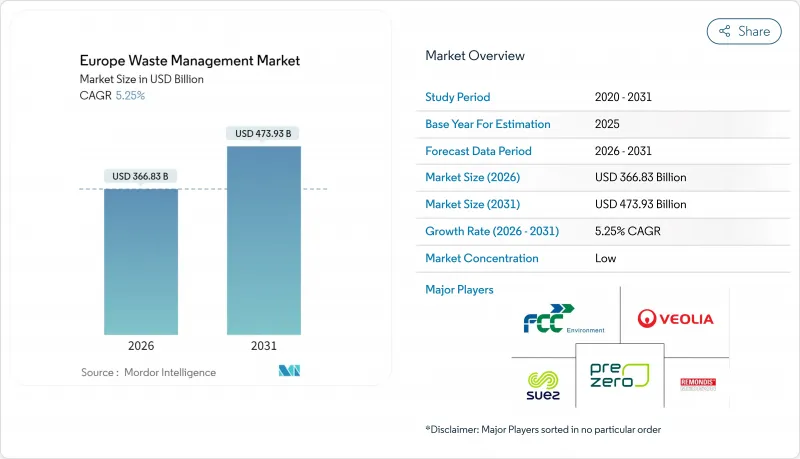
歐洲廢棄物管理市場規模預計到 2026 年將達到 3,668.3 億美元,高於 2025 年的 3,485.4 億美元,預計到 2031 年將達到 4739.3 億美元,2026 年至 2031 年的複合年成長率為 5.25%。
這一強勁的成長軌跡凸顯了歐洲廢棄物管理市場如何受益於嚴格的掩埋減量指令、對廢棄物發電 (WtE) 資產的快速成長的投資以及向循環經濟原則的明顯轉變。監管壓力,特別是歐盟要求在 2035 年將城市垃圾掩埋限制在 10% 以內,正在加速資本流入回收、化學回收和人工智慧賦能的收集系統,同時也推動了對先進處理技術需求的顯著轉變。德國憑藉其成熟的生產者延伸責任制 (EPR) 和強大的垃圾發電網路,仍然是領先的市場;而西班牙正在崛起成為成長引擎,透過大型化學回收廠和智慧垃圾桶試點計畫創造了新的產能。在整個價值鏈上,領先的營運商正在收購互補資產以建立完全一體化的服務,而以數據為中心的Start-Ups公司正在透過分析來減少卡車行駛里程、碳排放和營運成本,從而實現盈利。
歐洲廢棄物管理市場趨勢與洞察
歐盟10%的掩埋限值推動基礎建設轉型
10%的掩埋上限正在重塑歐洲廢棄物市政預算和規劃時間表。德國已將掩埋量降至接近零,而西班牙和義大利正在快速建造垃圾發電生產線和高容量分揀設施(物料回收設施),以期在2035年之前實現目標。不遵守規定的處罰,加上歐盟資金有限,迫使即使是行動落後的國家也開始將剩餘廢棄物轉化為能源回收和高階回收。像蘇伊士集團這樣的營運商已在圖盧茲啟動了一個區域供熱垃圾發電計劃,每年可從廢棄物中轉化360吉瓦時的熱量,這表明遵守監管規定能夠帶來新的公共產業收入。隨著成本最低的處置方案逐漸消失,所有相關人員都在最佳化高附加價值處理途徑,以加強循環經濟。
電子商務包裝廢棄物的快速成長催生了對專業處理的需求。
網路購物的激增催生了複雜的多層包裝,這些包裝難以以傳統的回收方式進行處理。英國將於2025年3月生效的新規要求將食物廢棄物和乾燥可回收物分開,這將推動逆向物流合作關係和專用處理生產線的建立。化學回收工廠,例如萊昂內爾巴塞爾投資4,400萬美元的韋瑟林工廠,專門處理傳統系統無法處理的複合薄膜。掌握這一細分領域的業者可以收取高額的入場費,從而為歐洲廢棄物管理市場創造新的收入來源。
廢棄物發電基礎設施在資金籌集和社會接受度方面面臨許多障礙。
一座典型的廢棄物焚化發電廠建設成本在2.2億美元至4.4億美元之間,核准流程可能需要七年時間,使得專案發起人面臨政策變化和利率上升的風險。儘管排放氣體控制技術已得到驗證,但由於當地居民的反對,尤其是在人口稠密的地區,核准流程仍被延誤。環保人士呼籲推行「零焚燒」政策,迫使開發商投資即時排放氣體監測系統和二氧化碳捕集設備,這降低了計劃的經濟效益,並抑制了新計畫的建設。
細分市場分析
到2025年,住宅廢棄物將主導歐洲廢棄物管理市場,佔55.02%的市場。這表明,可預測的住宅廢棄物產生模式是垃圾收集路線、收費系統和市政預算的基礎。柏林和哥本哈根引入智慧垃圾桶後,最佳化了垃圾收集頻率,減少了車輛行駛里程,從而抑制了成本上漲。雖然生活垃圾仍然是垃圾處理的主要來源,但商業廢棄物正成為關鍵的成長要素,預計到2031年將以7.18%的複合年成長率成長。這一成長主要受電子商務包裝和靈活辦公空間普及的推動,這些因素會產生輕便但體積較大的廢棄物,需要專門的打包技術和逆向物流。
商業廢棄物的增加將紙板、多層薄膜和廢棄IT設備等新型材料帶入歐洲廢棄物管理市場,這些都需要分類和高級處理。目前,馬德里和米蘭附近的物流中心正在試驗使用機器人技術對紙板和塑膠進行預分揀,而巴黎的辦公大樓則安裝了全方位感測器,以實現即時收集。雖然工業廢棄物仍然是一個穩定的來源,但其成長正受到製程效率提高和就近處理方式的限制。同時,隨著人口老化,醫療廢棄物的數量也相應增加,這為熱消毒和高壓釜服務等細分行業提供了支持。
其他福利:
- Excel格式的市場預測(ME)表
- 3個月的分析師支持
目錄
第1章 引言
- 研究假設和市場定義
- 調查範圍
第2章調查方法
第3章執行摘要
第4章 市場情勢
- 市場概覽
- 市場促進因素
- 歐盟掩埋減量義務(2035 年)10%
- 擴大歐盟27國的生產者延伸責任制(EPR)
- 人工智慧/物聯網智慧垃圾桶的普及率迅速提高
- 電子商務包裝廢棄物迅速增加
- 化學品回收計劃填補了不可回收材料的缺口
- 水泥共加工中對廢棄物衍生燃料(RDF)的需求
- 市場限制
- 廢棄物焚化發電廠的資本支出和社會接受度障礙
- 塑膠回收再利用能力停滯不前
- 利用人工智慧解決廢棄物處理作業中人力資源短缺問題
- 地方政府「零焚燒」運動限制了垃圾焚化發電管道的建設。
- 價值/供應鏈分析
- 監管環境
- 技術展望
- 產業吸引力-波特五力分析
- 新進入者的威脅
- 供應商的議價能力
- 買方的議價能力
- 替代品的威脅
- 競爭對手之間的競爭
第5章 市場規模及成長預測(價值,單位:十億美元)
- 按來源
- 住宅
- 商業設施(零售商店、辦公室等)
- 產業
- 醫療(健康和醫藥)
- 建築和拆除廢棄物
- 其他(引擎廢棄物、農業廢棄物等)
- 按服務類型
- 收集、運輸、分類和分離
- 處理/處置
- 掩埋處置
- 回收和資源回收
- 焚燒和廢棄物發電
- 其他(化學處理、堆肥等)
- 其他(諮詢、審核、訓練等)
- 依廢物類型
- 都市固態廢棄物
- 工業用危險廢棄物
- 電子廢棄物
- 塑膠廢棄物
- 醫療廢棄物
- 建築和拆除廢棄物
- 農業廢棄物
- 其他特殊廢棄物(放射性廢棄物等)
- 按地區
- 英國
- 德國
- 法國
- 義大利
- 西班牙
- 比荷盧經濟聯盟(比利時、荷蘭、盧森堡)
- 北歐國家(丹麥、芬蘭、冰島、挪威、瑞典)
- 其他歐洲地區
第6章 競爭情勢
- 市場集中度
- 策略趨勢
- 市佔率分析
- 公司簡介
- Veolia
- Suez
- Remondis
- FCC Environment
- PreZero
- Urbaser
- Renewi
- Biffa PLC
- Viridor
- ALBA Group
- Stena Recycling
- Cleanaway Germany
- AVR
- IAG-Ihlenberger
- Covanta Europe
- DS Smith Recycling
- Macquarie Asset Management
- Augean
- Energy Capital Partners
- Paprec Group
第7章 市場機會與未來展望
European Waste Management Market size in 2026 is estimated at USD 366.83 billion, growing from 2025 value of USD 348.54 billion with 2031 projections showing USD 473.93 billion, growing at 5.25% CAGR over 2026-2031.
This solid growth path underscores how the European waste management market is benefiting from strict landfill-reduction mandates, fast-rising investment in waste-to-energy (WtE) assets, and an unmistakable shift toward circular economy principles. Regulatory pressure, most notably the European Union's requirement to cap municipal landfilling at 10% by 2035, is accelerating capital inflows into recycling, chemical recovery, and AI-enabled collection systems, while creating a step-change in demand for advanced treatment technologies. Germany remains the anchor market, leveraging mature Extended Producer Responsibility (EPR) systems and robust WtE networks, yet Spain is now the headline growth story as large-scale chemical recycling plants and smart-bin pilots unlock new capacity. Across the value chain, leading operators are acquiring complementary assets to build fully integrated service offerings, and data-centric start-ups are monetizing analytics that cut truck mileage, carbon emissions, and operating costs.
Europe Waste Management Market Trends and Insights
EU Landfill-to-10% Mandate Drives Infrastructure Transformation
The 10% cap on landfilling is rewriting municipal budgets and planning calendars across the European waste management market. Germany already operates near-zero landfill levels, yet Spain and Italy are quickly adding WtE lines and high-throughput MRFs to stay on track for 2035 compliance. Penalties for non-compliance, coupled with restricted EU funding, are pushing even slower adopters to redirect residual waste toward energy recovery or advanced recycling. Operators such as SUEZ have responded with district-heating WtE projects that convert waste into 360 GWh of heat annually for Toulouse, demonstrating how compliance can unlock new utility revenue. As the lowest-cost disposal option disappears, every stakeholder now optimizes around higher-value treatment pathways that strengthen the circular economy.
E-commerce Packaging Waste Surge Creates Specialized Processing Demand
A spike in online shopping yields complex, multi-layer packages that frustrate conventional recycling. New UK rules starting March 2025 obligate firms to separate food waste and dry recyclables, forcing reverse-logistics partnerships and dedicated processing lines. Chemical recycling plants, such as LyondellBasell's USD 44 million Wesseling unit, target composite films that traditional systems reject. Operators who master this niche command premium gate fees, giving the European waste management market fresh revenue streams.
Waste-to-Energy Infrastructure Faces Capital and Social Acceptance Barriers
Typical WtE units cost USD 220-440 million, and permitting can stretch seven years, exposing sponsors to policy shifts and rising interest rates. Community push-back, especially in densely populated corridors, slows approvals despite proven emission controls. Activist pressure for "zero-incineration" policies has forced developers to invest in real-time emissions dashboards and carbon-capture add-ons, elevating project economics and capping capacity additions.
Other drivers and restraints analyzed in the detailed report include:
- Extended Producer Responsibility Scaling Accelerates Packaging Circularity
- AI and IoT Smart-Bin Deployments Optimize Collection Efficiency
- Plastic Recycling Capacity Stagnation Limits Circular Economy Progress
For complete list of drivers and restraints, kindly check the Table Of Contents.
Segment Analysis
Residential sources held a commanding 55.02% share of the European waste management market in 2025, underscoring how predictable household generation patterns underpin collection routes, fee structures, and municipal budgets. Smart-bin rollouts in Berlin and Copenhagen are optimizing collection frequency and cutting truck miles, keeping cost escalation in check. Although households remain the volume anchor, commercial sources are emerging as the primary growth lever with a forecast 7.18% CAGR through 2031. The surge is rooted in e-commerce packaging and the mushrooming of flexible workspaces that generate light but bulky streams requiring specialized baling and reverse logistics.
Commercial waste expansion injects new materials corrugated board, multi-layer films, and discarded IT equipment, into the European waste management market, demanding tailored segregation and advanced treatment. Logistics hubs near Madrid and Milan are piloting robotics that pre-sort cardboard and plastic, while office towers in Paris are embedding fill-level sensors to trigger just-in-time pickups. Industrial waste remains a steady contributor, yet its growth is tempered by process efficiency gains and near-sourcing, whereas healthcare waste scales in line with aging populations, supporting niche operators in thermal disinfection and autoclave services.
The European Waste Management Market Report is Segmented by Source (Residential, Commercial, Industrial, and More), by Service Type (Collection, Transportation, Sorting & Segregation, and More), by Waste Type (Municipal Solid, Industrial Hazardous, E-Waste, Plastic, and More), and by Geography (UK, Germany, France, Italy, Spain, BENELUX, NORDICS, and the Rest of Europe). The Market Forecasts are Provided in Terms of Value (USD).
List of Companies Covered in this Report:
- Veolia
- Suez
- Remondis
- FCC Environment
- PreZero
- Urbaser
- Renewi
- Biffa PLC
- Viridor
- ALBA Group
- Stena Recycling
- Cleanaway Germany
- AVR
- IAG-Ihlenberger
- Covanta Europe
- DS Smith Recycling
- Macquarie Asset Management
- Augean
- Energy Capital Partners
- Paprec Group
Additional Benefits:
- The market estimate (ME) sheet in Excel format
- 3 months of analyst support
TABLE OF CONTENTS
1 Introduction
- 1.1 Study Assumptions & Market Definition
- 1.2 Scope of the Study
2 Research Methodology
3 Executive Summary
4 Market Landscape
- 4.1 Market Overview
- 4.2 Market Drivers
- 4.2.1 EU landfill-to-10 % mandate (2035)
- 4.2.2 Extended Producer Responsibility (EPR) scaling across EU-27
- 4.2.3 Surge in AI/IoT smart-bin deployments
- 4.2.4 Rapid growth of e-commerce packaging waste
- 4.2.5 Chemical-recycling projects closing non-recyclable gap
- 4.2.6 Cement co-processing demand for Refuse-Derived Fuel (RDF)
- 4.3 Market Restraints
- 4.3.1 WtE incinerator CAPEX & social-license hurdles
- 4.3.2 Stagnation in plastic-recycling capacities
- 4.3.3 Talent shortage for AI-driven waste operations
- 4.3.4 Municipal "zero-incineration" activism curbing WtE pipelines
- 4.4 Value / Supply-Chain Analysis
- 4.5 Regulatory Landscape
- 4.6 Technological Outlook
- 4.7 Industry Attractiveness - Porter's Five Force Analysis
- 4.7.1 Threat of New Entrants
- 4.7.2 Bargaining Power of Suppliers
- 4.7.3 Bargaining Power of Buyers
- 4.7.4 Threat of Substitutes
- 4.7.5 Intensity of Competitive Rivalry
5 Market Size & Growth Forecasts (Values, In USD Billion)
- 5.1 By Source
- 5.1.1 Residential
- 5.1.2 Commercial (retail, office, etc.)
- 5.1.3 Industrial
- 5.1.4 Medical (Health and Pharmaceutical)
- 5.1.5 Construction & Demolition
- 5.1.6 Others (institutional, agricultural, etc)
- 5.2 By Service Type
- 5.2.1 Collection, Transportation, Sorting & Segregation
- 5.2.2 Disposal / Treatment
- 5.2.2.1 Landfill
- 5.2.2.2 Recycling & Resource Recovery
- 5.2.2.3 Incineration & Waste-to-Energy
- 5.2.2.4 Others (Chemical Treatment, Composting, etc.)
- 5.2.3 Others (Consulting, Audit & Training, etc.)
- 5.3 By Waste Type
- 5.3.1 Municipal Solid Waste
- 5.3.2 Industrial Hazardous Waste
- 5.3.3 E-waste
- 5.3.4 Plastic Waste
- 5.3.5 Biomedical Waste
- 5.3.6 Construction & Demolition Waste
- 5.3.7 Agricultural Waste
- 5.3.8 Other Specialized Waste (radio active, etc)
- 5.4 By Geography
- 5.4.1 United Kingdom
- 5.4.2 Germany
- 5.4.3 France
- 5.4.4 Italy
- 5.4.5 Spain
- 5.4.6 BENELUX (Belgium, Netherlands, and Luxembourg)
- 5.4.7 NORDICS (Denmark, Finland, Iceland, Norway, and Sweden)
- 5.4.8 Rest of Europe
6 Competitive Landscape
- 6.1 Market Concentration
- 6.2 Strategic Moves
- 6.3 Market Share Analysis
- 6.4 Company Profiles (includes Global level Overview, Market level overview, Core Segments, Financials as available, Strategic Information, Products & Services, Recent Developments)
- 6.4.1 Veolia
- 6.4.2 Suez
- 6.4.3 Remondis
- 6.4.4 FCC Environment
- 6.4.5 PreZero
- 6.4.6 Urbaser
- 6.4.7 Renewi
- 6.4.8 Biffa PLC
- 6.4.9 Viridor
- 6.4.10 ALBA Group
- 6.4.11 Stena Recycling
- 6.4.12 Cleanaway Germany
- 6.4.13 AVR
- 6.4.14 IAG-Ihlenberger
- 6.4.15 Covanta Europe
- 6.4.16 DS Smith Recycling
- 6.4.17 Macquarie Asset Management
- 6.4.18 Augean
- 6.4.19 Energy Capital Partners
- 6.4.20 Paprec Group
7 Market Opportunities & Future Outlook
- 7.1 White-space & Unmet-need Assessment
 廢棄物管理市場:依服務類型、廢棄物類型、處理技術和最終用戶分類-2026-2032年全球市場預測
 智慧廢棄物管理市場預測至2034年-全球分析(按組件、廢棄物類型、解決方案類型、技術、最終用戶和地區分類)
 全球 PFAS廢棄物管理市場:按處理技術、服務類型、最終用途產業和地區分類 - 預測(至 2031 年)
 2026年全球多氟烷基物質(PFAS)廢棄物管理市場報告2026年全球廢棄物管理與回收服務市場報告2026年全球紡織廢棄物管理市場報告2026年全球廢棄物管理軟體市場報告2026年全球放射性廢棄物管理系統市場報告2026年全球水務和廢棄物管理諮詢服務市場報告
 全球廢棄物管理軟體市場規模、佔有率、趨勢和成長分析報告(2026-2034年)