


 |
市場調查報告書
商品編碼
1906186
電動汽車零件:市場佔有率分析、產業趨勢與統計、成長預測(2026-2031)Electric Vehicle Parts And Components - Market Share Analysis, Industry Trends & Statistics, Growth Forecasts (2026 - 2031) |
||||||
※ 本網頁內容可能與最新版本有所差異。詳細情況請與我們聯繫。
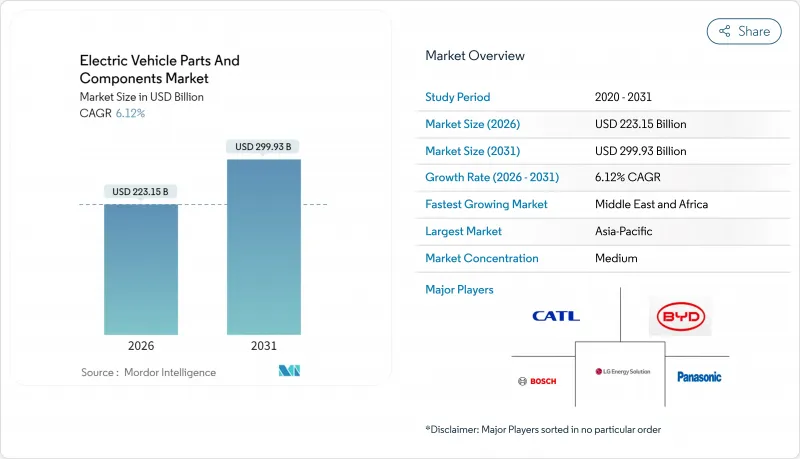
2025年電動車零件市場價值為2,102.8億美元,預計到2031年將達到2,999.3億美元,而2026年為2,231.5億美元。
預計在預測期(2026-2031 年)內,複合年成長率將達到 6.12%。
與先前兩位數的成長相比,擴張速度放緩表明,規模化生產、零件標準化和可預測的政策框架正在取代早期採用的強勁勢頭,預示著供需平衡的轉變。鋰離子電池成本下降、零排放法規同步實施以及公共快速充電基礎設施的快速部署支撐了市場需求,而整車製造商向800V平台的轉型則推高了每輛車的半導體負載。由於傳統的一級供應商、電池專家和晶圓廠主導的半導體公司在不同的零件層級競爭,市場將持續保持適度分散的局面。區域供應鏈在地化策略和關鍵礦產資源的採購挑戰將繼續影響整個價值鏈的定價權和資本投資重點。
全球電動車零件市場趨勢及洞察
鋰離子電池成本下降和超級工廠產能
2023年,隨著全球電池產能超過1,200吉瓦時,全球電池組價格降至每度電139美元。成本下降使電動車更具價格競爭力,縮短了車隊營運商的投資回收期,並鼓勵汽車製造商投資建造自有電池組組裝線。在歐洲和北美建造區域性超級工廠,既能降低匯率和物流風險,又能幫助車輛獲得國產化獎勵。供應安全易受氫氧化鋰和高鎳正極材料加工瓶頸的影響,迫使礦業公司和化學精煉企業加快產能擴張。總體而言,較便宜的電池組支援更高能量密度的電池方案,從而緩解里程焦慮,並鞏固了固態電池的技術藍圖。
政府激勵措施和零排放車輛法規
《通膨控制法案》提供與在在地採購掛鉤的7,500美元稅額扣抵,鼓勵供應商擴大美國生產。歐洲的「適航55」計畫將2035年設定為內燃機乘用車銷售的截止日期,為零部件投資確立了長期視角。中國雙軌制在2024年實現1,130萬輛電動車銷量後,持續刺激需求。補貼政策的設計重點在於國內製造、研發津貼和充電網路聯合融資,確保政策支持不僅限於零售價格下調。全球三大汽車市場監管時間表的趨同正在推動全球銷售成長,並使供應商能夠利用更廣泛、更可預測的累積訂單來攤銷研發成本。
關鍵礦物供應瓶頸
2024年,碳酸鋰價格年初顯著上漲,隨後在年底大幅下跌。這些價格波動凸顯了全球供需環境的變化,這種變化正在影響電池生產成本,並影響電動車和儲能產業的策略。煉油產能缺口而非礦石短缺是主要阻礙因素,迫使礦商和正極材料製造商加快推進前置作業時間長達兩年的氫氧化物計劃。對鈷的依賴加劇了政治風險,而硫酸鎳的短缺則延緩了高能量密度電池設計的研發。電池製造商正在轉向磷酸鋰鐵,以緩解這種受限材料的壓力。短期價格波動迫使原始設備製造商(OEM)重新評估其價格對沖策略和電池組設計藍圖。
細分市場分析
到2025年,乘用車將佔電動車零件市場收入的72.65%,而商用車將以8.46%的複合年成長率超越乘用車。用於最後一公里配送的輕型商用貨車正在使用容量合適的電池組和成本最佳化的溫度控管系統,以在走走停停的駕駛循環中高效運行。公車正在利用可預測的停車場和高容量液冷充電器,將高昂的初始零件成本分攤到日常運轉率中。中型和重型卡車開始採用續航里程達300英里的電池配置,以支援區域貨運走廊,推動了對高性能電池、兆瓦級充電耦合器和預測性維護感測器的需求。乘用車專案正日趨成熟,緊湊型和中型車型的成本競爭力日益增強。同時,豪華跨界車正在推動800V系統和碳化矽牽引逆變器的廣泛應用。在這兩個領域,車隊需求都會影響採購週期,並創造銷售量,使零件供應商能夠比僅依靠零售需求更快地擴大規模。
總體而言,商用車電氣化正在重塑售後市場需求。行駛里程的增加將加劇冷卻板、線路和接觸器的磨損,從而推高零件更換收入。車隊營運商需要具備遠端資訊處理功能的車輛狀態監控系統,這促使供應商整合感測器,並將資料傳輸到雲端進行分析。營運數據和硬體可靠性之間的相互依存關係將推動汽車製造商、遠端資訊處理服務提供者和一級供應商之間的合作,從而強化市場向服務主導經營模式的轉變。
由於電池組成本下降和充電網路日趨成熟,純電動車計畫在2025年仍將維持61.70%的收入佔有率。插電式混合動力車作為一種過渡技術,其價值提案因電池成本下降而受到削弱。燃料電池電動車(FCEV)雖然在2025年仍處於小規模應用,但隨著氫氣加註與現有貨運站的運行時間表和負載容量要求相契合,它們將在長途和重型運輸試點項目中發揮主導作用。其8.05%的複合年成長率反映的是乾線加氫站的基礎設施投資,而非乘用車的普及。
對零件的影響將大相逕庭。純電動車 (BEV) 優先考慮高能量密度電池、快速充電介面和相容 V2G 技術的動力模組。燃料電池電動車 (FCEV) 則依賴碳纖維氫氣罐、鉑基電堆和高溫壓縮機。兩條供應鏈上的企業都將實現收入來源多元化,但必須分別管理各自的品管和認證流程。那些致力於將氫能基礎設施打造為貨運樞紐的政策制定者,將決定到本十年末,燃料電池電動車的產量是否能夠成長到足以改變零件結構的程度。
區域分析
到2025年,亞太地區將佔全球電動車收入的58.10%,這主要得益於中國國內電動車註冊量的龐大規模,當年中國電動車註冊量達到1,130萬輛。中國擁有從鋰轉化、正極材料生產到馬達組裝的完整價值鏈,這使其具有成本優勢並縮短了研發週期。日本擅長高精度馬達和電力電子技術,而韓國則在NCM電池組分和軟包技術方面主導。印度的生產掛鉤激勵政策幫助振興了當地的模組工廠並吸引了外國電池製造商,在過去十年間,該地區已從最終組裝轉向更深層的零件整合。
2026年至2031年,中東和非洲地區的複合年成長率將達到7.96%,位居全球之首。由阿拉伯聯合大公國和沙烏地阿拉伯的主權財富基金領導的計劃正在資助待開發區電動汽車工廠、電池機殼和碳化矽晶片工廠,並利用太陽能資源降低電解過程的能源成本。南非則利用鉑族金屬生產燃料電池堆,利用錳生產磷酸鐵鋰電池正極材料,將礦產資源更深入地融入國內價值鏈。電網升級和可再生能源的擴張將決定該地區零件生產的成長速度。
在北美,通用汽車正投資350億美元建造電池芯和材料工廠,受益於《通貨膨脹控制法案》,該法案將稅額扣抵與國產化率掛鉤。雖然在地化生產降低了外匯風險和運輸成本,但也需要為隔膜、集電器和正極黏合劑建立新的供應鏈。在歐洲,回收配額和循環經濟指令至關重要,新建的超級工廠計劃包括一條黑料處理生產線,用於回收鈷和鎳,以用於封閉回路型正極材料。環境法規越來越重視生命週期分析軟體和可追溯性模組在每個組件材料清單中的作用。
其他福利:
- Excel格式的市場預測(ME)表
- 3個月的分析師支持
目錄
第1章 引言
- 研究假設和市場定義
- 調查範圍
第2章調查方法
第3章執行摘要
第4章 市場情勢
- 市場概覽
- 市場促進因素
- 鋰離子電池成本下降和超級工廠產量增加
- 政府獎勵和零排放車輛(ZEV)強制令
- OEM廠商向800V架構轉型推動電力電子產品需求
- 擴大公共快速充電基礎設施
- 碳化矽元件的廣泛應用將推高元件成本。
- 軟體定義電動動力傳動系統控制單元的興起
- 市場限制
- 關鍵礦產供應瓶頸
- 新興市場電網容量短缺
- 稀土元素磁鐵的價格波動
- 原始設備製造商的垂直整合給一級供應商的收入基礎帶來了壓力。
- 價值/供應鏈分析
- 監管環境
- 技術展望
- 波特五力模型
- 新進入者的威脅
- 買方/消費者的議價能力
- 供應商的議價能力
- 替代品的威脅
- 競爭對手之間的競爭
第5章 市場規模與成長預測
- 按車輛類型
- 搭乘用車
- 袖珍的
- SUV/跨界車
- 奢華
- 商用車輛
- 輕型商用車
- 公車和長途客車
- 中型和重型卡車
- 搭乘用車
- 依推進類型
- 電池式電動車
- 插電式混合動力電動車
- 油電混合車
- 燃料電池電動車
- 依組件類型
- 電池組
- 電池單元
- 電池管理系統
- 電池溫度控管系統
- 電動機
- 永磁同步
- 就職
- 切換阻力
- 電力電子
- 逆變器
- 直流-直流轉換器
- 車用充電器
- 溫度控管元件
- 熱交換器
- 冷卻板
- 線路、線束和連接器
- 感測器和控制單元
- 電池組
- 透過電壓平台
- 最高 400V 系統
- 800V系統
- 超過 800V 系統
- 按地區
- 北美洲
- 美國
- 加拿大
- 北美其他地區
- 南美洲
- 巴西
- 阿根廷
- 其他南美洲
- 歐洲
- 德國
- 英國
- 法國
- 義大利
- 西班牙
- 俄羅斯
- 其他歐洲地區
- 亞太地區
- 中國
- 印度
- 日本
- 韓國
- 澳洲
- 亞太其他地區
- 中東和非洲
- 阿拉伯聯合大公國
- 沙烏地阿拉伯
- 土耳其
- 埃及
- 南非
- 其他中東和非洲地區
- 北美洲
第6章 競爭情勢
- 市場集中度
- 策略趨勢
- 市佔率分析
- 公司簡介
- Contemporary Amperex Technology Co. Ltd(CATL)
- LG Energy Solution Ltd
- Panasonic Holdings Corp.
- BYD Co. Ltd
- Samsung SDI Co. Ltd
- Robert Bosch GmbH
- Denso Corporation
- Continental AG
- Hyundai Mobis Co. Ltd
- Toyota Industries Corporation
- BorgWarner Inc.
- Hitachi Astemo Ltd
- Nidec Corporation
- Magna International Inc.
- ZF Friedrichshafen AG
- Vitesco Technologies Group AG
- Aisin Corp.
- Valeo SA
- Infineon Technologies AG
- Aptiv PLC
第7章 市場機會與未來展望
The electric vehicle parts and components market was valued at USD 210.28 billion in 2025 and estimated to grow from USD 223.15 billion in 2026 to reach USD 299.93 billion by 2031, at a CAGR of 6.12% during the forecast period (2026-2031).
Slower expansion versus the earlier double-digit phase signals a shift toward supply-demand balance as scale manufacturing, component standardization, and predictable policy frameworks replace the momentum of early adoption. Declining lithium-ion battery costs, synchronized zero-emission mandates, and rapid public fast-charging roll-outs sustain demand, while OEM migration to 800 V platforms lifts semiconductor content per vehicle. Moderate fragmentation persists because traditional Tier-1 suppliers, battery specialists, and fab-driven semiconductor firms compete across different component layers. Regional supply-chain localization strategies and critical-mineral sourcing challenges continue to shape pricing power and capital-spending priorities across the value chain.
Global Electric Vehicle Parts And Components Market Trends and Insights
Declining Li-ion Battery Costs and Gigafactory Output
Worldwide battery pack prices fell to USD 139 per kWh in 2023 as global cell manufacturing capacity surpassed 1,200 GWh. Falling costs improve electric vehicle affordability, shorten payback periods for fleet operators, and encourage automakers to commit capital to in-house pack assembly lines. Regional gigafactory build-outs in Europe and North America mitigate currency and logistics risks while helping vehicles qualify for domestic-content incentives. Supply security remains vulnerable to lithium hydroxide and high-nickel cathode processing bottlenecks, pressuring mining companies and chemical refiners to accelerate capacity additions. Overall, cheaper packs support higher battery energy density options that keep range anxiety in check and cement the technology roadmap toward solid-state cells.
Government Incentives and ZEV Mandates
The Inflation Reduction Act provides a USD 7,500 tax credit tied to local-content thresholds, pushing suppliers to scale United States production. Europe's Fit for 55 package fixes a 2035 end-date for internal combustion passenger cars, creating long-run visibility for component investments. China's dual-credit mechanism continues stimulating demand after generating 11.3 million EV sales in 2024. Subsidy design now emphasizes domestic manufacturing, R&D grants, and charging-network co-funding, ensuring that policy support transcends retail price cuts. The convergence of regulatory timelines across the three largest auto markets lifts global volumes, allowing suppliers to amortize R&D over broader, more predictable order books.
Critical-Mineral Supply Bottlenecks
In 2024, lithium carbonate prices saw a pronounced early-year surge, only to witness a marked drop as the year drew close. These price swings underscore the evolving global supply-demand landscape, affecting battery production expenses and shaping strategies within the electric vehicle and energy storage sectors. Refining gaps rather than raw-ore shortages became the core constraint, prompting miners and cathode producers to fast-track hydroxide projects with two-year lead times. Cobalt dependence elevates political risk, while nickel sulfate tightness delays high-energy-density designs. Battery makers diversify chemistries toward lithium iron phosphate to ease pressure on constrained materials. Short-term volatility forces OEMs to hedge prices and reevaluate pack design roadmaps.
Other drivers and restraints analyzed in the detailed report include:
- OEM Shift to 800 V Architectures Elevating Power-Electronics Demand
- Rise of Software-Defined E-Powertrain Control Units
- OEM Vertical Integration Squeezing Tier-1 Revenue Pools
For complete list of drivers and restraints, kindly check the Table Of Contents.
Segment Analysis
The passenger car slice of the electric vehicle parts and components market generated 72.65% of 2025 revenue, and commercial vehicles are rising at an 8.46% CAGR, outpacing passenger-car growth. Light commercial vans for last-mile delivery favor right-sized battery packs and cost-optimized thermal systems that operate efficiently in stop-and-go duty cycles. Buses exploit predictable depots, using high-capacity liquid-cooled chargers to amortize higher upfront component costs through daily utilization. Medium and heavy trucks began adopting 300-mile battery configurations that support regional freight corridors, lifting demand for ruggedized cells, megawatt-class charging couplers, and predictive-maintenance sensors. Passenger-car programs display maturity: compact and midsize models reach cost parity, while luxury crossovers spearhead 800 V adoption and silicon-carbide traction inverters. Across both segments, fleets influence procurement cycles, pushing volumes that allow component suppliers to reach scale faster than retail demand alone.
Overall, commercial electrification reshapes aftermarket requirements. Higher daily mileage intensifies wear on cooling plates, cabling, and contactors, expanding replacement parts revenue. Fleet operators demand telematics-enabled condition monitoring, encouraging suppliers to embed sensors that feed cloud analytics. The interdependency between operations data and hardware reliability drives collaboration among vehicle OEMs, telematics providers, and Tier-1s, reinforcing the market's shift toward service-led business models.
Battery electric programs continued to hold a 61.70% revenue share in 2025, underpinned by pack cost declines and a maturing charging network. Plug-in hybrids serve as transition technologies, but declining battery costs erode their value proposition. Fuel cell electric vehicles, although a minor slice in 2025, lead long-haul and heavy-duty pilots because hydrogen refueling aligns with existing freight stop schedules and payload requirements. Their 8.05% CAGR reflects infrastructure investments in corridor refueling hubs rather than broad passenger adoption.
Component implications differ sharply. BEVs prioritize energy-dense cells, fast-charge-capable connectors, and vehicle-to-grid-compatible power modules. FCEVs rely on carbon-fiber hydrogen tanks, platinum-based stacks, and high-temperature compressors. Suppliers across both chains diversify revenue but must manage separate quality regimes and homologation procedures. Policymakers advancing freight-center hydrogen nodes will determine whether FCEV volumes scale sufficiently to alter the component mix by decade-end.
The Electric Vehicle Parts and Components Market Report is Segmented by Vehicle Type (Passenger Cars and Commercial Vehicles), Propulsion Type (Battery Electric Vehicle and More), Component Type (Battery Packs and More), Voltage Platform (Up To 400V Systems, 800V Systems, and Above 800V Systems), and Geography. The Market Forecasts are Provided in Terms of Value (USD).
Geography Analysis
Asia-Pacific held 58.10% of global revenue in 2025, leveraging China's scale from 11.3 million domestic EV registrations that year. China's complete value chain-from lithium conversion and cathode production to motor assembly-creates cost advantages and shortens development loops. Japan specializes in high-precision motors and power electronics, while South Korea leads in NCM cell formulations and pouch technology. India's production-linked incentives catalyze local module factories and attract foreign cell makers, moving the region from final-assembly to deeper component integration across the decade.
The Middle East and Africa register the fastest 2026-to-2031 CAGR at 7.96%. Sovereign wealth projects in the United Arab Emirates and Saudi Arabia finance greenfield EV plants, battery enclosures, and silicon-carbide wafer fabs, leveraging solar resources to lower energy costs for electrolytic processes. South Africa capitalizes on platinum-group metals for fuel-cell stacks and manganese for LFP cathodes, embedding minerals deeper into domestic value chains. Grid upgrades and renewable expansion will dictate the pace at which component production scales regionally.
North America benefits from the Inflation Reduction Act, which ties tax credits to domestic content, GM channeling USD 35 billion into battery-cell and material plants. Localization reduces foreign-exchange risk and freight costs, but also demands new supplier bases for separators, current collectors, and cathode binders. Europe emphasizes recycling quotas and circular-economy directives; new gigafactory projects incorporate black-mass processing lines to capture cobalt and nickel for closed-loop cathodes. Environmental regulations elevate the role of life-cycle-analysis software and traceability modules within each component bill-of-materials.
- Contemporary Amperex Technology Co. Ltd (CATL)
- LG Energy Solution Ltd
- Panasonic Holdings Corp.
- BYD Co. Ltd
- Samsung SDI Co. Ltd
- Robert Bosch GmbH
- Denso Corporation
- Continental AG
- Hyundai Mobis Co. Ltd
- Toyota Industries Corporation
- BorgWarner Inc.
- Hitachi Astemo Ltd
- Nidec Corporation
- Magna International Inc.
- ZF Friedrichshafen AG
- Vitesco Technologies Group AG
- Aisin Corp.
- Valeo SA
- Infineon Technologies AG
- Aptiv PLC
Additional Benefits:
- The market estimate (ME) sheet in Excel format
- 3 months of analyst support
TABLE OF CONTENTS
1 Introduction
- 1.1 Study Assumptions and Market Definition
- 1.2 Scope of the Study
2 Research Methodology
3 Executive Summary
4 Market Landscape
- 4.1 Market Overview
- 4.2 Market Drivers
- 4.2.1 Declining Li-Ion Battery Costs and Gigafactory Output
- 4.2.2 Government Incentives and ZEV Mandates
- 4.2.3 OEM Shift to 800-V Architectures Elevating Power-Electronics Demand
- 4.2.4 Expansion of Public Fast-Charging Infrastructure
- 4.2.5 Silicon-Carbide Device Adoption Lifting Component ASPs
- 4.2.6 Rise of Software-Defined E-Powertrain Control Units
- 4.3 Market Restraints
- 4.3.1 Critical-Mineral Supply Bottlenecks
- 4.3.2 Inadequate Grid Capacity in Emerging Markets
- 4.3.3 Rare-Earth Magnet Price Volatility
- 4.3.4 OEM Vertical Integration Squeezing Tier-1 Revenue Pools
- 4.4 Value / Supply-Chain Analysis
- 4.5 Regulatory Landscape
- 4.6 Technological Outlook
- 4.7 Porter's Five Forces
- 4.7.1 Threat of New Entrants
- 4.7.2 Bargaining Power of Buyers/Consumers
- 4.7.3 Bargaining Power of Suppliers
- 4.7.4 Threat of Substitute Products
- 4.7.5 Intensity of Competitive Rivalry
5 Market Size and Growth Forecasts (Value, USD)
- 5.1 By Vehicle Type
- 5.1.1 Passenger Cars
- 5.1.1.1 Compact
- 5.1.1.2 SUV / Crossover
- 5.1.1.3 Luxury
- 5.1.2 Commercial Vehicles
- 5.1.2.1 Light Commercial Vehicles
- 5.1.2.2 Buses and Coaches
- 5.1.2.3 Medium and Heavy Trucks
- 5.1.1 Passenger Cars
- 5.2 By Propulsion Type
- 5.2.1 Battery Electric Vehicle
- 5.2.2 Plug-in Hybrid Electric Vehicle
- 5.2.3 Hybrid Electric Vehicle
- 5.2.4 Fuel Cell Electric Vehicle
- 5.3 By Component Type
- 5.3.1 Battery Packs
- 5.3.1.1 Battery Cells
- 5.3.1.2 Battery Management Systems
- 5.3.1.3 Battery Thermal Management Systems
- 5.3.2 Electric Motors
- 5.3.2.1 Permanent-Magnet Synchronous
- 5.3.2.2 Induction
- 5.3.2.3 Switched-Reluctance
- 5.3.3 Power Electronics
- 5.3.3.1 Inverters
- 5.3.3.2 DC-DC Converters
- 5.3.3.3 On-board Chargers
- 5.3.4 Thermal-Management Components
- 5.3.4.1 Heat Exchangers
- 5.3.4.2 Cooling Plates
- 5.3.5 Wiring, Harnesses and Connectors
- 5.3.6 Sensors and Control Units
- 5.3.1 Battery Packs
- 5.4 By Voltage Platform
- 5.4.1 Up to 400 V Systems
- 5.4.2 800-V Systems
- 5.4.3 Above 800-V Systems
- 5.5 By Geography
- 5.5.1 North America
- 5.5.1.1 United States
- 5.5.1.2 Canada
- 5.5.1.3 Rest of North America
- 5.5.2 South America
- 5.5.2.1 Brazil
- 5.5.2.2 Argentina
- 5.5.2.3 Rest of South America
- 5.5.3 Europe
- 5.5.3.1 Germany
- 5.5.3.2 United Kingdom
- 5.5.3.3 France
- 5.5.3.4 Italy
- 5.5.3.5 Spain
- 5.5.3.6 Russia
- 5.5.3.7 Rest of Europe
- 5.5.4 Asia-Pacific
- 5.5.4.1 China
- 5.5.4.2 India
- 5.5.4.3 Japan
- 5.5.4.4 South Korea
- 5.5.4.5 Australia
- 5.5.4.6 Rest of Asia-Pacific
- 5.5.5 Middle-East and Africa
- 5.5.5.1 United Arab Emirates
- 5.5.5.2 Saudi Arabia
- 5.5.5.3 Turkey
- 5.5.5.4 Egypt
- 5.5.5.5 South Africa
- 5.5.5.6 Rest of Middle-East and Africa
- 5.5.1 North America
6 Competitive Landscape
- 6.1 Market Concentration
- 6.2 Strategic Moves
- 6.3 Market Share Analysis
- 6.4 Company Profiles (Includes Global Level Overview, Market Level Overview, Core Segments, Financials as Available, Strategic Information, Market Rank/Share for Key Companies, Products & Services, and Recent Developments)
- 6.4.1 Contemporary Amperex Technology Co. Ltd (CATL)
- 6.4.2 LG Energy Solution Ltd
- 6.4.3 Panasonic Holdings Corp.
- 6.4.4 BYD Co. Ltd
- 6.4.5 Samsung SDI Co. Ltd
- 6.4.6 Robert Bosch GmbH
- 6.4.7 Denso Corporation
- 6.4.8 Continental AG
- 6.4.9 Hyundai Mobis Co. Ltd
- 6.4.10 Toyota Industries Corporation
- 6.4.11 BorgWarner Inc.
- 6.4.12 Hitachi Astemo Ltd
- 6.4.13 Nidec Corporation
- 6.4.14 Magna International Inc.
- 6.4.15 ZF Friedrichshafen AG
- 6.4.16 Vitesco Technologies Group AG
- 6.4.17 Aisin Corp.
- 6.4.18 Valeo SA
- 6.4.19 Infineon Technologies AG
- 6.4.20 Aptiv PLC
7 Market Opportunities & Future Outlook
 汽車零件市場預測至2034年-按產品類型、車輛類型、通路和地區分類的全球分析
 汽車零件市場:2026-2032年全球市場預測(依產品類型、材料、車輛類型、銷售形式及銷售管道)
 2026年全球拖車穩定設備市場報告2026年全球汽車零件市場報告2026年全球汽車零件循環包裝市場報告汽車零件製造市場:2026-2032年全球市場預測(按產品類型、燃料類型、車輛類型、應用和分銷管道分類)汽車零件及配件市場:依產品類型、車輛類型、替換類型、通路分類,全球預測(2026-2032年)汽車座椅核心零件市場:依產品類型、車輛類型、動力系統、座椅類型、材質和銷售管道,全球預測,2026-2032年汽車組裝市場:依動力傳動系統、組裝工藝、車輛類型和最終用戶分類,全球預測,2026-2032年2026年全球汽車及零件銷售市場報告