


 |
市場調查報告書
商品編碼
1906173
快遞運輸:市場佔有率分析、產業趨勢與統計、成長預測(2026-2031)Express Delivery - Market Share Analysis, Industry Trends & Statistics, Growth Forecasts (2026 - 2031) |
||||||
※ 本網頁內容可能與最新版本有所差異。詳細情況請與我們聯繫。
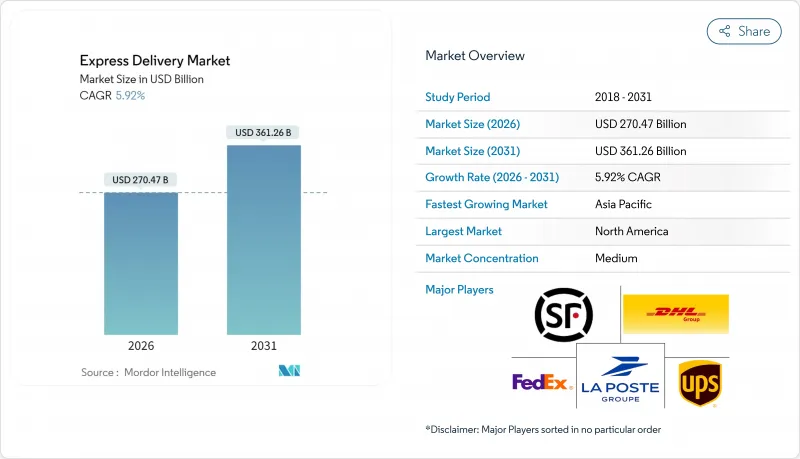
2025年快遞市場價值為2,553.5億美元,預計到2031年將達到3,612.6億美元,而2026年為2,704.7億美元。
預計在預測期(2026-2031 年)內,複合年成長率將達到 5.92%。
跨境電商活動活性化、數位化貿易通道的普及以及醫療低溫運輸需求的快速成長等因素正在鞏固市場基礎。同時,能源價格和人事費用的波動持續考驗著業者的盈利。儘管網路規模仍然是關鍵的競爭優勢,但對自動化、數據分析和替代性末端運輸方式的技術投資,正為靈活的新參與企業在細分市場挑戰現有企業創造機會。區域趨勢仍在不斷演變,北美憑藉著成熟的基礎設施和消費者對加值服務的需求,佔據最大市場佔有率;而亞太地區則在行動優先商務和數位支付普及的推動下,實現了最快的成長。
全球快遞市場趨勢與洞察
跨境電子商務導致需求快速成長
預計2025年至2030年,跨境小包裹吞吐量將以7.44%的複合年成長率成長,顯著高於整體市場成長率,標誌著市場結構轉型為國際採購。諸如美國墨加協定(USMCA)和區域全面經濟夥伴關係協定(RCEP)等貿易協定簡化了海關資料交換流程,簡化了單證程序,並將平均清關時間縮短了約三分之一。主要快遞公司建立的專用跨境樞紐作為多國分銷網路的樞紐,實現了貨物整合,從而在服務期望不斷提高的情況下仍能維持利潤率。國際小包裹的價格通常是國內小包裹的三到五倍,這為營運商提供了實現收入來源多元化的重要機會。對保稅倉庫、數位化清關平台和區域最後一公里合作的投資,進一步增強了能夠同步全球庫存流動的網路的競爭優勢。
消費者對當日達和按需配送的期望日益提高
當日送達已從新事物變為必需品,尤其是在人口密度高的大都會圈,高效的配送路線更容易實現。亞馬遜計劃在2024年將業務拓展至美國90多個城市,加劇了市場競爭,迫使競爭對手透過擴展微型倉配中心和實現即時庫存可見性來縮短訂單到交付的周期。都市區路線最佳化演算法已將單件商品的配送成本降低了15%至20%,但這僅在配送密度超過一定閾值時才有效。高階、時效性強的需求與成本敏感、配送速度較慢的需求之間的日益分化,促使承運商加強市場細分策略,合理運轉率車輛,並採用差異化收費系統。季節性促銷活動帶來的持續需求高峰,迫使承運商實施動態定價和預測性人員配置模型,以適應每小時的需求波動。
能源價格波動與人事費用上升
燃油成本通常佔快遞公司營運成本的15%至20%,因此任何價格波動都會立即影響收入。 2024年,地緣政治緊張局勢導致原油供應趨緊,迫使聯邦快遞將燃油額外費用提高了12.5%。同時,勞動力短缺問題日益嚴重,導致北美和西歐地區的司機薪資上漲了8%至12%。電氣化和路線規劃軟體雖然可以降低風險,但其投資回報期卻長達數年。財務狀況脆弱的中小型區域快遞公司正在採取激進的定價策略以維持貨運量,這進一步壓縮了利潤空間。持續的成本波動迫使快遞公司重新設計其網路,整合幹線,並在電網基礎設施允許的情況下使用替代燃料。
細分市場分析
電子商務貨運是快遞市場的基礎,預計到2025年將佔總收入的32.55%,其貨運量成長與促銷活動密切相關,並有助於數據驅動的路線最佳化。即使在成熟地區,當日達服務的普及也推動了遞送頻率的提高,從而帶動小包裹貨運量持續保持兩位數成長。
醫療保健產業對溫控可追溯系統的依賴程度日益提高,預計2026年至2031年的複合年成長率將達到6.30%。快遞業者正在整合檢驗的包裝、冗餘冷卻系統和運輸途中監控,以滿足法規要求。製造商重視全程可視性,以最大限度地降低產品變質風險,並在必要時快速召回產品。這種協同效應正在提升快遞產業在生命科學生態系統中的角色,使其從簡單的承運商轉變為策略供應鏈合作夥伴。
受高階跨境需求和海關摩擦減少的推動,國際貨運預計將以7.31%的複合年成長率(2026-2031年)快速成長,超過國內貨運。儘管地緣政治風險依然是觀點,但擁有保稅樞紐和海關專業知識的快遞公司仍保持著定價權。到2025年,國內小包裹將佔總收入的65.72%,具備規模經濟優勢,但由於競爭激烈和最後一公里人事費用上升,利潤率將受到擠壓。
國際貿易收入受益於貿易走廊的數位化舉措,這些舉措能夠加快清關速度並實現即時追蹤。跨境物流相關的快遞市場規模預計將在預測期內持續成長,這將進一步凸顯對靈活運力管理和雙邊航空貨運協議的需求。
區域分析
預計到2025年,北美將佔全球收入佔有率的35.12%,這反映了該地區較高的電子商務滲透率、完善的高速公路基礎設施以及較高的可支配收入。紐約、洛杉磯和多倫多等高密度都會區擁有當日配送網路,並提供高價位服務。美國根據《美國墨加協定》(USMCA)支持跨境物流,確保關稅穩定並簡化海關程序。同時,加拿大的雙語市場和墨西哥的加工出口走廊帶來了多元化的貨物組合。然而,人事費用上升和更嚴格的溫室氣體排放報告要求對近期盈利構成挑戰。
預計亞太地區將引領全球經濟成長,2026年至2031年間複合年成長率將達到7.45%,主要得益於行動錢包和社交電商平台開拓了新的消費群體。中國的小包裹密度遠超過其他國家,而印度、印尼和越南也正透過獎勵吸引商家,迅速擴大其市場佔有率。區域各國政府正積極推動一體化數位貿易框架,東協的單一窗口海關計畫就是一個典型例證,該計畫將合規貨物的通關時間縮短至六小時以內。儘管基礎設施瓶頸依然存在,但對智慧物流園區和區域機場的大力投資正在緩解運力缺口。
在統一關稅制度和區域自由化推動下,短途跨境貿易蓬勃發展,歐洲經濟維持穩定成長。儘管車輛電氣化強制令和堵塞費上漲增加了營運成本,但早期採用者已受益於優先配送時段和企業客戶對永續解決方案的偏好。東歐市場滲透率較低,成長空間巨大,收入成長和歐盟資金投入正在加速小包裹運輸的使用。中東/非洲和南美洲市場規模雖小,但隨著基礎設施和金融科技的進步擴大了潛在市場,這些地區的成長率已達到個位數。長期前景取決於政治穩定、海關現代化以及連接區域城市與國際貿易路線的航空貨運走廊的擴建。
其他福利:
- Excel格式的市場預測(ME)表
- 3個月的分析師支持
目錄
第1章 引言
- 研究假設和市場定義
- 調查範圍
第2章調查方法
第3章執行摘要
第4章 市場情勢
- 市場概覽
- 人口統計數據
- 按經濟活動分類的GDP分配
- 按經濟活動分類的GDP成長
- 通貨膨脹
- 經濟表現和公司概況
- 電子商務產業的趨勢
- 製造業趨勢
- 運輸和倉儲業的GDP
- 出口趨勢
- 進口趨勢
- 燃油價格
- 物流績效
- 基礎設施
- 法律規範
- 價值鍊和通路分析
- 市場促進因素
- 跨境電子商務成長推動了需求激增
- 消費者對當日達和按需配送的期望日益提高
- 擴大醫療用品運輸與發展低溫運輸物流
- 中小企業數位化在新興市場催生了新的B2C小包裝物流流
- 數位貿易通道能夠加快清關速度。
- 自動化、無人機和地面機器人正在徹底改變最後一公里配送方式。
- 市場限制
- 能源價格波動和勞動成本上升給盈利帶來挑戰。
- 複雜且不一致的國際航運法規造成了不確定性。
- 都市區中的零排放區和堵塞收費正在影響配送營運。
- 區域機場和分類中心的容量不足限制了成長。
- 市場創新
- 波特五力分析
- 新進入者的威脅
- 買方的議價能力
- 供應商的議價能力
- 替代品的威脅
- 競爭對手之間的競爭
第5章 市場規模與成長預測
- 目的地
- 國內的
- 國際的
- 運輸重量
- 重型運輸
- 輕型運輸
- 中型運輸
- 模型
- B2B
- B2C
- C2C
- 終端用戶產業
- 電子商務
- 金融服務(BFSI)
- 衛生保健
- 製造業
- 一級產業
- 批發零售(線下)
- 其他
- 交通工具
- 路
- 航空
- 其他
- 地區
- 亞太地區
- 澳洲
- 中國
- 印度
- 印尼
- 日本
- 馬來西亞
- 菲律賓
- 泰國
- 越南
- 亞太其他地區
- 歐洲
- 法國
- 德國
- 義大利
- 荷蘭
- 西班牙
- 英國
- 北歐國家
- 中歐和東歐(CEE)
- 其他歐洲地區
- 中東和非洲
- 卡達
- 沙烏地阿拉伯
- 阿拉伯聯合大公國
- 埃及
- 奈及利亞
- 南非
- 其他中東和非洲地區
- 北美洲
- 加拿大
- 墨西哥
- 美國
- 北美其他地區
- 南美洲
- 阿根廷
- 巴西
- 智利
- 南美洲其他地區
- 亞太地區
第6章 競爭情勢
- 市場集中度
- 關鍵策略舉措公司
- 市佔率分析
- 公司簡介
- Aramex PJSC
- Australian Postal Corporation
- Canada Post Corporation(Including Purolator, Inc.)
- China Post
- CJ Logistics
- Delhivery, Ltd.
- DHL Group
- Emirates Post Group
- FedEx
- InPost Sp. z oo
- International Distribution Services PLC
- Japan Post Holdings Co., Ltd.
- JD.com, Inc.(Including JD Logistics, Inc.)
- Korea Post
- La Poste Group(Including DPD Group)
- Nippon Express Holdings
- Osterreichische Post AG(Austrian Post)
- Poste Italiane
- PostNL NV
- SF Holding Co., Ltd.(Including KEX-SF)
- SG Holdings Co., Ltd.
- STO Express Co., Ltd.
- United Parcel Service of America, Inc.(UPS)
- Yamato Holdings Co., Ltd.
第7章 市場機會與未來展望
The Express Delivery Market was valued at USD 255.35 billion in 2025 and estimated to grow from USD 270.47 billion in 2026 to reach USD 361.26 billion by 2031, at a CAGR of 5.92% during the forecast period (2026-2031).
Intensifying cross-border e-commerce activity, rising adoption of digital trade corridors, and accelerating demand for healthcare cold chains are strengthening fundamentals, even as volatile energy prices and labor costs test operator profitability. Network scale remains the primary competitive moat, yet technology investments in automation, data analytics, and alternative last-mile modes are allowing agile entrants to challenge incumbents in niche pockets. Regional dynamics continue to evolve: North America commands the largest share due to mature infrastructure and consumer premium-service appetite, while Asia-Pacific registers the fastest growth on the back of mobile-first commerce and digital payment penetration.
Global Express Delivery Market Trends and Insights
Surging Demand From Cross-Border E-Commerce
Cross-border parcel volumes are climbing at a 7.44% CAGR (2025-2030), comfortably outpacing overall market growth and signaling a structural pivot toward international sourcing. Trade agreements such as USMCA and RCEP are streamlining customs data exchange and trimming paperwork, reducing average clearance times by almost one-third. Dedicated cross-border hubs established by major express carriers now anchor multi-country distribution and allow shipment consolidation that preserves margins despite higher service expectations. International parcels typically command prices three to five times domestic equivalents, providing operators with critical earnings diversity. Investment in bonded warehouses, digital customs platforms, and localized last-mile collaborations further widens the moat for networks able to synchronize global inventory flows.
Growing Consumer Expectation for Same-Day and On-Demand Delivery
Same-day fulfillment has shifted from novelty to a hygiene factor, especially in metropolitan catchments where population density supports route density economics. Amazon's 2024 roll-out to more than 90 U.S. cities accelerated competitive responses, forcing rivals to compress order-to-delivery cycles through micro-fulfillment build-outs and real-time inventory visibility. Urban route-optimization algorithms are trimming per-package costs 15-20%, but only when shipment density crosses critical thresholds. The bifurcation of premium time-sensitive demand and value-focused slower tiers enables carriers to sharpen their segmentation strategy, charging differentiated tariffs while rationalizing fleet utilization. Continuous demand peaks around seasonal promotions are pressuring operators to adopt dynamic pricing and predictive staffing models that align capacity with hourly volume swings.
Volatile Energy Prices and Rising Workforce Costs
Fuel typically constitutes 15-20% of an express carrier's operating cost base; hence, a sudden spike reverberates immediately through earnings. In 2024, FedEx lifted its fuel surcharge by 12.5% after geopolitical tensions tightened crude supply. Concurrent talent scarcity pushed driver wages up 8-12% across North America and Western Europe. Electrification and route-planning software mitigate exposure yet require multi-year payback. Smaller regional players lacking balance-sheet depth resort to aggressive pricing to retain volume, eroding margins further. Persistent cost volatility compels network redesign toward consolidation of linehaul legs and greater use of alternative fuels where grid infrastructure permits.
Other drivers and restraints analyzed in the detailed report include:
- Expanding Healthcare Shipments and Growing Cold-Chain Logistics
- SME Digitization Unlocking New B2C Parcel Flows in Emerging Markets
- Complex and Inconsistent International Shipping Rules
For complete list of drivers and restraints, kindly check the Table Of Contents.
Segment Analysis
E-commerce shipments remain the bedrock of the express delivery market with a revenue share of 32.55% in 2025, supplying predictable volume surges tied to promotional calendars and facilitating data-driven route optimization. Even mature geographies continue to register double-digit parcel growth as same-day propositions unlock incremental frequency.
Healthcare's 6.30% CAGR between 2026-2031 showcases mounting reliance on temperature-controlled, track-and-trace chains of custody. Express carriers are integrating validated packaging, redundant cooling systems, and in-flight monitoring to uphold regulatory obligations. Manufacturers value door-to-door visibility that minimizes spoilage risk and speeds product recalls when necessary. This synergy elevates the express delivery industry's role from mere carrier to strategic supply-chain partner within life-sciences ecosystems.
International shipments are expected to grow faster at a 7.31% CAGR (2026-2031), compared to domestic traffic, fueled by premium cross-border demand and reduced customs friction. Express carriers with bonded hubs and brokerage expertise command pricing power, even as geopolitical risks remain a watch point. Domestic parcels with a revenue share of 65.72% in 2025, while delivering scale economies, face margin compression from intense competition and rising last-mile labor costs.
International revenue benefits from trade corridor digitization initiatives that cut clearance times and enable real-time tracking. The express delivery market size tied to cross-border flows is on track to widen its contribution over the forecast horizon, reinforcing the need for agile capacity management and bilateral air-freight agreements.
The Express Delivery Market Report is Segmented by Destination (Domestic and International), Shipment Weight (Heavy Weight Shipments and More), Model (Business-To-Business (B2B) and More), End User Industry (E-Commerce, Healthcare, and Others), Mode of Transport (Road, Air, and Others), and Geography (Asia-Pacific, Europe, Middle East and Africa, and More). The Market Forecasts are Provided in Terms of Value (USD).
Geography Analysis
North America's 35.12% revenue share in 2025 underscores the region's advanced e-commerce penetration, expansive highway infrastructure, and high discretionary income. Dense urban agglomerations such as New York, Los Angeles, and Toronto sustain same-day networks that command premium tariffs. The United States anchors cross-border flows under the USMCA, ensuring tariff stability and simplified customs interfaces, while Canada's bilingual market and Mexico's maquiladora corridors contribute diversified volume mixes. Labor cost inflation and stricter greenhouse-gas reporting pose immediate profitability challenges.
Asia-Pacific is expected to lead global growth at a 7.45% CAGR between 2026-2031 as mobile wallets and social-commerce platforms unlock incremental shopper cohorts. China's parcel density dwarfs all peers, yet India, Indonesia, and Vietnam are scaling rapidly through merchant onboarding incentives. Regional governments promote integrated digital-trade frameworks, exemplified by ASEAN's single-window customs blueprint that trims clearance to under six hours on compliant shipments. Infrastructure bottlenecks persist, but aggressive investment in smart logistics parks and secondary-city airports is bridging capacity gaps.
Europe maintains steady expansion supported by harmonized customs codes and short-haul cross-border commerce facilitated by open internal borders. Fleet electrification mandates and escalating congestion charges elevate operating costs but also reward early adopters via preferred delivery slots and corporate customer preference for sustainable options. Eastern European markets offer under-penetrated growth avenues where rising incomes and EU funding accelerate parcel adoption. Middle East & Africa and South America collectively represent a smaller share yet deliver high-single-digit growth as infrastructure and fintech advances broaden serviceable addressable markets. Long-run prospects hinge on political stability, customs modernization, and expanded air-cargo corridors connecting secondary cities to global trade lanes.
- Aramex PJSC
- Australian Postal Corporation
- Canada Post Corporation (Including Purolator, Inc.)
- China Post
- CJ Logistics
- Delhivery, Ltd.
- DHL Group
- Emirates Post Group
- FedEx
- InPost Sp. z o.o.
- International Distribution Services PLC
- Japan Post Holdings Co., Ltd.
- JD.com, Inc. (Including JD Logistics, Inc.)
- Korea Post
- La Poste Group (Including DPD Group)
- Nippon Express Holdings
- Osterreichische Post AG (Austrian Post)
- Poste Italiane
- PostNL N.V.
- SF Holding Co., Ltd. (Including KEX-SF)
- SG Holdings Co., Ltd.
- STO Express Co., Ltd.
- United Parcel Service of America, Inc. (UPS)
- Yamato Holdings Co., Ltd.
Additional Benefits:
- The market estimate (ME) sheet in Excel format
- 3 months of analyst support
TABLE OF CONTENTS
1 Introduction
- 1.1 Study Assumptions and Market Definition
- 1.2 Scope of the Study
2 Research Methodology
3 Executive Summary
4 Market Landscape
- 4.1 Market Overview
- 4.2 Demographics
- 4.3 GDP Distribution by Economic Activity
- 4.4 GDP Growth by Economic Activity
- 4.5 Inflation
- 4.6 Economic Performance and Profile
- 4.6.1 Trends in E-Commerce Industry
- 4.6.2 Trends in Manufacturing Industry
- 4.7 Transport and Storage Sector GDP
- 4.8 Export Trends
- 4.9 Import Trends
- 4.10 Fuel Price
- 4.11 Logistics Performance
- 4.12 Infrastructure
- 4.13 Regulatory Framework
- 4.14 Value Chain and Distribution Channel Analysis
- 4.15 Market Drivers
- 4.15.1 Surging Demand Driven by Cross-Border E-Commerce Growth
- 4.15.2 Growing Consumer Expectation for Same-Day and On-Demand Delivery
- 4.15.3 Expanding Healthcare Shipments and Growing Cold-Chain Logistics
- 4.15.4 SME Digitization Unlocking New B2C Parcel Flows in Emerging Markets
- 4.15.5 Faster Border Clearance Enabled by Digital Trade Corridors
- 4.15.6 Automation, Drones, and Ground Robots Revolutionizing Last-Mile Delivery
- 4.16 Market Restraints
- 4.16.1 Volatile Energy Prices and Rising Workforce Costs Challenge Profitability
- 4.16.2 Complex and Inconsistent International Shipping Rules Create Uncertainty
- 4.16.3 Urban Zero-Emission Zones and Congestion Charges Impact Delivery Operations
- 4.16.4 Capacity Bottlenecks at Secondary Airports and Sort Centers Restrict Growth
- 4.17 Technology Innovations in the Market
- 4.18 Porter's Five Forces Analysis
- 4.18.1 Threat of New Entrants
- 4.18.2 Bargaining Power of Buyers
- 4.18.3 Bargaining Power of Suppliers
- 4.18.4 Threat of Substitutes
- 4.18.5 Competitive Rivalry
5 Market Size and Growth Forecasts (Value, USD)
- 5.1 Destination
- 5.1.1 Domestic
- 5.1.2 International
- 5.2 Shipment Weight
- 5.2.1 Heavy Weight Shipments
- 5.2.2 Light Weight Shipments
- 5.2.3 Medium Weight Shipments
- 5.3 Model
- 5.3.1 Business-to-Business (B2B)
- 5.3.2 Business-to-Consumer (B2C)
- 5.3.3 Consumer-to-Consumer (C2C)
- 5.4 End User Industry
- 5.4.1 E-Commerce
- 5.4.2 Financial Services (BFSI)
- 5.4.3 Healthcare
- 5.4.4 Manufacturing
- 5.4.5 Primary Industry
- 5.4.6 Wholesale and Retail Trade (Offline)
- 5.4.7 Others
- 5.5 Mode of Transport
- 5.5.1 Road
- 5.5.2 Air
- 5.5.3 Others
- 5.6 Geography
- 5.6.1 Asia-Pacific
- 5.6.1.1 Australia
- 5.6.1.2 China
- 5.6.1.3 India
- 5.6.1.4 Indonesia
- 5.6.1.5 Japan
- 5.6.1.6 Malaysia
- 5.6.1.7 Philippines
- 5.6.1.8 Thailand
- 5.6.1.9 Vietnam
- 5.6.1.10 Rest of Asia-Pacific
- 5.6.2 Europe
- 5.6.2.1 France
- 5.6.2.2 Germany
- 5.6.2.3 Italy
- 5.6.2.4 Netherlands
- 5.6.2.5 Spain
- 5.6.2.6 United Kingdom
- 5.6.2.7 Nordics
- 5.6.2.8 Central and Eastern Europe (CEE)
- 5.6.2.9 Rest of Europe
- 5.6.3 Middle East and Africa
- 5.6.3.1 Qatar
- 5.6.3.2 Saudi Arabia
- 5.6.3.3 United Arab Emirates
- 5.6.3.4 Egypt
- 5.6.3.5 Nigeria
- 5.6.3.6 South Africa
- 5.6.3.7 Rest of Middle East and Africa
- 5.6.4 North America
- 5.6.4.1 Canada
- 5.6.4.2 Mexico
- 5.6.4.3 United States
- 5.6.4.4 Rest of North America
- 5.6.5 South America
- 5.6.5.1 Argentina
- 5.6.5.2 Brazil
- 5.6.5.3 Chile
- 5.6.5.4 Rest of South America
- 5.6.1 Asia-Pacific
6 Competitive Landscape
- 6.1 Market Concentration
- 6.2 Key Strategic Moves
- 6.3 Market Share Analysis
- 6.4 Company Profiles (Includes Global Level Overview, Market Level Overview, Core Segments, Financials as Available, Strategic Information, Market Rank/Share for Key Companies, Products and Services, and Recent Developments)
- 6.4.1 Aramex PJSC
- 6.4.2 Australian Postal Corporation
- 6.4.3 Canada Post Corporation (Including Purolator, Inc.)
- 6.4.4 China Post
- 6.4.5 CJ Logistics
- 6.4.6 Delhivery, Ltd.
- 6.4.7 DHL Group
- 6.4.8 Emirates Post Group
- 6.4.9 FedEx
- 6.4.10 InPost Sp. z o.o.
- 6.4.11 International Distribution Services PLC
- 6.4.12 Japan Post Holdings Co., Ltd.
- 6.4.13 JD.com, Inc. (Including JD Logistics, Inc.)
- 6.4.14 Korea Post
- 6.4.15 La Poste Group (Including DPD Group)
- 6.4.16 Nippon Express Holdings
- 6.4.17 Osterreichische Post AG (Austrian Post)
- 6.4.18 Poste Italiane
- 6.4.19 PostNL N.V.
- 6.4.20 SF Holding Co., Ltd. (Including KEX-SF)
- 6.4.21 SG Holdings Co., Ltd.
- 6.4.22 STO Express Co., Ltd.
- 6.4.23 United Parcel Service of America, Inc. (UPS)
- 6.4.24 Yamato Holdings Co., Ltd.
7 Market Opportunities and Future Outlook
- 7.1 White-space and Unmet-need Assessment
 全球快遞服務市場規模、佔有率、趨勢和成長分析報告(2026-2034年)
 2026年全球快遞市場報告
 快遞市場:依遞送方式、遞送模式、服務類型、重量類別和最終用戶分類-2026-2032年全球市場預測
 快遞市場規模、佔有率和成長分析(按目的地、遞送方式、包裝類型、應用、最終用途和地區分類):產業預測(2026-2033 年)
 德國快遞:市場佔有率分析、產業趨勢、成長預測(2025-2030)
 印度的快遞市場:各類服務,各產業,地址,各終端用戶,各地區,機會,預測,2018年~2032年快捷郵件的全球市場的評估:各類服務,商務,目的地,各終端用戶,各地區,機會,預測(2017年~2031年)
 全球快遞市場