


 |
市場調查報告書
商品編碼
1906032
電網級電池:市場佔有率分析、產業趨勢與統計、成長預測(2026-2031 年)Grid Scale Battery - Market Share Analysis, Industry Trends & Statistics, Growth Forecasts (2026 - 2031) |
||||||
※ 本網頁內容可能與最新版本有所差異。詳細情況請與我們聯繫。
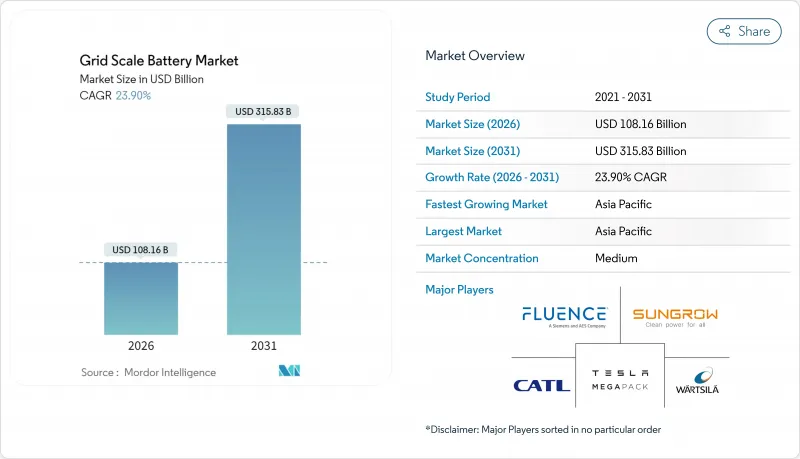
預計到 2026 年,電網級電池市場規模將達到 1,081.6 億美元,高於 2025 年的 872.9 億美元,預計到 2031 年將達到 3,158.3 億美元。
預計從 2026 年到 2031 年,其複合年成長率將達到 23.9%。
鋰離子電池技術成本的快速下降、可再生能源強制性標準的不斷提高以及電網現代化改造的迫切需求,正在加速公用事業公司、開發商和大型能源用戶的採購決策。預計到2024年,公用事業規模的裝置容量將達到173吉瓦時(GWh),其中加州和德克薩斯州的增幅最大,因為這兩個州都致力於在2030年前實現雄心勃勃的可再生能源目標。亞太地區的製造規模和政策支持鞏固了其成本優勢,而諸如2022年莫斯蘭丁火災等事故則促使業界更加關注安全創新。投資者正積極響應,以創紀錄的資金流入與主流鋰離子電池裝置互補的長時儲能技術,預示著計劃經濟效益和收益累積策略正在轉變。
全球電網級電池市場趨勢與洞察
鋰離子電池成本下降
到2023年,鋰離子電池組的平均價格將降至139美元/kWh時,較1991年下降97%。製造商預計到2026年,價格將跌破100美元/度。成本壓力主要來自中國、美國和歐洲超級工廠的擴張、自動化製造以及供應鏈的最佳化。寧德時代麒麟2.0和比亞迪刀鋒2.0平台支援6C快充和高能量密度,降低了4小時充電系統的輔助設備成本。這些改進使得購電協議成本更低,投資回收期更短,從而在利率波動的情況下維持了訂單供應。隨著單位經濟效益的提升,開發商越來越傾向於採用大規模容量的系統以實現規模經濟,從而加快安裝和試運行實踐的學習曲線。
強制性可再生能源併網
加州的目標是到2026年達到11.5吉瓦的儲能容量,墨西哥則對公用事業規模的可再生強制規定5%的儲能比例。歐洲的「Fit for 55」計畫旨在推動區域儲能容量在2024年成長超過21.9吉瓦時。政策制定者認為,儲能對於實現淨零排放目標、整合可變太陽能和風能發電以及推遲新增燃氣調峰電廠容量至關重要。各國正在藍圖,將強制規定轉變為競爭性競標和技術中立的容量市場,使開發商能夠獲得降低資金籌措風險的收益合約。強制性規定也正在加速混合型太陽能+儲能購電協議(PPA)的採購,這些協議能夠保障計劃電力購買並規避市場風險。
關鍵礦產供應鏈限制因素
預計到2030年,鋰、鈷和鎳的需求量可能超過現有礦產產能,這將使開發商面臨價格上漲和交付延遲的風險。中國佔全球鋰精煉量的60%和鈷產量的75%,而剛果民主共和國(剛果(金))佔全球鈷礦產量的70%,造成了地緣政治風險的集中。鈉離子電池和鐵空氣電池正成為新興的替代技術:中國運作全球首座100兆瓦時鈉離子電池工廠,美國公司正在試行一種永續100小時的鐵空氣電池系統。產業聯盟正致力於推動多元化購電協議和回收政策,以降低對原料的依賴。
細分市場分析
到2025年,鋰離子電池將佔據電網級電池市場91.30%的佔有率,市場規模將達到796.8億美元,成為最大的市場。預計到2031年,鋰離子電池將以24.1%的複合年成長率成長。其成本優勢(可與天然氣高峰競爭)、高往返效率以及成熟的供應鏈是其主要優勢。在鋰離子電池中,磷酸鋰鐵在固定式應用的效能優於鎳錳鈷電池,循環壽命可達4000-6000次,且熱失控風險較低。同時,寧德時代(CATL)的第二代鈉離子電池模組有望成為寒冷氣候下的理想替代方案,製造商預計將於2026年開始商業出貨。
2025年,液流電池在電網級電池市場中所佔佔有率不足3%,但在澳洲、加州和德國的長時儲能競標中,液流電池卻處於主導。釩液流電池系統擁有25年的使用壽命和近乎零劣化,從而降低了計劃生命週期內每兆瓦時的平準化成本。 2025年,為了因應可再生能源發電過剩,電力公司要求電池放電時間達到8小時或更長,這導致對鐵空氣和鋅混合陰極技術的風險投資激增。日本的固態電池先導計畫正在採用硫化物電解質來提高體積能量密度,但距離商業化生產仍需數年時間。因此,電池化學成分的最佳化方向正從單一主導平台轉向針對特定應用的最佳化。
電網級電池市場報告按電池化學成分(鋰離子電池、鉛酸電池、鈉基電池、液流電池和其他新興化學成分)、應用(頻率調節、能源套利/計費管理、負載轉移和尖峰用電調節、可再生能源時間轉移等)和地區(北美、歐洲、亞太地區、南美以及中東和非洲)進行細分。
區域分析
預計到2025年,亞太地區將佔據電網級電池市場46.20%的佔有率,並在2026年至2031年間以25.2%的複合年成長率成長,這主要得益於中國的製造業優勢和出口導向政策獎勵。寧德時代(CATL)和比亞迪等中國供應商正在歐洲和北美洽談數吉瓦級契約,同時投資興建區域組裝廠以降低貿易壁壘。日本的脫碳藍圖正在推動合作,力求2027年建成100兆瓦的儲能容量;印度的生產連結獎勵計畫計畫則為國內超級工廠提供補貼。韓國正在探索高階固態電池,並尋求高階出口市場;澳洲則利用其豐富的可再生能源資源部署儲能設施,以穩定電力供應。
北美地區總裝置容量排名第二,這主要得益於《反通膨法案》的稅額扣抵和各州可再生能源採購強制規定。加州的藍圖目標是到2026年實現11.5吉瓦的裝置容量,而德克薩斯州已簽署超過8吉瓦的併網協議,這將推動該地區電網級電池市場在2026年達到293億美元。聯邦能源監管委員會(FERC)的排隊改革旨在清理540吉瓦的待核准儲能計劃,但平均併網時間仍超過三年,這構成了巨大的阻力。加拿大正優先考慮在偏遠地區建造電池-柴油混合發電系統,以提高電網可靠性;墨西哥則透過對新建可再生能源計劃強制實施5%的儲能比例,創造了新的需求管道。
2024年,歐洲能源安全問題的迫切性日益凸顯,屆時裝置容量將達到21.9吉瓦。德國聯邦網路管理局已認可電池在容量儲備和黑啟動服務中的作用,英國容量市場也已簽訂15年合約以穩定現金流。南歐國家正在將公用事業規模的太陽能光電發電與儲能結合,以緩解午後棄電。北歐營運商正在將水力發電與儲能結合,以加強頻率調節。歐盟清潔能源一攬子計畫下的立法統一了電網服務定義,並促進了電池儲能服務的跨境交易。監管方面的利多因素將推動該地區在2031年實現23.2%的複合年成長率。
其他福利:
- Excel格式的市場預測(ME)表
- 3個月的分析師支持
目錄
第1章 引言
- 研究假設和市場定義
- 調查範圍
第2章調查方法
第3章執行摘要
第4章 市場情勢
- 市場概覽
- 市場促進因素
- 鋰離子電池成本下降
- 強制性可再生能源併網
- 電網可靠性和韌性的必要性
- 有利的政策獎勵(例如個人退休帳戶、歐盟淨零排放目標等)
- 太陽能+儲能混合購電協議及收益積累
- 資料中心微電網需要穩定、綠能。
- 市場限制
- 關鍵礦產供應鏈限制因素
- 對電池安全和火災風險的擔憂
- 網格連接佇列中的瓶頸
- 輔助業務收益的抵銷作用
- 供應鏈分析
- 監管環境
- 技術展望
- 波特五力模型
- 供應商的議價能力
- 買方的議價能力
- 新進入者的威脅
- 替代品的威脅
- 競爭對手之間的競爭
第5章 市場規模與成長預測
- 電池化學
- 鋰離子電池(LFP、NMC、NCA)
- 鉛酸電池
- 鈉基(NAS,鈉離子)
- 液流電池(釩、鐵、鋅溴)
- 其他新興化學物質(金屬空氣電池、固態電池)
- 透過使用
- 頻率調節
- 能源套利/建築管理
- 負荷轉移和尖峰用電調節
- 利用可再生能源進行時間轉移
- 電力傳輸和分配的延誤
- 黑尾鶲及其系統發育支持
- 按地區
- 北美洲
- 美國
- 加拿大
- 墨西哥
- 歐洲
- 德國
- 英國
- 法國
- 義大利
- 西班牙
- 北歐國家
- 其他歐洲地區
- 亞太地區
- 中國
- 印度
- 日本
- 韓國
- 東南亞國協
- 澳洲和紐西蘭
- 亞太其他地區
- 南美洲
- 巴西
- 阿根廷
- 南美洲其他地區
- 中東和非洲
- 沙烏地阿拉伯
- 阿拉伯聯合大公國
- 南非
- 埃及
- 其他中東和非洲地區
- 北美洲
第6章 競爭情勢
- 市場集中度
- 策略趨勢(併購、聯盟、購電協議)
- 市場佔有率分析(主要企業的市場排名和佔有率)
- 公司簡介
- Tesla
- Fluence
- Sungrow Power Supply
- Contemporary Amperex Technology(CATL)
- Wartsila
- Panasonic
- LG Energy Solution
- Samsung SDI
- BYD
- East Penn
- GS Yuasa
- Clarios
- AES Corporation
- Powin Energy
- Hitachi Energy
- NEC ES(Koch)
- EnerSys
- ESS Tech
- Ambri
- Redflow
- EnerVenue
第7章 市場機會與未來展望
The Grid Scale Battery Market size in 2026 is estimated at USD 108.16 billion, growing from 2025 value of USD 87.29 billion with 2031 projections showing USD 315.83 billion, growing at 23.9% CAGR over 2026-2031.
Rapid cost declines in lithium-ion technology, binding renewable-portfolio standards, and urgent grid-modernization programs are accelerating procurement decisions across utilities, developers, and large energy users. Utility-scale installations climbed to 173 GWh in 2024, with California and Texas accounting for the largest additions as both states pursue aggressive 2030 renewable targets. Asia-Pacific's manufacturing scale and policy support have entrenched cost leadership, while performance incidents such as the 2022 Moss Landing fire sharpen industry focus on safety innovation. Investors are responding with record capital flows into long-duration technologies that complement the dominant lithium-ion fleet, signaling an evolution in project economics and revenue stacking strategies.
Global Grid Scale Battery Market Trends and Insights
Declining Lithium-Ion Battery Costs
Average lithium-ion pack prices fell to USD 139/kWh in 2023, a 97% slide since 1991, and manufacturers expect sub-USD 100/kWh levels by 2026. Cost pressure stems from gigafactory scaling, manufacturing automation, and optimized supply chains in China, the United States, and Europe. CATL's Qilin 2.0 and BYD's Blade 2.0 platforms add 6C fast-charging and higher energy densities, reducing balance-of-plant costs for four-hour systems. These improvements unlock lower-priced power-purchase agreements and shorten payback periods, sustaining order pipelines even amid interest-rate volatility. As unit economics improve, developers increasingly favor larger system formats to capture economies of scale, accelerating the learning curve on installation and commissioning practices.
Renewable-Energy Integration Mandates
California seeks 11.5 GW of storage by 2026, Mexico now requires 5% storage in utility-scale renewables, and Europe's Fit-for-55 package drives a regional buildout exceeding 21.9 GWh in 2024. Policymakers view storage as essential for meeting net-zero milestones, integrating variable solar and wind, and postponing gas-peaking additions. National roadmaps are translating mandates into competitive auctions and technology-neutral capacity markets, enabling developers to secure revenue contracts that de-risk financing. Mandates also accelerate procurement of hybrid solar-plus-storage PPAs that guarantee project offtake and hedge merchant risk.
Critical-Mineral Supply-Chain Constraints
Forecast demand for lithium, cobalt, and nickel could outstrip committed mining capacity by 2030, exposing developers to price spikes and delivery delays. China refines 60% of global lithium and 75% of cobalt, while the DRC holds 70% of mined cobalt output, concentrating geopolitical risk. Sodium-ion and iron-air chemistries are emerging alternatives: China commissioned the world's first 100 MWh sodium-ion plant in 2024, and US firms pilot iron-air systems for 100-hour endurance. Industry consortia lobby for diversified offtake agreements and recycling mandates to ease raw-material dependency.
Other drivers and restraints analyzed in the detailed report include:
- Grid Reliability & Resiliency Needs
- Favourable Policy Incentives (IRA, EU Net-Zero)
- Battery-Storage Safety & Fire-Risk Concerns
For complete list of drivers and restraints, kindly check the Table Of Contents.
Segment Analysis
The lithium-ion segment controlled 91.30% of the grid-scale battery market share in 2025 and generated the largest contribution to the grid-scale battery market size at USD 79.68 billion, expanding at a 24.1% CAGR through 2031. Cost parity with peaking gas, high round-trip efficiencies, and established supply chains sustain its position. Within lithium-ion, lithium iron phosphate eclipses nickel manganese cobalt for stationary use, offering 4,000-6,000 cycles and lower thermal-runaway risk. Meanwhile, CATL's second-generation sodium-ion modules promise viable substitution in cold climates, and manufacturers anticipate commercial shipments by 2026.
Flow batteries recorded <3% of the 2025 grid-scale battery market size but lead long-duration tenders in Australia, California, and Germany. Vanadium redox systems deliver 25-year lifespans with near-zero degradation, translating to lower levelized-cost per MWh over project life. Venture investments in iron-air and zinc hybrid-cathode technologies surged in 2025 as utilities seek 8+ hour discharge for renewable over-generation. Solid-state battery pilots in Japan use sulfide electrolytes to improve volumetric energy density, although commercial output remains several years away. The chemistry mix is therefore shifting toward application-specific optimization rather than a single winning platform.
The Grid Scale Battery Market Report is Segmented by Battery Chemistry (Lithium-Ion, Lead-Acid, Sodium-Based, Flow Batteries, and Other Emerging Chemistries), Application (Frequency Regulation, Energy Arbitrage/Bill Management, Load Shifting and Peak Shaving, Renewable-Energy Time-Shifting, and More), and Geography (North America, Europe, Asia-Pacific, South America, and Middle East and Africa).
Geography Analysis
Asia-Pacific held 46.20% of the grid-scale battery market share in 2025 and is on track for a 25.2% CAGR between 2026 and 2031, anchored by China's manufacturing dominance and export-oriented policy incentives. Chinese suppliers such as CATL and BYD negotiate multi-gigawatt contracts in Europe and North America while investing in regional assembly plants to mitigate trade barriers. Japan's decarbonization roadmap triggers partnerships to build 100 MW of storage by 2027, and India's Production Linked Incentive scheme channels subsidies toward local gigafactories. South Korea pursues high-end solid-state research and premium export niches, whereas Australia leverages abundant renewables to install storage for firmed capacity.
North America ranks second in total deployments, catalyzed by the Inflation Reduction Act's tax credits and state-level renewable procurement mandates. California's roadmap targets 11.5 GW by 2026, and Texas exceeds 8 GW in interconnection agreements, propelling the region's grid-scale battery market size to USD 29.3 billion in 2026. Queue reforms by FERC aim to clear 540 GW of pending storage-linked projects, yet interconnection timelines still average more than three years, representing a material headwind. Canada prioritizes grid reliability in remote provinces through battery-diesel hybrid systems, and Mexico enforces a 5% storage requirement for new renewable projects, creating an emerging demand pipeline.
Europe's urgency accelerated after 2024 energy-security disruptions, lifting installed capacity to 21.9 GWh that year. Germany's Bundesnetzagentur recognizes batteries in capacity reserves and black-start services, while the United Kingdom's capacity market secures 15-year contracts that stabilize cash flows. Southern European nations integrate storage with utility-scale solar to mitigate afternoon curtailment, and Nordic operators pair batteries with hydropower to enhance frequency control. Legislation under the EU Clean Energy Package harmonizes grid-service definitions, fostering cross-border trading of battery services. Regulatory tailwinds underpin a 23.2% CAGR for the region through 2031.
- Tesla
- Fluence
- Sungrow Power Supply
- Contemporary Amperex Technology (CATL)
- Wartsila
- Panasonic
- LG Energy Solution
- Samsung SDI
- BYD
- East Penn
- GS Yuasa
- Clarios
- AES Corporation
- Powin Energy
- Hitachi Energy
- NEC ES (Koch)
- EnerSys
- ESS Tech
- Ambri
- Redflow
- EnerVenue
Additional Benefits:
- The market estimate (ME) sheet in Excel format
- 3 months of analyst support
TABLE OF CONTENTS
1 Introduction
- 1.1 Study Assumptions & Market Definition
- 1.2 Scope of the Study
2 Research Methodology
3 Executive Summary
4 Market Landscape
- 4.1 Market Overview
- 4.2 Market Drivers
- 4.2.1 Declining lithium-ion battery costs
- 4.2.2 Renewable-energy integration mandates
- 4.2.3 Grid-reliability & resiliency needs
- 4.2.4 Favourable policy incentives (IRA, EU Net-Zero, etc.)
- 4.2.5 Hybrid solar-plus-storage PPAs & revenue stacking
- 4.2.6 Data-centre micro-grids demand firm clean power
- 4.3 Market Restraints
- 4.3.1 Critical-mineral supply-chain constraints
- 4.3.2 Battery-storage safety & fire-risk concerns
- 4.3.3 Interconnection-queue bottlenecks
- 4.3.4 Ancillary-service revenue cannibalisation
- 4.4 Supply-Chain Analysis
- 4.5 Regulatory Landscape
- 4.6 Technological Outlook
- 4.7 Porter's Five Forces
- 4.7.1 Bargaining Power of Suppliers
- 4.7.2 Bargaining Power of Buyers
- 4.7.3 Threat of New Entrants
- 4.7.4 Threat of Substitutes
- 4.7.5 Competitive Rivalry
5 Market Size & Growth Forecasts
- 5.1 By Battery Chemistry
- 5.1.1 Lithium-ion (LFP, NMC, NCA)
- 5.1.2 Lead-acid
- 5.1.3 Sodium-based (NAS, Sodium-ion)
- 5.1.4 Flow Batteries (Vanadium, Iron, Zinc-Br)
- 5.1.5 Other Emerging Chemistries (Metal-air, Solid-state)
- 5.2 By Application
- 5.2.1 Frequency Regulation
- 5.2.2 Energy Arbitrage/Bill Management
- 5.2.3 Load Shifting and Peak Shaving
- 5.2.4 Renewable-Energy Time-Shifting
- 5.2.5 Transmission and Distribution Deferral
- 5.2.6 Black-Start and Grid-Forming Support
- 5.3 By Geography
- 5.3.1 North America
- 5.3.1.1 United States
- 5.3.1.2 Canada
- 5.3.1.3 Mexico
- 5.3.2 Europe
- 5.3.2.1 Germany
- 5.3.2.2 United Kingdom
- 5.3.2.3 France
- 5.3.2.4 Italy
- 5.3.2.5 Spain
- 5.3.2.6 Nordic Countries
- 5.3.2.7 Rest of Europe
- 5.3.3 Asia-Pacific
- 5.3.3.1 China
- 5.3.3.2 India
- 5.3.3.3 Japan
- 5.3.3.4 South Korea
- 5.3.3.5 ASEAN Countries
- 5.3.3.6 Australia and New Zealand
- 5.3.3.7 Rest of Asia-Pacific
- 5.3.4 South America
- 5.3.4.1 Brazil
- 5.3.4.2 Argentina
- 5.3.4.3 Rest of South America
- 5.3.5 Middle East and Africa
- 5.3.5.1 Saudi Arabia
- 5.3.5.2 United Arab Emirates
- 5.3.5.3 South Africa
- 5.3.5.4 Egypt
- 5.3.5.5 Rest of Middle East and Africa
- 5.3.1 North America
6 Competitive Landscape
- 6.1 Market Concentration
- 6.2 Strategic Moves (M&A, Partnerships, PPAs)
- 6.3 Market Share Analysis (Market Rank/Share for key companies)
- 6.4 Company Profiles (includes Global level Overview, Market level overview, Core Segments, Financials as available, Strategic Information, Products & Services, and Recent Developments)
- 6.4.1 Tesla
- 6.4.2 Fluence
- 6.4.3 Sungrow Power Supply
- 6.4.4 Contemporary Amperex Technology (CATL)
- 6.4.5 Wartsila
- 6.4.6 Panasonic
- 6.4.7 LG Energy Solution
- 6.4.8 Samsung SDI
- 6.4.9 BYD
- 6.4.10 East Penn
- 6.4.11 GS Yuasa
- 6.4.12 Clarios
- 6.4.13 AES Corporation
- 6.4.14 Powin Energy
- 6.4.15 Hitachi Energy
- 6.4.16 NEC ES (Koch)
- 6.4.17 EnerSys
- 6.4.18 ESS Tech
- 6.4.19 Ambri
- 6.4.20 Redflow
- 6.4.21 EnerVenue
7 Market Opportunities & Future Outlook
- 7.1 White-Space & Unmet-Need Assessment
 電網級電池市場:2026-2032年全球市場預測(依化學成分、部署模式、應用、充電方式、輸出容量範圍、電池類型及能源容量範圍分類)
 2034年電網級電池系統市場預測-全球分析(按電池類型、系統組件、儲能時間、所有權、併網方式、應用、最終用戶和地區分類)
 電網級電池市場規模、佔有率、成長及全球產業分析:按類型、應用和區域分類,預測2026-2034年
 2026年全球電網級電池儲能市場報告全球電網級電池市場規模、佔有率、趨勢和成長分析報告(2026-2034)
 電網級電池市場-全球產業規模、佔有率、趨勢、機會和預測,按電池類型、所有權、應用、地區和競爭格局分類,2021-2031年預測
 電網級電池市場規模、佔有率和成長分析(按電池類型、所有權模式、應用和地區分類)-2026-2033年產業預測
 全球電網規模蓄電池市場規模、佔有率和趨勢分析報告:按類型、應用、地區和細分市場預測(2025-2030)到 2030 年電網規模電池儲存市場預測:按類型、所有權模式、額定功率、應用和地區進行的全球分析到 2030 年電網規模電池市場預測:按電池類型、安裝、額定功率、所有權模式、應用和地區進行的全球分析