


 |
市場調查報告書
商品編碼
1852175
鉑族金屬:市場佔有率分析、產業趨勢、統計數據和成長預測(2025-2030 年)Platinum Group Metals - Market Share Analysis, Industry Trends & Statistics, Growth Forecasts (2025 - 2030) |
||||||
※ 本網頁內容可能與最新版本有所差異。詳細情況請與我們聯繫。
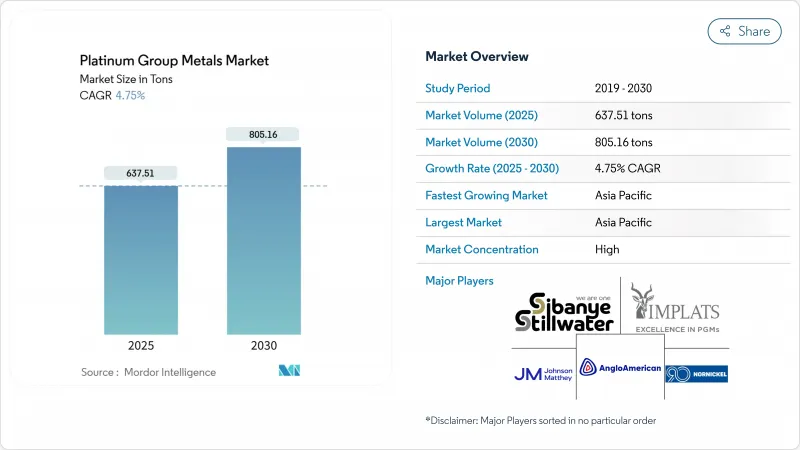
預計到 2025 年鉑族金屬市場規模為 637.51 噸,到 2030 年將達到 805.16 噸,預測期(2025-2030 年)複合年成長率為 4.75%。
鉑族金屬市場受惠於兩大需求趨勢:汽油和混合動力汽車對汽車觸媒的持續需求,以及固體電解質膜(PEM)氫能技術的快速普及。催化劑材料正從鈀轉向鉑,這支撐了短期市場情緒。長期機會包括綠色氫能建設,預計到2025年,綠色氫能建設將使PEM電解槽的鉑金需求逐年翻倍。銥供應緊張、亞洲珠寶飾品需求堅挺,以及先進電子行業對鉑族金屬的需求不斷成長,這些因素共同支撐了鉑金價格的基本面。同時,價格持續波動以及南非生產成本上升,阻礙了長期承購協議的達成,尤其是與燃料電池原始設備製造商(OEM)的協議。
全球鉑族金屬市場趨勢與洞察
汽車產業對觸媒轉換器的需求不斷成長
到2024年,乘用車、混合動力汽車和重型卡車將佔鉑族金屬(PGM)總消耗量的60%。總合的歐盟7和全國六b排放標準推動了每輛車鉑族金屬用量的增加,抵消了汽油產量下降的影響。混合動力汽車催化劑尤其需要鉑族金屬,預計2025年鉑族汽車催化劑的需求將達到八年來的最高點,為324萬盎司。重型卡車催化劑對鉑族金屬的需求量將更高,這將創造一個盈利的細分市場,使汽車製造商免受乘用車催化劑市場不利因素的影響。亞洲市場的規模,加上政府對清潔引擎的獎勵,使得鉑族金屬市場與汽車產業的消費需求緊密相關。
北美PEM電解槽擴張
預計到2030年,與氫氣相關的鉑金需求將達到87.5萬盎司,約佔鉑金總消費量的10%,並在2025年翻倍。加拿大40%的清潔氫能稅額扣抵和美國的《通膨抑制法案》正在推動多吉瓦級電解槽。銥的短缺一直是限制市場發展的一大障礙,預計2024年銥的產量僅7.7噸。諸如Smoltec公司的奈米塗層等技術突破對於擴大供應至關重要,該塗層可將PEM電池中的銥負載量降低95%。這些市場發展趨勢鞏固了鉑族金屬市場長期成長的基礎。
高昂的生產成本
在南非,電力中斷和勞工動盪推高了採礦成本:英美資源集團鉑金公司2024年的採礦成本上漲了5%,達到每盎司6E鉑金20,922蘭特。深層礦床需要先進的冷凍設備和礦脈穩定措施,這增加了固定成本。在價格低迷時期,輪流開採的生產商往往只能勉強維持收支平衡甚至虧損,從而減少了用於擴張的資本能力。這些動態對鉑族金屬市場的供應安全構成下行風險,並限制了長期合約的簽訂。
細分市場分析
到2024年,鈀金將佔鉑族金屬市場佔有率的47%,汽油催化劑仍將是其消費的主導領域。銥主要用於PEM電解槽陽極,預計到2030年,其複合年成長率將達到9.04%,成為鉑族金屬中成長最快的。供應緊張和技術信心將維持銥金的溢價,並使其在未來幾年內對鉑族金屬市場的貢獻進一步擴大。鉑金的復興主要得益於其在汽油催化劑領域的替代應用。銠的替代品有限,推高了其價格;而釕和鋨在小眾化學和數據存儲應用領域日益普及,從而實現了收入來源的多元化。
PEM系統和先進記憶體的持續成長將推動銥和釕從特殊應用領域走向主流應用。 2024年銠的平均價格將達到每盎司5,375美元,顯示供應緊張。鉑的廣泛供應以及替代品的持續供應將支撐強勁的需求並穩定鉑族金屬市場。對於釕而言,來自技術廢棄物(例如硬碟)回收的提高將增強供應安全性,從而緩解價格上漲壓力,並強化循環經濟的概念,這對電子產品製造商至關重要。
到2024年,珠寶飾品將佔鉑族金屬消費量的29%,鞏固其作為最大應用領域的地位,尤其是在中國、日本和印度。儘管宏觀經濟環境疲軟,但奢侈品需求依然強勁,且鉑金具有投資吸引力,因此其消費量基準保持穩定。同時,燃料電池產業正以29.66%的複合年成長率成長,這得益於多吉瓦級電解槽專案和固定式發電專案的推動。因此,預計到2030年,用於燃料電池堆的鉑族金屬市場規模將快速擴張。
隨著排放標準不斷提高,汽車觸媒仍然至關重要。隨著半導體節點縮小至3奈米及以下,鉑金在電子領域的應用日益廣泛。玻璃纖維製造和顏料應用充分利用了鉑金的高熔點,而醫療設備則利用其生物相容性製造導管和支架。化學製程催化劑,尤其是在石油煉製中的硝酸和加氫裂解反應中,鉑金的使用量持續穩定且顯著,其多樣化的應用能夠有效抵禦經濟波動的影響。
鉑族金屬報告按金屬類型(鉑、鈀、銠及其他)、應用領域(汽車催化劑、電氣電子及其他)、來源(原生(採礦)、回收/再生)、終端用戶行業(汽車、工業化學品及其他)和地區(亞太、北美、歐洲、南美、中東和非洲)進行細分。市場預測以噸為單位。
區域分析
到2024年,亞洲將主導鉑族金屬市場,佔據52%的市場佔有率,這主要得益於中國作為全球最大的鈀金(用於汽車催化劑)和鉑金(用於珠寶)消費國的地位。北京正尋求提升國內定價權,廣州期貨交易所也正在上市鉑金和鈀金合約,以提高市場流動性,並鼓勵工業用戶對沖其長期部位。日本珠寶飾品需求的復甦和印度婚禮飾品需求的增加將為區域市場提供成長動力,而台灣和韓國的電子產業叢集也將提振工業消費。
受德國和英國更嚴格的排放法規推動,歐洲汽車催化劑消費量強勁成長,催化劑用量也隨之增加。即將實施的歐7排放標準將進一步刺激乘用車和重型車輛對鉑族金屬的需求成長,但向電動車的轉型將帶來複雜的供需平衡。歐洲也正致力於鉑族金屬的回收利用:莊信萬豐和優美科經營先進的設施,以極低的排放回收汽車催化劑金屬,從而支持循環經濟目標並穩定鉑族金屬市場。
由於氫能政策和汽油車銷售的持續成長,北美正在崛起為經濟成長極。加拿大是世界第三大鈀金生產國和第四大鉑金生產國,預計2022年將開採71萬盎司鉑金,主要產自安大略省。渥太華的清潔氫能稅收優惠政策將加速電解槽計劃,從而為該地區帶來更多鉑金和銥的需求。美國的《通膨控制法案》將透過資助氫能中心建設進一步推動這一發展趨勢,增強鉑族金屬市場的長期前景。
其他福利:
- Excel格式的市場預測(ME)表
- 3個月的分析師支持
目錄
第1章 引言
- 研究假設和市場定義
- 調查範圍
第2章調查方法
第3章執行摘要
第4章 市場情勢
- 市場概覽
- 市場促進因素
- 汽車產業對觸媒轉換器的需求不斷成長
- 北美PEM電解槽建置燃料鉑金需求
- 電子業對鉑、鈀和釕的需求不斷成長
- 鈀和鉑替代催化劑推動雙金屬崛起
- 亞太地區國家珠寶飾品消費成長
- 市場限制
- 高成本
- 價格波動會阻止燃料電池原始設備製造商長期退出市場。
- 回收競賽
- 價值鏈分析
- 波特五力模型
- 供應商的議價能力
- 買方的議價能力
- 新進入者的威脅
- 替代品的威脅
- 競爭程度
第5章 市場規模與成長預測
- 按金屬類型
- 鉑
- 鈀
- 銠
- 銥
- 釕
- 鋇
- 透過使用
- 汽車觸媒
- 電氣和電子
- 燃料電池
- 玻璃、陶瓷、顏料
- 珠寶
- 醫療(牙科和製藥)
- 化工
- 其他(航太、感測器、水處理、法醫鑑定)
- 按來源
- 初級(採礦)
- 回收/二次性
- 按最終用途行業分類
- 車
- 工業化學品
- 可再生能源和氫能
- 電子和半導體
- 珠寶飾品和奢侈品
- 醫療設備
- 玻璃製造
- 煉油
- 其他
- 按地區
- 亞太地區
- 中國
- 印度
- 日本
- 韓國
- ASEAN
- 亞太其他地區
- 北美洲
- 美國
- 加拿大
- 墨西哥
- 歐洲
- 德國
- 英國
- 法國
- 義大利
- 西班牙
- 其他歐洲地區
- 南美洲
- 巴西
- 阿根廷
- 其他南美洲國家
- 中東和非洲
- 沙烏地阿拉伯
- 南非
- 其他中東和非洲地區
- 亞太地區
第6章 競爭情勢
- 市場集中度
- 策略趨勢
- 市佔率分析
- 公司簡介
- African Rainbow Minerals Limited
- Anglo American plc
- BASF SE
- DOWA Holdings Co., Ltd
- Glencore
- Heraeus Group
- Impala Platinum Holdings Ltd
- Ivanhoe Mines
- Jinchuan Group International Resources Co. Ltd
- Johnson Matthey
- Norilsk Nickel
- Northam Platinum Holdings Limited
- Platinum Group Metals Ltd
- Sibanye-Stillwater Limited
- TANAKA PRECIOUS METAL GROUP Co., Ltd.
- Umicore
- Vale
第7章 市場機會與未來展望
The Platinum Group Metals Market size is estimated at 637.51 tons in 2025, and is expected to reach 805.16 tons by 2030, at a CAGR of 4.75% during the forecast period (2025-2030).
The Platinum group metals market benefits from a dual-track demand profile: sustained autocatalyst requirements in gasoline and hybrid vehicles and fast-accelerating adoption in proton-exchange-membrane (PEM) hydrogen technologies. The ongoing palladium-for-platinum shift in catalysts buoys short-term sentiment, while longer-term opportunity stems from green-hydrogen build-outs expected to double platinum demand for PEM electrolysers year-on-year through 2025. Iridium supply constraints, jewelry's resilience in Asia, and increasing PGM intensity in advanced electronics collectively support price fundamentals. Simultaneously, persistent price volatility and rising South African production costs inhibit long-dated offtake contracts, especially for fuel-cell OEMs.
Global Platinum Group Metals Market Trends and Insights
Growing Demand for Catalytic Converters from the Automotive Sector
Passenger cars, hybrids, and heavy-duty trucks together consumed 60% of all PGMs in 2024. Stricter Euro 7 and China VI-b standards raise PGM loadings per vehicle, offsetting lower gasoline production volumes. Hybrid-vehicle catalysts are especially PGM-dense, pushing projected platinum autocatalyst demand to an eight-year high of 3.24 million oz in 2025. Heavy-duty vehicles require even higher PGM doses, creating a profitable niche that shields producers from passenger-car headwinds. Asia's scale, coupled with government incentives for cleaner engines, keeps the Platinum group metals market firmly reliant on automotive offtake.
PEM Electrolyser Build-out in North America
Platinum demand linked to hydrogen is expected to double again in 2025, after reaching 875 koz by 2030, roughly 10% of total platinum use. Canada's 40% clean-hydrogen tax credit and the United States' Inflation Reduction Act underpin multi-gigawatt electrolyser orders. Iridium scarcity is an obstacle: 2024 production barely reached 7.7 tons. Technology breakthroughs, such as Smoltek's nanoscale coatings that reduce iridium loading in PEM cells by 95%, are vital for scaling supply. These developments solidify a long-run growth platform for the Platinum group metals market.
High Production Costs
Electricity load shedding and labor unrest in South Africa elevated mining costs: Anglo American Platinum's unit cost rose 5% to ZAR 20,922 per 6E oz in 2024. Deep-level deposits require advanced refrigeration and reef stabilization, elevating the fixed-cost base. During price troughs, swing producers operate at breakeven or losses, reducing capital capacity for expansion. These dynamics add downside risk to supply stability and limit long-term contracts for the Platinum group metals market.
Other drivers and restraints analyzed in the detailed report include:
- Increasing Electronics Demand
- Palladium-for-Platinum Substitution
- Price Volatility Deterring Long-Term Off-Take
For complete list of drivers and restraints, kindly check the Table Of Contents.
Segment Analysis
Palladium captured 47% of the Platinum group metals market in 2024 as gasoline catalysts continued to dominate consumption. Iridium, used chiefly in PEM electrolyser anodes, is projected to grow at a 9.04% CAGR through 2030, the fastest among all PGMs. Tight supply and technological reliance sustain iridium's price premium, magnifying its contribution to the Platinum group metals market size in later years. Platinum's renaissance stems from its substitution into gasoline catalysts; over 600 koz converted demand in 2023 alone. Rhodium's limited substitutes command high pricing, while ruthenium and osmium gain traction in niche chemical and data-storage applications, diversifying revenue streams.
Persistent load-growth in PEM systems and advanced memory drives iridium and ruthenium from specialty to mainstream status. Prices for rhodium averaged USD 5,375 /oz in 2024, indicative of constrained supply. Platinum's wider availability and ongoing substitution lock-in robust demand, stabilizing the Platinum group metals market. Recycling yields of technological scraps such as disk drives improve ruthenium supply security, tempering upward price pressure but reinforcing circular-economy credentials prized by electronics firms.
Jewelry retained 29% of PGM consumption in 2024, cementing its status as the largest application, especially across China, Japan, and India. Quiet-luxury trends and platinum's investment appeal sustain baseline volumes despite macroeconomic softness. The fuel-cell segment, however, is racing ahead with a 29.66% CAGR, supported by multi-gigawatt electrolyser initiatives and stationary power programs. The Platinum group metals market size allocated to fuel-cell stacks is thus expected to expand rapidly through 2030.
Autocatalysts remain indispensable as lawmakers raise emission-control thresholds. Electronics applications keep climbing as semiconductor nodes shrink below 3 nm. Glass fibre production and pigment uses leverage platinum's high melting point, while medical devices rely on its biocompatibility for catheters and stents. Chemical-process catalysts, notably in nitric-acid and refinery hydrocracking, continue to consume sizable but steady PGM volumes, offering a diversified application base that hedges cyclical swings.
The Platinum Group Metals Report is Segmented by Metal Type (Platinum, Palladium, Rhodium, and More), Application (Auto Catalysts, Electrical and Electronics, and More), Source (Primary (Mined), Recycled/Secondary), End-Use Industry (Automotive, Industrial Chemicals, and More), and Geography (Asia-Pacific, North America, Europe, South America, and Middle East and Africa). The Market Forecasts are Provided in Terms of Volume (tons).
Geography Analysis
Asia held a commanding 52% share of the Platinum group metals market in 2024, underpinned by China's status as the largest consumer of palladium for autocatalysts and platinum for jewelry. Beijing's pursuit of domestic pricing power led the Guangzhou Futures Exchange to list platinum and palladium contracts, deepening liquidity and encouraging industrial users to hedge long-term positions Nikkei Asia. Japan's jewelry rebound and India's wedding-driven ornament demand strengthen regional pull, while the region's electronics clusters in Taiwan and South Korea reinforce industrial consumption.
Europe, driven by stringent emissions mandates in Germany and the United Kingdom, has experienced significant growth in consumption, leading to heightened catalyst loadings. The forthcoming Euro 7 framework stimulates additional PGM intensity in both passenger and heavy-duty platforms, although the electric-vehicle transition creates a complex demand balance. Europe also champions PGM recycling: Johnson Matthey and Umicore run state-of-the-art facilities that recover autocatalyst metals with minimal emissions, supporting circular-economy targets and stabilizing the Platinum group metals market.
North America is emerging as a growth pole thanks to hydrogen policies and sustained gasoline vehicle sales. Canada is the world's third-largest palladium and fourth-largest platinum producer, with 710,000 oz mined in 2022, chiefly in Ontario Natural Resources Canada. Ottawa's clean-hydrogen tax incentive accelerates electrolyser projects, channelling additional platinum and iridium demand into the region. The United States' Inflation Reduction Act amplifies this trajectory by funding hydrogen hubs, reinforcing long-run prospects for the Platinum group metals market.
- African Rainbow Minerals Limited
- Anglo American plc
- BASF SE
- DOWA Holdings Co., Ltd
- Glencore
- Heraeus Group
- Impala Platinum Holdings Ltd
- Ivanhoe Mines
- Jinchuan Group International Resources Co. Ltd
- Johnson Matthey
- Norilsk Nickel
- Northam Platinum Holdings Limited
- Platinum Group Metals Ltd
- Sibanye-Stillwater Limited
- TANAKA PRECIOUS METAL GROUP Co., Ltd.
- Umicore
- Vale
Additional Benefits:
- The market estimate (ME) sheet in Excel format
- 3 months of analyst support
TABLE OF CONTENTS
1 Introduction
- 1.1 Study Assumptions and Market Definition
- 1.2 Scope of the Study
2 Research Methodology
3 Executive Summary
4 Market Landscape
- 4.1 Market Overview
- 4.2 Market Drivers
- 4.2.1 Growing Demand for Catalytic Converters from the Automotive Industry
- 4.2.2 PEM Electrolyser Build-out in North America Accelerating Platinum Demand
- 4.2.3 Increasing Demand for Platinum, Palladium, and Ruthenium from the Electronics Industry
- 4.2.4 Palladium-for-Platinum Catalyst Substitution Creating Dual-Metal Upswing
- 4.2.5 Growing Jewelry Consumption in Asia-Pacific Countries
- 4.3 Market Restraints
- 4.3.1 High Costs Involved in Production and Maintenance
- 4.3.2 Price Volatility Deterring Long-Term Off-Take by Fuel-Cell OEMs
- 4.3.3 Recycling Competition
- 4.4 Value Chain Analysis
- 4.5 Porter's Five Forces
- 4.5.1 Bargaining Power of Suppliers
- 4.5.2 Bargaining Power of Buyers
- 4.5.3 Threat of New Entrants
- 4.5.4 Threat of Substitutes
- 4.5.5 Degree of Competition
5 Market Size and Growth Forecasts (Volume)
- 5.1 By Metal Type
- 5.1.1 Platinum
- 5.1.2 Palladium
- 5.1.3 Rhodium
- 5.1.4 Iridium
- 5.1.5 Ruthenium
- 5.1.6 Osmium
- 5.2 By Application
- 5.2.1 Auto Catalysts
- 5.2.2 Electrical and Electronics
- 5.2.3 Fuel Cells
- 5.2.4 Glass, Ceramics and Pigments
- 5.2.5 Jewellery
- 5.2.6 Medical (Dental and Pharma)
- 5.2.7 Chemical Industry
- 5.2.8 Other (Aerospace, Sensors, Water, Forensics)
- 5.3 By Source
- 5.3.1 Primary (Mined)
- 5.3.2 Recycled/Secondary
- 5.4 By End-Use Industry
- 5.4.1 Automotive
- 5.4.2 Industrial Chemicals
- 5.4.3 Renewable Energy and Hydrogen
- 5.4.4 Electronics and Semiconductors
- 5.4.5 Jewellery and Luxury Goods
- 5.4.6 Healthcare Devices
- 5.4.7 Glass Manufacturing
- 5.4.8 Petroleum Refining
- 5.4.9 Others
- 5.5 By Geography
- 5.5.1 Asia-Pacific
- 5.5.1.1 China
- 5.5.1.2 India
- 5.5.1.3 Japan
- 5.5.1.4 South Korea
- 5.5.1.5 ASEAN
- 5.5.1.6 Rest of Asia-Pacific
- 5.5.2 North America
- 5.5.2.1 United States
- 5.5.2.2 Canada
- 5.5.2.3 Mexico
- 5.5.3 Europe
- 5.5.3.1 Germany
- 5.5.3.2 United Kingdom
- 5.5.3.3 France
- 5.5.3.4 Italy
- 5.5.3.5 Spain
- 5.5.3.6 Rest of Europe
- 5.5.4 South America
- 5.5.4.1 Brazil
- 5.5.4.2 Argentina
- 5.5.4.3 Rest of South America
- 5.5.5 Middle East and Africa
- 5.5.5.1 Saudi Arabia
- 5.5.5.2 South Africa
- 5.5.5.3 Rest of Middle East and Africa
- 5.5.1 Asia-Pacific
6 Competitive Landscape
- 6.1 Market Concentration
- 6.2 Strategic Moves
- 6.3 Market Share Analysis
- 6.4 Company Profiles (includes Global level Overview, Market level overview, Core Segments, Financials as available, Strategic Information, Market Rank/Share for key companies, Products and Services, and Recent Developments)
- 6.4.1 African Rainbow Minerals Limited
- 6.4.2 Anglo American plc
- 6.4.3 BASF SE
- 6.4.4 DOWA Holdings Co., Ltd
- 6.4.5 Glencore
- 6.4.6 Heraeus Group
- 6.4.7 Impala Platinum Holdings Ltd
- 6.4.8 Ivanhoe Mines
- 6.4.9 Jinchuan Group International Resources Co. Ltd
- 6.4.10 Johnson Matthey
- 6.4.11 Norilsk Nickel
- 6.4.12 Northam Platinum Holdings Limited
- 6.4.13 Platinum Group Metals Ltd
- 6.4.14 Sibanye-Stillwater Limited
- 6.4.15 TANAKA PRECIOUS METAL GROUP Co., Ltd.
- 6.4.16 Umicore
- 6.4.17 Vale
7 Market Opportunities and Future Outlook
- 7.1 White-Space and Unmet-Need Assessment
- 7.2 Usage of Platinum in Green Technology
 日本銠市場報告(按來源、產品類型、應用、最終用途產業和地區分類,2026-2034年)
 鉑金礦業市場規模、佔有率及成長分析(按開採方法、礦石品位、礦床類型、應用及地區分類)-產業預測(2026-2033)
 全球鈀金市場-2025-2030年預測
 釕市場按應用、終端用戶產業、產品類型、純度等級、形態和銷售管道分類-2025-2032年全球預測鈀金市場依用途、形態、純度等級、終端用戶產業及通路分類-2025-2032年全球預測鉑金市場按產品類型、最終用戶、分銷管道、應用和價格分佈-2025-2032年全球預測銠市場按來源類型、形態和應用分類-2025-2032年全球預測鋱箔市場(按產品類型、厚度、形狀、純度、最終用途和分銷管道)—2025-2030 年全球預測
 全球鑄鋁加熱板市場全球鉑族金屬市場