


 |
市場調查報告書
商品編碼
1852166
奈米材料:市場佔有率分析、行業趨勢、統計數據和成長預測(2025-2030 年)Nanomaterials - Market Share Analysis, Industry Trends & Statistics, Growth Forecasts (2025 - 2030) |
||||||
※ 本網頁內容可能與最新版本有所差異。詳細情況請與我們聯繫。
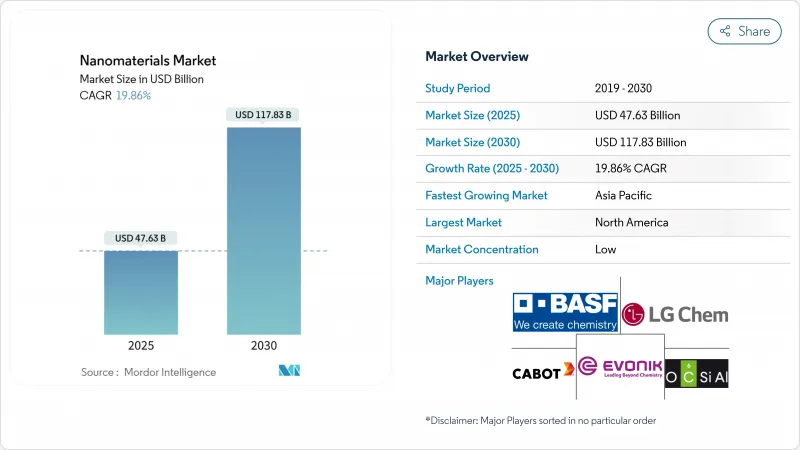
奈米材料市場規模預計在 2025 年達到 476.3 億美元,預計到 2030 年將達到 1,178.3 億美元,預測期(2025-2030 年)複合年成長率為 19.86%。
這一迅猛成長反映了半導體拋光、mRNA療法、軟性顯示器和高效水處理等領域商業性應用的激增。向3奈米以下製程節點的持續轉型、創紀錄的疫苗研發預算以及在缺水地區建造海水淡化設施,都為奈米材料市場注入了新的動力。奈米碳管和石墨烯衍生物的規模化生產以及成本降低方面的學習曲線正在不斷收窄,而公共部門的奈米技術專案則為平台創新提供了源源不斷的推動。儘管如此,市場仍需應對貴金屬原料價格的波動,並控制小型參與企業為維持競爭優勢而購買原子層沉積生產線所需的高昂資本成本。
全球奈米材料市場趨勢與洞察
亞洲新建晶圓廠推動半導體級奈米漿料的發展
亞洲半導體製造設施的崛起,正推動著對高純度奈米漿料前所未有的需求,而奈米漿料是化學機械拋光 (CMP) 製程的關鍵材料。這些材料能夠實現3奈米及以下先進節點半導體製造的超高精度拋光。一座領先的工廠每年可消耗超過300噸奈米漿料,隨著晶片結構日益複雜,需求仍在持續成長。此外,台積電在亞利桑那州投資400億美元的晶圓廠也正在亞洲以外創造新的需求。
由於mRNA生產能力的提高,對脂質奈米顆粒的需求增加。
在mRNA疫苗和治療應用蓬勃發展的推動下,脂質奈米顆粒(LNP)生產市場正經歷爆炸性成長。北美目前佔據LNP市場領先地位,但歐洲正透過大力投資產能,穩步縮小與北美的差距。 LNP的應用範圍已從傳統的疫苗擴展到基因治療和癌症治療領域。近期的一些創新旨在利用人工智慧技術來最佳化LNP配方,從而提高療效並最大限度地減少副作用。
技術成本不斷上漲
奈米碳管和半導體級金屬氧化物的批次產率仍然對反應器運作時間和能耗非常敏感。即使年產能達到數千噸,其生產成本也比傳統散裝填料高出五到十倍,這限制了它們在價格彈性較大的應用領域(例如一般塑膠)中的應用。
細分市場分析
預計到2024年,奈米顆粒將佔據奈米材料市場69%的佔有率,這反映了它們在催化、抗菌塗層和導電漿料等領域的成熟應用。該細分市場受益於噴霧乾燥和火焰熱解製程的日益成熟,過去十年間,這些製程已使每公斤成本降低了一半。同時,隨著生產方式從克級化學氣相沉積(CVD)轉向連續浮動催化劑反應器的轉變,奈米管細分市場正以21.15%的複合年成長率快速成長。
奈米管的興起得益於多項專利,例如將拉伸強度提高三倍的扭曲碳奈米管紗線,以及將儲氫容量提升至7 wt%以上的鐵摻雜結構。奈米黏土和奈米線分別受到阻燃聚合物共混物和高頻射頻元件需求的推動,實現了兩位數以上的成長。
非聚合物有機材料,主要包括炭黑和石墨,預計到2024年將佔據55%的收入佔有率,其應用領域涵蓋輪胎化合物、電磁干擾屏蔽外殼和導電母粒。奈米多孔炭黑的表面積現已超過1500 m² g⁻¹,拓展了其在儲能吸附領域的應用。
然而,聚合物基奈米材料的複合年成長率最高,達19.99%。噴霧冷凍乾燥技術的進步催生了脂質-聚合物雜化物,這些雜化物能夠自組裝成可生物分解的載體,使藥物遞送研究人員能夠實現可調控的釋放動力學和低免疫抗原性。在塗佈領域,奈米矽氧烷接枝賦予塗層自修復性能,在室溫下即可在數分鐘內恢復磨損後的光澤。
區域分析
到2024年,北美將佔據奈米材料市場38.5%的佔有率,聯邦政府的研發支出將超過380億美元,2025年的研發需求預計將達到22億美元。該地區的發展動力源於半導體產業的復甦和在mRNA療法領域的領先地位,從而形成了一個願意為超高純度產品買單的高階客戶群。
亞太地區正以22.26%的複合年成長率快速擴張,預計到2030年,其營收將超過北美。中國的「十四五」規劃將奈米技術列為核心支柱,推動公共資金每年以兩位數的速度成長,以加速建造2奈米以下的首座奈米晶圓廠。韓國和日本在OLED和電池供應鏈中保持領先地位,而印度則將奈米材料應用於面向農村居民的低成本水質淨化計劃中。
歐洲秉持永續性和嚴格監管的理念,建立了清晰的形象。 「地平線歐洲」計畫為基於更安全設計的目標奈米材料津貼資助,並鼓勵出口企業在研發早期階段就對產品的生命週期影響進行認證。中東地區正在擴大海水淡化產能,並採用奈米多孔膜技術,目標是在沙烏地阿拉伯實現溫室氣體排放量比熱法減少94%。巴西是世界第二大生物基作物生產國,正透過作物專用奈米肥料提高養分利用效率,引領南美洲生物基作物奈米肥料的應用。
其他福利:
- Excel格式的市場預測(ME)表
- 3個月的分析師支持
目錄
第1章 引言
- 研究假設和市場定義
- 調查範圍
第2章調查方法
第3章執行摘要
第4章 市場情勢
- 市場概覽
- 市場促進因素
- 亞洲新建晶圓廠推動半導體級奈米漿料的生產
- 北美和歐洲對脂質奈米顆粒和mRNA疫苗生產能力的需求
- 軟性OLED生產線中的金銀奈米墨水
- 奈米材料市場應用日益成長
- 海灣合作理事會海水淡化工程建設推動奈米多孔膜技術發展
- 市場限制
- 技術成本不斷上漲
- 原物料價格波動
- 昂貴的原子層沉積反應器限制了中小企業的規模化生產。
- 價值鏈分析
- 波特五力模型
- 供應商的議價能力
- 買方的議價能力
- 新進入者的威脅
- 替代品的威脅
- 競爭對手之間的競爭
第5章 市場規模與成長預測
- 依產品類型
- 奈米顆粒
- 奈米金屬
- 金子
- 銀
- 鉑
- 鈦
- 鋁
- 非金屬氧化物
- 氧化鋁
- 氧化鐵
- 二氧化鈦
- 二氧化矽
- 氧化鋅
- 複合氧化物
- 磷酸鈣
- 稀土元素氧化物
- 鈦酸鋰
- 矽氫化物
- 奈米纖維
- 奈米管
- 奈米黏土
- 奈米線
- 奈米顆粒
- 依結構類型
- 非聚合物有機奈米材料
- 炭黑
- 奈米碳管
- 適體
- 低分子OLED
- 活性碳
- 奈米碳管複合材料
- 聚合物奈米材料
- 被覆劑和黏合劑
- 轉染試劑
- 診斷劑
- 藥物輸送車輛
- 織物處理
- 光學鍍膜
- 奈米多孔過濾膜
- 介電膜
- OLED薄膜
- 非聚合物有機奈米材料
- 按材料類別
- 碳基
- 金屬底座
- 金屬氧化物和陶瓷基
- 基於聚合物和脂質的
- 終端用戶產業
- 建造
- 電子學
- 能源
- 衛生保健
- 個人護理
- 橡皮
- 其他終端用戶產業
- 按地區
- 亞太地區
- 中國
- 印度
- 日本
- 韓國
- ASEAN
- 亞太其他地區
- 北美洲
- 美國
- 加拿大
- 墨西哥
- 歐洲
- 德國
- 英國
- 義大利
- 法國
- 其他歐洲地區
- 南美洲
- 巴西
- 阿根廷
- 其他南美洲國家
- 中東和非洲
- 沙烏地阿拉伯
- 南非
- 其他中東和非洲地區
- 亞太地區
第6章 競爭情勢
- 市場集中度
- 策略趨勢
- 市佔率分析
- 公司簡介
- ACS Material
- American Elements
- Arkema
- Ascensus
- BASF SE
- Cabot Corporation
- Chasm Advanced Materials, Inc.
- Evonik Industries AG
- Jiangsu Cnano Technology Co., Ltd
- LG Chem
- Merck KGaA
- Nano-C
- Nanocyl SA
- NAWAH
- OCSiAl
- QuantumSphere, Inc.
- Raymor Industries Inc.
- Resonac Holdings Corporation
- Solesence
- US Research Nanomaterials, Inc.
- Zyvex Technologies
第7章 市場機會與未來展望
The Nanomaterials Market size is estimated at USD 47.63 billion in 2025, and is expected to reach USD 117.83 billion by 2030, at a CAGR of 19.86% during the forecast period (2025-2030).
The sharp upswing mirrors a surge of commercial adoption across semiconductor polishing, mRNA-based therapeutics, flexible displays, and high-efficiency water treatment. Continuous node migration below 3 nm, record vaccine research and development budgets, and desalination build-outs in water-stressed regions are giving the nanomaterials market fresh momentum. Production scale-ups in carbon nanotubes and graphene derivatives are intensifying cost-down learning curves, while public-sector nanotechnology programs underpin a steady pipeline of platform innovations. Even so, the market must absorb volatility in precious-metal feedstocks and contain the high capital charges of atomic-layer-deposition lines that smaller entrants need to compete.
Global Nanomaterials Market Trends and Insights
Semiconductor-grade Nano-slurries Fuelled by New Asian Fabs
The rise of semiconductor fabrication facilities in Asia is driving unprecedented demand for high-purity nano-slurries essential for chemical-mechanical planarization (CMP) processes. These materials enable ultra-precise polishing for advanced node semiconductor manufacturing at 3nm and below. A single leading-edge fab can consume over 300 tons of nano-slurries annually, with demand increasing as chip architectures grow more complex. Additionally, TSMC's USD 40 billion Arizona fab complex is creating new demand centers beyond Asia.
Lipid Nanoparticles Demand from mRNA Capacity Build-outs
Fueled by the surge in mRNA vaccine and therapeutic applications, the lipid nanoparticle (LNP) manufacturing market is witnessing explosive growth. While North America holds the lead in the LNP market, European production capacity is seeing significant investments, steadily closing the gap. Beyond their traditional use in vaccines, LNPs are now making inroads into gene therapies and cancer treatments. Recent innovations are harnessing AI to fine-tune LNP formulations, aiming to boost efficacy and minimize side effects.
Higher Costs of Technology
Batch yields for carbon nanotubes and semiconductor-grade metal oxides remain sensitive to reactor uptime and energy intensity. Even at multi-kiloton annual capacity, unit production costs are five to ten times higher than conventional bulk fillers, constraining uptake in price-elastic applications such as commodity plastics.
Other drivers and restraints analyzed in the detailed report include:
- Gold and Silver Nano-inks in Flexible OLED Lines
- Increasing Usage of Nanomaterials in Water Treatment
- Raw Material Price Fluctuation
For complete list of drivers and restraints, kindly check the Table Of Contents.
Segment Analysis
Nanoparticles held 69% of nanomaterials market share in 2024, reflecting their well-established role in catalysts, antimicrobial coatings, and conductive pastes. The segment benefits from mature spray-dry and flame-pyrolysis routes that cut cost per kilogram in half over the past decade. Meanwhile, the nanotubes sub-segment is advancing at a 21.15% CAGR as output shifts from gram-scale CVD to continuous floating-catalyst reactors.
Wider nanotube deployment is supported by patent clusters covering twisted CNT yarns that triple tensile strength and Fe-doped structures that lift hydrogen-storage capacity beyond 7 wt%. Nanoclays and nanowires record mid-teen growth, with demand tied to flame-retardant polymer blends and high-frequency RF devices, respectively.
Non-polymer organic grades, largely carbon black and graphitic forms, posted 55% revenue share in 2024 by supplying tire compounds, EMI-shielding housings, and conductive masterbatches. Nano-porous carbon blacks now deliver surface areas above 1,500 m2 g-1, expanding adsorption applications in energy storage.
Polymeric nanomaterials, however, track the fastest 19.99% CAGR. Advances in spray-freeze-drying techniques yield lipid-polymer hybrids that self-assemble into biodegradable carriers, giving drug-delivery researchers tunable release kinetics and low immunogenicity. In coatings, nano-siloxane grafting imparts self-healing performance that restores gloss after abrasion within minutes at room temperature.
The Nanomaterials Market Report Segments the Industry by Product Type (Nanoparticles, Nanofibers, Nanotubes, and More), Structure Type (Non-Polymer Organic Nanomaterials and Polymeric Nanomaterials), Material Category (Carbon-Based, Metal-Based, and More), End-User Industry (Construction, Electronics, Energy, and More), and Geography (Asia-Pacific, North America, Europe, South America, and Middle East and Africa).
Geography Analysis
North America held 38.5% nanomaterials market share in 2024, anchored by federal research and development outlays exceeding USD 38 billion and a record USD 2.2 billion request for 2025. The region's semiconductor resurgence and leadership in mRNA therapeutics create a premium customer base willing to pay for ultra-high-purity grades.
Asia Pacific is expanding at a 22.26% CAGR, a pace that could lift its revenue past North America before 2030. China's 14th Five-Year Plan lists nanotechnology as a core pillar, driving double-digit annual increases in public funding and accelerating first-time fab builds below 2 nm. South Korea and Japan sustain their leadership in OLED and battery supply chains, while India channels nanomaterials into low-cost water purification projects that serve rural populations.
Europe maintains a distinct profile built on sustainability and regulatory rigor. Horizon Europe grants target safer-by-design nanomaterials, prompting exporters to certify life-cycle impacts early in development. The Middle East scales desalination capacity incorporating nano-porous membranes, with Saudi-Arabia seeking a 94% greenhouse-gas cut relative to thermal methods. Brazil spearheads South American adoption through crop-specific nano-fertilisers that raise nutrient-use efficiency, supported by its standing as the second-largest biotech-crop producer worldwide.
- ACS Material
- American Elements
- Arkema
- Ascensus
- BASF SE
- Cabot Corporation
- Chasm Advanced Materials, Inc.
- Evonik Industries AG
- Jiangsu Cnano Technology Co., Ltd
- LG Chem
- Merck KGaA
- Nano-C
- Nanocyl SA
- NAWAH
- OCSiAl
- QuantumSphere, Inc.
- Raymor Industries Inc.
- Resonac Holdings Corporation
- Solesence
- US Research Nanomaterials, Inc.
- Zyvex Technologies
Additional Benefits:
- The market estimate (ME) sheet in Excel format
- 3 months of analyst support
TABLE OF CONTENTS
1 Introduction
- 1.1 Study Assumptions and Market Definition
- 1.2 Scope of the Study
2 Research Methodology
3 Executive Summary
4 Market Landscape
- 4.1 Market Overview
- 4.2 Market Drivers
- 4.2.1 Semiconductor-grade Nano-slurries Fuelled by New Asian Fabs
- 4.2.2 Lipid Nanoparticles Demand from North-America and Europe mRNA Vaccine Capacity
- 4.2.3 Gold and Silver Nano-inks in Flexible OLED Lines
- 4.2.4 Increasing Usage of Nanomaterials
- 4.2.5 GCC Desalination Build-out Driving Nano-porous Membranes
- 4.3 Market Restraints
- 4.3.1 Higher Costs of Technology
- 4.3.2 Raw Material Price Fluctuation
- 4.3.3 High-Capex Atomic-Layer-Deposition Reactors Limiting SME Scale-up
- 4.4 Value Chain Analysis
- 4.5 Porter's Five Forces
- 4.5.1 Bargaining Power of Suppliers
- 4.5.2 Bargaining Power of Buyers
- 4.5.3 Threat of New Entrants
- 4.5.4 Threat of Substitutes
- 4.5.5 Competitive Rivalry
5 Market Size and Growth Forecasts (Value)
- 5.1 By Product Type
- 5.1.1 Nanoparticles
- 5.1.1.1 Nanometals
- 5.1.1.1.1 Gold
- 5.1.1.1.2 Silver
- 5.1.1.1.3 Platinum
- 5.1.1.1.4 Titanium
- 5.1.1.1.5 Aluminium
- 5.1.1.2 Non-metal Oxides
- 5.1.1.2.1 Alumina
- 5.1.1.2.2 Iron Oxide
- 5.1.1.2.3 Titanium Oxide
- 5.1.1.2.4 Silica
- 5.1.1.2.5 Zinc Oxide
- 5.1.1.3 Complex Oxides
- 5.1.1.3.1 Calcium Phosphate
- 5.1.1.3.2 Rare-earth Metal Oxides
- 5.1.1.3.3 Lithium Titanate
- 5.1.1.3.4 Silica Hydride
- 5.1.2 Nanofibers
- 5.1.3 Nanotubes
- 5.1.4 Nanoclays
- 5.1.5 Nanowires
- 5.1.1 Nanoparticles
- 5.2 By Structure Type
- 5.2.1 Non-polymer Organic Nanomaterials
- 5.2.1.1 Carbon Black
- 5.2.1.2 Carbon Nanotubes
- 5.2.1.3 Aptamers
- 5.2.1.4 Small-Molecule OLED
- 5.2.1.5 Activated Carbon
- 5.2.1.6 Carbon Nanotubes Composites
- 5.2.2 Polymeric Nanomaterials
- 5.2.2.1 Coatings and Adhesives
- 5.2.2.2 Transfection Reagents
- 5.2.2.3 Diagnostic Reagents
- 5.2.2.4 Drug-Delivery Vehicles
- 5.2.2.5 Fabric Treatments
- 5.2.2.6 Optical Coatings
- 5.2.2.7 Nano-porous Filtration Membranes
- 5.2.2.8 Dielectric Films
- 5.2.2.9 OLED Films
- 5.2.1 Non-polymer Organic Nanomaterials
- 5.3 By Material Category
- 5.3.1 Carbon-based
- 5.3.2 Metal-based
- 5.3.3 Metal-oxide and Ceramic-based
- 5.3.4 Polymeric and Lipid-based
- 5.4 End-user Industry
- 5.4.1 Construction
- 5.4.2 Electronics
- 5.4.3 Energy
- 5.4.4 Healthcare
- 5.4.5 Personal Care
- 5.4.6 Rubber
- 5.4.7 Other End-user Industries
- 5.5 Geography
- 5.5.1 Asia-Pacific
- 5.5.1.1 China
- 5.5.1.2 India
- 5.5.1.3 Japan
- 5.5.1.4 South Korea
- 5.5.1.5 ASEAN
- 5.5.1.6 Rest of Asia-Pacific
- 5.5.2 North America
- 5.5.2.1 United States
- 5.5.2.2 Canada
- 5.5.2.3 Mexico
- 5.5.3 Europe
- 5.5.3.1 Germany
- 5.5.3.2 United Kingdom
- 5.5.3.3 Italy
- 5.5.3.4 France
- 5.5.3.5 Rest of Europe
- 5.5.4 South America
- 5.5.4.1 Brazil
- 5.5.4.2 Argentina
- 5.5.4.3 Rest of South America
- 5.5.5 Middle East and Africa
- 5.5.5.1 Saudi Arabia
- 5.5.5.2 South Africa
- 5.5.5.3 Rest of Middle East and Africa
- 5.5.1 Asia-Pacific
6 Competitive Landscape
- 6.1 Market Concentration
- 6.2 Strategic Moves
- 6.3 Market Share Analysis
- 6.4 Company Profiles (includes Global level Overview, Market level overview, Core Segments, Financials, Strategic Information, Market Rank/Share, Products and Services, Recent Developments)
- 6.4.1 ACS Material
- 6.4.2 American Elements
- 6.4.3 Arkema
- 6.4.4 Ascensus
- 6.4.5 BASF SE
- 6.4.6 Cabot Corporation
- 6.4.7 Chasm Advanced Materials, Inc.
- 6.4.8 Evonik Industries AG
- 6.4.9 Jiangsu Cnano Technology Co., Ltd
- 6.4.10 LG Chem
- 6.4.11 Merck KGaA
- 6.4.12 Nano-C
- 6.4.13 Nanocyl SA
- 6.4.14 NAWAH
- 6.4.15 OCSiAl
- 6.4.16 QuantumSphere, Inc.
- 6.4.17 Raymor Industries Inc.
- 6.4.18 Resonac Holdings Corporation
- 6.4.19 Solesence
- 6.4.20 US Research Nanomaterials, Inc.
- 6.4.21 Zyvex Technologies
7 Market Opportunities and Future Outlook
- 7.1 White-space and Unmet-need Assessment
 奈米材料市場:按類型、合成技術、形狀、應用和最終用途產業分類-全球市場預測(2026-2032 年)奈米多孔材料市場:按材料類型、孔徑、製造方法、形狀、應用和最終用途產業分類-2026-2032年全球市場預測奈米薄膜市場:按類型、材料、厚度、形成技術和應用分類-2026-2032年全球市場預測奈米銀市場:2026-2032年全球市場預測(依產品類型、合成方法、應用及通路分類)
 2026年全球智慧奈米建築材料市場報告
 二氧化鈦奈米材料市場:商業機會、成長要素、產業趨勢分析及2026-2035年預測。
 奈米材料的全球市場(2025年)- 終端用戶,用途,競爭企業:2024年~2030年的分析與預測
 二氧化鈦奈米材料市場報告:按類型、應用和地區分類(2026-2034年)
 奈米薄膜市場規模、佔有率和成長分析:按材料、應用和地區分類-2026-2033年產業預測2034 年前智慧奈米材料的全球市場機會與策略