


 |
市場調查報告書
商品編碼
1852138
圓二色光譜:市場佔有率分析、產業趨勢、統計數據和成長預測(2025-2030 年)Circular Dichroism Spectrometers - Market Share Analysis, Industry Trends & Statistics, Growth Forecasts (2025 - 2030) |
||||||
※ 本網頁內容可能與最新版本有所差異。詳細情況請與我們聯繫。
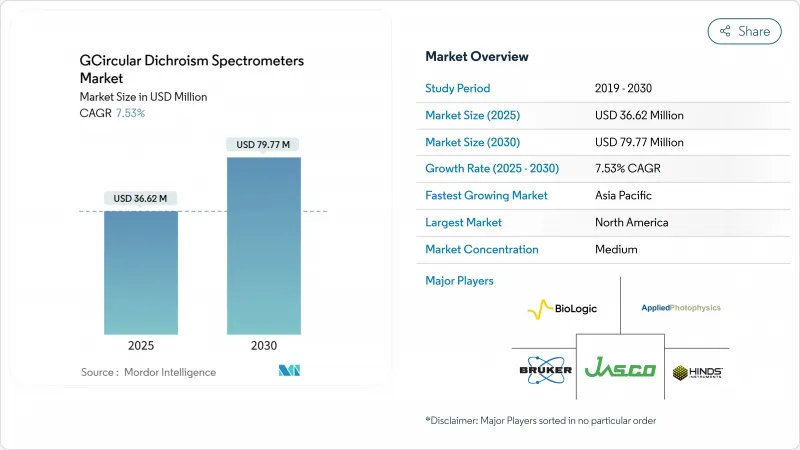
預計到 2025 年,圓二色光譜儀市場規模將達到 3,662 萬美元,到 2030 年將達到 7,977 萬美元,年複合成長率為 7.53%。
事實上,生物製藥生產的規模化、生物相似藥研發管線的不斷拓展以及FDA和EMA對高階蛋白質結構檢驗要求的提高,都推動了該領域的發展。此外,資金雄厚的學術核心設施也為市場需求提供了支撐,這些設施得到了NIH和NSF的資助。供應方面的進步,特別是台式自動化和量子級聯雷射色譜技術,正在降低單次樣品的成本並提高易用性。同時,中型委外研發機構(CRO)擴大採購多用戶系統,並將資本支出轉化為按服務收費的收入,從而推動了圓二色譜儀市場的新成長。以製程分析技術為中心的技術融合,透過將儀器直接整合到連續生技藥品生產線中,進一步降低了供應商受常規研究預算波動的影響。
全球圓二色光譜儀市場趨勢及洞察
全球生物製藥生產擴張
生技藥品向連續生產轉型,將圓二色譜(CD)探頭直接整合到生產線中,用於即時折疊式檢驗,從而提高了生產效率,並推動了落地架系統的普及。布魯克公司2024年營收飆升至33.7億美元,凸顯了此類資本投資計劃相關設備的廣泛應用。供應商目前正將自動比色皿更換器與符合GMP規範的軟體捆綁銷售,以減少操作員干預時間,並符合美國聯邦法規21 CFR Part 11的要求。更高的批次放行量也促使簽訂多年服務契約,從而獲得穩定的收入。這些因素共同為圓二層析儀市場創造了強勁的合規性基礎。
生命科學設備研發成本不斷上漲
美國國立衛生研究院 (NIH) 2025 財政年度 501 億美元的預算申請將與實驗室升級改造的津貼需求保持同步,而美國國家科學基金會 (NSF) 4000 萬美元的蛋白質設計舉措將支持對先進結構檢驗套件的需求。學術聯盟正在增強其採購能力,並選擇配備人工智慧驅動頻譜解卷積功能的桌上型儀器來分析各種蛋白質庫。在採購週期中,多檢測器組件的需求日益成長,這有利於能夠提供承包系統的製造商。這種經濟實力正在穩定儀器的更新週期,並支撐著圓二色光譜儀市場的發展。
CD系統的高昂資本和營運成本
高階系統加上GMP軟體和服務合約後,價格可能超過25萬美元,這會對首次購買者的資金預算造成壓力。供應鏈關稅可能會使美國光學組件進口商的到岸成本增加10-15%。營運成本,包括液態氮物流、燈泡更換和專用校準器,都會增加總擁有成本。共享設施模式可以減輕部分負擔,但也會導致預約瓶頸,阻礙時間要求較高的實驗。這些因素抑制了價格敏感地區圓二色光譜儀市場快速成長的樂觀預期。
細分市場分析
到2024年,桌上型圓二色光譜儀將佔據市場主導地位,市佔率高達45.34%,滿足學術實驗室和中型生物技術公司常規蛋白質折疊篩檢的需求。實驗室傾向於選擇佔地面積小、掃描速度快且可選配自動盤式分析儀。落地式儀器雖然出貨量較小,但由於其需要連續生產線運行,因此預計成長速度最快,因為這些儀器需要全天候可靠性和高信噪比。美國國家光源(NLS)安裝的專用同步輻射圓二色光譜(SRCD)光束線可滿足需要長波長的特殊膜蛋白研究計劃。哈佛醫學院安裝的兩台J-1500儀器表明,桌上型儀器仍然是高通量穩定性研究的核心。雖然桌上型儀器將繼續主導更新換代週期,但落地架平台將吸引待開發區項目,從而在圓二色光譜儀市場中保持綜合收益的平衡。
同時,產品升級正在模糊不同產品類別之間的界線。供應商正在將曾經僅用於大型系統的機器人自動自動取樣器改裝到桌上型設備上,使小型實驗室能夠在夜間處理96孔盤孔板。另一方面,落地架機型採用了模組化光學系統,使用者無需返廠即可在紫外線、可見光和中紅外線探頭之間進行切換。這種功能上的趨同性支持了圍繞通量和穩定性的差異化價值提案,同時也縮小了以往的價格差異。最終,不斷發展的實驗室工作流程將確保這兩類產品的擴張,從而增強整個圓二色光譜儀市場的廣泛發展前景。
到2024年,電子圓二色譜(CD)仍將佔據圓二色譜儀市場55.32%的佔有率。這主要歸功於其在遠紫外線區提供蛋白質科學家極為重視的α螺旋和BETA折疊的指紋圖譜。此分析方法擁有成熟的驗證指南,便於監管申報,並已成為批次放行檢測的預設方法。同步輻射圓二色譜的複合年成長率(CAGR)最高,因為國家級設施雖然受限於光束線的使用,但縮短了工業的等待時間,並提供了傳統光學系統無法企及的170 nm波長。振動圓二色譜(VCD)正逐步應用於掌性小分子的品質保證/品質控制(QA/QC)領域,目前的用戶主要是願意為量子級聯雷射付費的藥物立體化學研究團隊。 JASCO公司的中紅外線量子連鎖桌上型系統表明,VCD能夠將採集時間從數小時縮短至數分鐘,從而從小眾應用走向常規工作流程。
這些技術之間的交叉融合日益增加。如今,軟體程式套件能夠實現電子區和振動區的頻譜疊加,從而提供蛋白質骨架和側鏈手性的全景視圖。可攜式SRCD附加元件也在評估之中,但光束時間的可用性是一個關鍵因素。 SRCD和VCD具有較高的利潤空間,維持了圓二色光譜儀市場的分級定價結構。
區域分析
2024年,北美將維持38.54%的圓二色光譜儀市場佔有率,這得益於成熟的生技藥品管線、FDA對嚴格分析的要求以及資金雄厚的學術生態系統。美國國立衛生研究院(NIH)2025年501億美元的預算確保了共用設施的設備更新速度穩定。關鍵光學組件可能徵收10-15%的關稅,短期內可能會推高價格,但保固折扣和租賃模式將緩解此影響。加拿大疫苗生產的加速推進了本地採購,尤其是針對符合GMP標準的落地式圓二色光譜儀生產線。
亞太地區是成長最快的區域,預計到2030年將以8.53%的複合年成長率成長,這主要得益於中國現代化的生技藥品叢集、印度積極的生物相似藥目標以及日本對再生醫學品質工具的投資。中國圓二色譜儀供應商專注於成本最佳化型儀器,而全球企業則在跨國合資企業中贏得大批量訂單,這些訂單需要符合FDA標準的驗證方案。印度的國有生物園區提供批量設備融資,以滿足新興企業的需求。這種區域成長動能將減少對二手二手設備的傳統依賴,並加速高階產品在整個圓二色譜儀市場的滲透。
歐洲市場整體平衡,但成長速度放緩,主要得益於大型製藥公司的維修和「地平線歐洲」計畫的研究招募工作。德國和瑞士繼續投資高精度圓二色譜(CD)技術,用於膜蛋白藥物的研究,但英國脫歐後的海關政策變化導致設備交付週期延長。東歐的合約研究組織(CRO)正崛起為價格具有競爭力的服務中心,它們購買中階CD設備以吸引英國贊助商。拉丁美洲和中東地區取得了雖小但顯著的成果,當地的疫苗計畫推動了試點實驗室的建設。然而,光譜學人才的匱乏和資金籌措週期的不穩定性限制了這些地區近期的成長潛力。
其他福利:
- Excel格式的市場預測(ME)表
- 3個月的分析師支持
目錄
第1章 引言
- 研究假設和市場定義
- 調查範圍
第2章調查方法
第3章執行摘要
第4章 市場情勢
- 市場概覽
- 市場促進因素
- 全球生物製藥生產擴張
- 生命科學設備研發成本不斷上漲
- 圓二色性硬體的創新
- 藥物研發中對蛋白質結構分析的需求日益成長
- 增加結構生物學研究的學術經費
- 用於製程分析技術的整合光譜平台的出現。
- 市場限制
- CD系統的高昂資本和營運成本
- 訓練有素的光譜學專家數量有限
- 人們對高解析度替代方案的偏好日益成長
- 新型CD技術面臨的監管驗證挑戰
- 監管情況(FDA、EMA、ICH Q5E、USP<781>)
- 技術展望
- 波特五力分析
- 新進入者的威脅
- 買方的議價能力
- 供應商的議價能力
- 替代品的威脅
- 競爭對手之間的競爭
第5章 市場規模與成長預測
- 依產品類型
- 桌上型圓二色光譜儀
- 落地式圓二色光譜儀
- SRCD光束線設備
- CD微分散儀
- 透過技術
- 電子光碟(ECD)
- 振動光碟(VCD)
- 同步輻射CD(SRCD)
- 透過使用
- 蛋白質二級結構測定
- 疫苗學與抗原構象研究
- 生物相似藥與生物製藥的比較評價
- 品管/批次放行測試
- 藥物篩檢和先導檢驗
- 最終用戶
- 製藥和生物技術公司
- 受託製造廠商(CRO/CMO)
- 學術和政府研究機構
- 醫院和診斷實驗室
- 地理
- 北美洲
- 美國
- 加拿大
- 墨西哥
- 歐洲
- 德國
- 英國
- 法國
- 義大利
- 西班牙
- 其他歐洲地區
- 亞太地區
- 中國
- 日本
- 印度
- 澳洲
- 韓國
- 亞太其他地區
- 中東和非洲
- GCC
- 南非
- 其他中東和非洲地區
- 南美洲
- 巴西
- 阿根廷
- 其他南美洲國家
- 北美洲
第6章 競爭情勢
- 市場集中度
- 市佔率分析
- 公司簡介
- JASCO
- Bruker
- Applied Photophysics
- Bio-Logic Science Instruments
- Hinds Instruments
- Thermo Fisher Scientific
- Agilent Technologies
- Shimadzu
- CRAIC Technologies
- Aviv Biomedical
- ISS Inc.
- Ocean Insight
- Quantum Design International
- HORIBA Scientific
- SpectroPolaritek
第7章 市場機會與未來展望
The circular dichroism spectrometers market size sits at USD 36.62 million in 2025 and is forecast to expand to USD 79.77 million by 2030, reflecting a steady 7.53% CAGR.
In practice, the sector's momentum is anchored in biopharmaceutical manufacturing scale-up, rising biosimilar pipelines, and tighter FDA-EMA expectations for higher-order protein structure validation. Demand is additionally supported by NIH and NSF funding streams that keep academic core facilities well capitalized. Supply-side advances-most notably benchtop automation and quantum-cascade-laser vibrational CD-lower per-sample costs and broaden usability. Meanwhile, mid-sized contract research organizations (CROs) increasingly purchase multi-user systems and convert capital outlays into fee-for-service revenues, injecting new volume into the Circular Dichroism Spectrometers market. Technology convergence around process analytical technology further insulates vendors from routine research budget swings, embedding instruments directly into continuous biologics production lines.
Global Circular Dichroism Spectrometers Market Trends and Insights
Expansion of Global Biopharmaceutical Manufacturing
Biologic plants shifting toward continuous production embed CD probes directly into process lines for real-time folding validation, driving higher-throughput specifications and favoring floor-standing systems. Bruker's 2024 revenue spike of USD 3.37 billion underscores the instrumentation pull-through tied to these capital projects. Vendors now bundle automated cuvette changers and GMP-ready software, shortening operator intervention time and aligning with 21 CFR Part 11 expectations. Larger batch-release volumes encourage multi-year service contracts that lock in annuity revenue. Together, these factors add a sturdy compliance floor beneath the Circular Dichroism Spectrometers market.
Rising R&D Expenditure in Life Sciences Instrumentation
NIH's FY 2025 request of USD 50.1 billion keeps grant-backed lab upgrades on pace, while the NSF's USD 40 million protein-design initiative anchors demand for advanced structure-validation kits. Academic consortia consolidate purchasing power, opting for benchtop instruments equipped with AI-driven spectral deconvolution that handles diverse protein libraries. Procurement cycles increasingly specify multi-detector packages, rewarding manufacturers able to ship turn-key systems. These funding dynamics promote steady instrument refresh intervals, buttressing the Circular Dichroism Spectrometers market.
High Capital and Operational Costs of CD Systems
Premium systems can exceed USD 250,000 once GMP software and service agreements are added, straining capital budgets for first-time buyers. Supply-chain tariffs risk adding 10-15% to landed costs for U.S. importers of optics sub-assemblies. Operational expenses include liquid-nitrogen logistics, lamp replacements, and specialized calibrants, lifting total cost of ownership. Shared-facility models relieve part of that burden but produce reservation bottlenecks that deter time-sensitive experiments. These factors collectively temper high-growth optimism for the Circular Dichroism Spectrometers market in price-sensitive regions.
Other drivers and restraints analyzed in the detailed report include:
- Technological Innovations in Circular Dichroism Hardware
- Growing Demand for Protein Structure Analysis in Drug Discovery
- Limited Availability of Trained Spectroscopy Professionals
For complete list of drivers and restraints, kindly check the Table Of Contents.
Segment Analysis
Benchtop units delivered a commanding 45.34% share of Circular Dichroism Spectrometers market size in 2024 by meeting everyday protein-fold screening needs of academic labs and mid-tier biotechs. Laboratories choose them for compact footprints, rapid scan modes, and optional automated plate readers. Floor-standing models, although fewer in absolute shipments, record the fastest unit growth because continuous-manufacturing lines require 24/7 reliability and higher s/n ratios. Specialty SRCD beamline configurations, housed at national light-sources, serve niche membrane-protein projects where extended wavelengths matter. The Harvard Medical School installation of dual J-1500s illustrates how benchtops remain central to high-throughput stability studies. Over the forecast, benchtops will continue to dominate replacement cycles, while floor-standing platforms capture green-field plants, keeping a balanced revenue mix inside the Circular Dichroism Spectrometers market.
In parallel, product upgrades blur lines between categories. Vendors now retrofit benchtops with robotic autosamplers once exclusive to large systems, letting smaller labs process 96-well plates overnight. Conversely, floor-standing models incorporate modular optics so users swap in UV, visible, or mid-IR heads without factory service visits. This feature parity compresses the historical price spread yet supports differentiated value propositions around throughput and robustness. Ultimately, evolving lab workflows ensure both product classes expand, reinforcing the broad opportunity base across the Circular Dichroism Spectrometers market.
Electronic CD still held 55.32% of Circular Dichroism Spectrometers market share in 2024 because its far-UV range delivers the alpha-helix and beta-sheet fingerprints prized by protein scientists. The method's mature validation guides ease regulatory submissions, making it the default for batch-release assays. Synchrotron Radiation CD, while confined to beamline access, posts the briskest CAGR as national facilities open industrial queue time and deliver wavelengths down to 170 nm unattainable on conventional optics. Vibrational CD elbows into chiral-small-molecule QA/QC, though current users remain pharma stereochemistry groups ready to pay for quantum-cascade-laser sources. JASCO's mid-IR quantum-cascade bench system demonstrates that VCD can migrate from niche to daily workflow by shortening acquisition times from hours to minutes.
Cross-pollination among these technologies is growing. Software packages increasingly allow spectral overlay across electronic and vibrational regimes, providing a single-view protein backbone plus side-chain chirality. Portable SRCD add-ons are under evaluation, but beamtime availability stays the gating factor. Over the outlook, Electronic CD will remain the workhorse while SRCD and VCD supply premium margins, preserving a tiered pricing architecture across the Circular Dichroism Spectrometers market.
The Circular Dichroism Spectrometers Market Report is Segmented by Product Type (Benchtop CD Spectrometers, and More), Technology (Electronic CD (ECD), and More), Application (Protein Secondary-Structure Determination, and More), End User (Pharmaceutical & Biotechnology Companies, and More), Geography (North America, Europe, Asia-Pacific, and More). The Market Forecasts are Provided in Terms of Value (USD).
Geography Analysis
North America retained 38.54% of Circular Dichroism Spectrometers market share in 2024, buoyed by mature biologics pipelines, FDA's rigorous analytical expectations, and a well-funded academic ecosystem. The NIH's 2025 appropriation of USD 50.1 billion guarantees consistent instrument refresh rates at shared facilities. A possible 10-15% tariff on critical optics assemblies could lift short-term prices, but warranty discounts and lease models cushion the blow. Canada's vaccine-manufacturing build-out amplifies regional procurement, particularly for floor-standing CD lines designed for GMP production floors.
Asia-Pacific is the fastest-expanding arena at an 8.53% CAGR through 2030, propelled by China's modern biologic clusters, India's aggressive biosimilar targets, and Japan's investment in regenerative medicine quality tools. Chinese CD vendors focus on cost-optimized benches, but global players win large-capacity orders at multinational joint-ventures needing FDA-ready validation packages. India's state-sponsored biotech parks bundle equipment financing, unlocking demand among start-ups. This regional momentum reduces historical dependency on imported second-hand gear and accelerates premium segment penetration across the Circular Dichroism Spectrometers market.
Europe exhibits balanced but slower growth, stabilizing around large pharma refurbishments and Horizon Europe research calls. Germany and Switzerland continue to invest in high-precision CD for membrane-protein drug work, while the UK's post-Brexit customs shifts require longer planning windows for instrument delivery. Eastern European CROs emerge as price-competitive service hubs, purchasing mid-tier CD units to attract western sponsors. Smaller but notable gains surface in Latin America and the Middle East, where local vaccine initiatives spur pilot lab construction. However, limited spectroscopy talent and sporadic funding cycle volatility temper near-term upside in those regions.
- Jasco
- Bruker
- Applied Photophysics
- Bio-Logic Science Instruments
- Hinds Instruments
- Thermo Fisher Scientific
- Agilent Technologies
- Shimadzu
- CRAIC Technologies
- Aviv Biomedical
- ISS
- Ocean Insight
- Quantum Design International
- HORIBA Scientific
- SpectroPolaritek
Additional Benefits:
- The market estimate (ME) sheet in Excel format
- 3 months of analyst support
TABLE OF CONTENTS
1 Introduction
- 1.1 Study Assumptions & Market Definition
- 1.2 Scope Of The Study
2 Research Methodology
3 Executive Summary
4 Market Landscape
- 4.1 Market Overview
- 4.2 Market Drivers
- 4.2.1 Expansion of Global Biopharmaceutical Manufacturing
- 4.2.2 Rising R&D Expenditure in Life Sciences Instrumentation
- 4.2.3 Technological Innovations in Circular Dichroism Hardware
- 4.2.4 Growing Demand for Protein Structure Analysis in Drug Discovery
- 4.2.5 Increasing Academic Funding for Structural Biology Research
- 4.2.6 Emergence of Integrated Spectroscopy Platforms For Process Analytical Technology
- 4.3 Market Restraints
- 4.3.1 High Capital and Operational Costs of CD Systems
- 4.3.2 Limited Availability of Trained Spectroscopy Professionals
- 4.3.3 Growing Preference for High-Resolution Alternative Methods
- 4.3.4 Regulatory Validation Challenges for New CD Technologies
- 4.4 Regulatory Landscape (FDA, EMA, ICH Q5E, USP <781>)
- 4.5 Technological Outlook
- 4.6 Porter's Five Forces Analysis
- 4.6.1 Threat Of New Entrants
- 4.6.2 Bargaining Power Of Buyers
- 4.6.3 Bargaining Power Of Suppliers
- 4.6.4 Threat Of Substitutes
- 4.6.5 Intensity Of Competitive Rivalry
5 Market Size & Growth Forecasts (Value, USD)
- 5.1 By Product Type
- 5.1.1 Benchtop CD Spectrometers
- 5.1.2 Floor-Standing CD Spectrometers
- 5.1.3 SRCD Beamline Instruments
- 5.1.4 CD Microspectrometers
- 5.2 By Technology
- 5.2.1 Electronic CD (ECD)
- 5.2.2 Vibrational CD (VCD)
- 5.2.3 Synchrotron Radiation CD (SRCD)
- 5.3 By Application
- 5.3.1 Protein Secondary-Structure Determination
- 5.3.2 Vaccinology & Antigen Conformation Studies
- 5.3.3 Biosimilar & Biologic Comparability Assessments
- 5.3.4 Quality Control / Batch Release Testing
- 5.3.5 Drug Discovery Screening & Hit Validation
- 5.4 By End-User
- 5.4.1 Pharmaceutical & Biotechnology Companies
- 5.4.2 Contract Research / Manufacturing Organizations (CROs/CMOs)
- 5.4.3 Academic & Government Research Institutes
- 5.4.4 Hospital & Diagnostic Laboratories
- 5.5 Geography
- 5.5.1 North America
- 5.5.1.1 United States
- 5.5.1.2 Canada
- 5.5.1.3 Mexico
- 5.5.2 Europe
- 5.5.2.1 Germany
- 5.5.2.2 United Kingdom
- 5.5.2.3 France
- 5.5.2.4 Italy
- 5.5.2.5 Spain
- 5.5.2.6 Rest of Europe
- 5.5.3 Asia-Pacific
- 5.5.3.1 China
- 5.5.3.2 Japan
- 5.5.3.3 India
- 5.5.3.4 Australia
- 5.5.3.5 South Korea
- 5.5.3.6 Rest of Asia-Pacific
- 5.5.4 Middle East & Africa
- 5.5.4.1 GCC
- 5.5.4.2 South Africa
- 5.5.4.3 Rest of Middle East & Africa
- 5.5.5 South America
- 5.5.5.1 Brazil
- 5.5.5.2 Argentina
- 5.5.5.3 Rest of South America
- 5.5.1 North America
6 Competitive Landscape
- 6.1 Market Concentration
- 6.2 Market Share Analysis
- 6.3 Company Profiles (includes Global level Overview, Market level overview, Core Business Segments, Financials, Headcount, Key Information, Market Rank, Market Share, Products and Services, and analysis of Recent Developments)
- 6.3.1 JASCO
- 6.3.2 Bruker
- 6.3.3 Applied Photophysics
- 6.3.4 Bio-Logic Science Instruments
- 6.3.5 Hinds Instruments
- 6.3.6 Thermo Fisher Scientific
- 6.3.7 Agilent Technologies
- 6.3.8 Shimadzu
- 6.3.9 CRAIC Technologies
- 6.3.10 Aviv Biomedical
- 6.3.11 ISS Inc.
- 6.3.12 Ocean Insight
- 6.3.13 Quantum Design International
- 6.3.14 HORIBA Scientific
- 6.3.15 SpectroPolaritek
7 Market Opportunities & Future Outlook
- 7.1 White-Space & Unmet-Need Assessment
 圓二色光譜儀市場:依產品、技術、配置和應用分類-2026-2032年全球市場預測氣溶膠傳輸光譜儀市場:依產品、技術、應用、最終用戶和分銷管道分類,全球預測,2026-2032年
 X光固體檢測器市場規模、佔有率和成長分析:按檢測器類型、技術、檢測器尺寸、應用領域、最終用戶和地區分類——2026-2033年行業預測
 ICP-OES光譜儀全球市場報告(2026年)
 全球圓二色性(CD)光譜儀市場規模、佔有率、趨勢和成長分析報告(2026-2034年)光譜測角儀市場按類型、便攜性、波長範圍、應用和最終用戶分類 - 全球預測 2026-2032