


 |
市場調查報告書
商品編碼
1851873
乙醯丙酸:市場佔有率分析、產業趨勢、統計、成長預測(2025-2030)Levulinic Acid - Market Share Analysis, Industry Trends & Statistics, Growth Forecasts (2025 - 2030) |
||||||
※ 本網頁內容可能與最新版本有所差異。詳細情況請與我們聯繫。
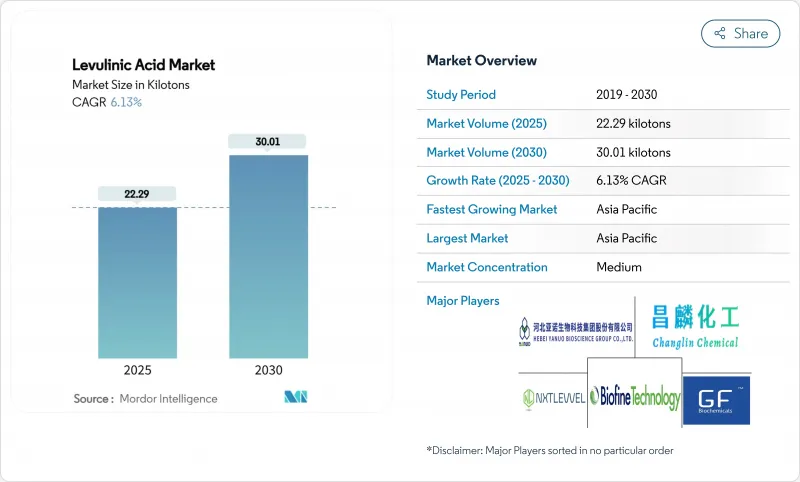
預計到 2025 年,乙醯丙酸市場規模將達到 22.29 千噸,到 2030 年將達到 30.01 千噸,在預測期(2025-2030 年)內複合年成長率為 6.13%。
隨著歐盟「化學品永續性策略」和美國「聯邦永續化學品計畫」等監管計畫敦促製造商採用有助於價值鏈脫碳的生物基中間體,市場對乙醯丙酸的需求正在成長。化妝品和個人護理用品仍然是乙醯丙酸最大的銷售領域,因為它是一種天然來源的防腐劑,符合潔淨標示的偏好。燃料和燃料添加劑製造商的採購量成長最快,因為該化合物支持永續航空燃料的γ-戊內酯合成途徑。雖然酸水解技術仍然佔據大部分產能,但酵素法和微生物法正在吸引新的投資,以降低單位成本並緩解催化劑惰性問題。亞太地區憑藉豐富的生質能資源、扶持政策和密集的化學品製造基地,在產量和成長率方面均保持領先地位,而義大利和北美的新計畫則預示著乙醯丙酸市場產能的逐步擴張。
全球乙醯丙酸市場趨勢及洞察
對生物基溶劑和塑化劑的需求日益成長
監管機構要求以其他塑化劑取代鄰苯二甲酸酯類塑化劑的壓力,正推動乙醯丙酸酯類塑化劑在聚合物薄膜和硬質包裝領域的應用。近期測試表明,以20%(重量百分比)的乙醯丙酸酯類塑化劑取代傳統的檸檬酸酯類塑化劑,可將聚乳酸的斷裂伸長率提高至546%,在生物基含量更高的情況下,性能與傳統塑化劑相當。歐盟化學品策略優先考慮在關鍵用途中使用生物基塑化劑,並鼓勵品牌商指定使用乙醯丙酸衍生物。成熟的催化劑供應商已將酯化反應的能源需求降低了近20%,從而縮小了與石油基替代品的價格差距。消費品製造商的目標是到2030年實現至少25%的生物基原料使用率,並已簽訂遠期採購承諾,以支持乙醯丙酸市場的新產能合約。
擴大乙醯丙酸衍生物作為低碳燃料添加劑的應用
將乙醯丙酸轉化為γ-戊內酯,可為永續航空燃料(SAF)提供中間體,使綜合生物煉製廠能夠實現每加侖汽油當量3.15美元左右的損益平衡生產成本。 2024年開發的催化劑實現了2-甲基四氫呋喃87.6%的產率,可提高辛烷值並降低生命週期碳排放強度。 2023年,全球生質燃料消費量成長至1.07億噸,投資額超過130億美元。同時,航空業相關人員已承諾在2070年實現SAF 35%的滲透率,促使各方簽訂了乙醯丙酸衍生物的長期承購協議。目前,實驗性酵素法路線已證明,在相同生質能投入下,前體產量可提高10倍,顯示成本還有進一步降低的潛力。
高昂的生產成本和石油替代品
由於生質能產量有限且下游精煉環節資本密集,乙醯丙酸的價格仍高於現有的石化中間體。美國化工產業復甦乏力,預計2024年產量僅成長1.5%,限制了買家支付生物溢價的能力。在聚合物和溶劑領域,乙醯丙酸市場與大型裂解裝置生產的原料競爭,而這些裝置的資產折舊早已完成,進一步擴大了成本差距。酸水解裝置的催化劑結垢增加了維護成本和停機時間,侵蝕了利潤。因此,一些大宗用戶正在推遲設備更換計劃,直到第二代製程能夠降低變動成本。
細分市場分析
酸水解法憑藉數十年的商業性經驗和Biofine製程(理論收率達70-80%),在2024年仍維持著54.65%的乙醯丙酸市佔率。目前大多數工廠使用稀硫酸將纖維素轉化為中間糖,進而生產乙醯丙酸。然而,催化劑衰減和腐植質廢棄物是持續的成本,會侵蝕淨利率,尤其是在原料水分含量波動的情況下。新興的酵素法和微生物法每單位生質能的前體收率可提高10倍,並降低公用設施需求,進而達到6.81%的複合年成長率。一家荷蘭-加拿大新興企業在2025年獲得了B輪融資,用於擴大與紙漿廠副線連接的示範裝置的規模。
酸水解企業正投資建造帶有在線分離裝置的連續流反應器,以縮短停留時間並減少腐殖質的積累;與此同時,相鄰的催化加氫裝置正在將內部生產的乙醯丙酸升級為γ-戊內酯和2-甲基四氫呋喃,以期作為直接替代燃料添加劑獲取利潤。儘管酶法路線仍面臨酶成本和穩定性方面的挑戰,但平台供應商報告稱,在蛋白質工程取得突破後,酶用量已實現兩位數的降低。這種技術組合反映了一個過渡時期:成熟製程確保了當前的產量,而生物技術創新則為乙醯丙酸市場指明了下一個生產力飛躍的方向。
乙醯丙酸市場報告按生產技術(酸水解、生物精工藝及其他)、等級(工業級、醫藥級、食品級)、終端用戶行業(化妝品及個人護理、製藥及其他)和地區(亞太、北美、歐洲、南美、中東和非洲)進行細分。市場預測以噸為單位。
區域分析
亞太地區在2024年佔據了全球41.29%的市場佔有率,預計到2030年將以6.58%的複合年成長率成長,這主要得益於中國生質能盈餘和碳中和目標的推動。省級政府補貼可涵蓋生化計劃高達30%的資本支出,刺激了山東和廣西等地新建工廠。日本的生產計畫將帶動乙醯丙酸的聯產,而印度(主要在古吉拉突邦)特種化學品產能的擴張則為下游產業注入了新的動力。區域供應限制將使價格保持堅挺,促使當地投資者縮短進口路線。
北美擁有成熟且充滿機會的基礎,聯邦稅額扣抵和貸款擔保正在推動生物煉製廠的維修。加拿大的無污染燃料標準鼓勵煉油商採用低碳原料,促進了源自乙醯丙酸的γ-戊內酯的採購。墨西哥韋拉克魯斯化工產業叢集正將目光投向玉米秸稈這種價格低廉的原料,但物流和農作物殘渣管理仍限制了其規模。隨著生產商提高製程效率並確保生質能的長期銷售,市場將呈現中等個位數的成長。
歐洲憑藉其嚴格的永續化學品法規,在永續化學品領域佔據了穩固的地位。目前,全球最大的單體乙醯丙酸裝置已在義大利運作,年產量達1萬噸,證明了工業可行性。歐盟的「Fit-for-55」計畫正在加速推動對運輸燃料和塑膠的需求,而「地平線歐洲」計畫的津貼將用於催化劑研究,旨在降低成本,超越亞洲。巴西的甘蔗渣和南非的森林殘餘物提供了豐富的原料,但投資決策取決於政治穩定性以及開發利用這些地下資源生產乙醯丙酸的基礎設施。
其他福利:
- Excel格式的市場預測(ME)表
- 3個月的分析師支持
目錄
第1章 引言
- 研究假設和市場定義
- 調查範圍
第2章調查方法
第3章執行摘要
第4章 市場情勢
- 市場概覽
- 市場促進因素
- 對生物基溶劑和塑化劑的需求不斷成長
- 擴大衍生性商品的使用
- 作為一種天然防腐劑,在化妝品和個人護理產品中的應用日益廣泛。
- 擴大其作為傳統肥料替代品的應用
- 與紙漿和造紙廠建立循環經濟夥伴關係
- 市場限制
- 高昂的生產成本與石油替代品相比
- 商業規模生產能力有限
- 商業反應器中腐殖質累積導致催化劑失去活性。
- 價值鏈分析
- 波特五力模型
- 供應商的議價能力
- 買方的議價能力
- 新進入者的威脅
- 替代品的威脅
- 競爭程度
第5章 市場規模與成長預測
- 透過生產技術
- 酸水解
- 生物精工藝
- 催化氫化路線
- 新的生物技術途徑
- 按年級
- 工業級
- 醫藥級
- 食品級
- 按最終用戶行業分類
- 化妝品和個人護理
- 製藥
- 聚合物和塑化劑
- 燃料和燃料添加劑
- 香味
- 其他終端用戶產業(農業、化肥等)
- 按地區
- 亞太地區
- 中國
- 日本
- 印度
- 韓國
- 東南亞國協
- 亞太其他地區
- 北美洲
- 美國
- 加拿大
- 墨西哥
- 歐洲
- 德國
- 英國
- 法國
- 義大利
- 西班牙
- 俄羅斯
- 北歐國家
- 其他歐洲地區
- 南美洲
- 巴西
- 阿根廷
- 其他南美洲國家
- 中東和非洲
- 沙烏地阿拉伯
- 南非
- 其他中東和非洲地區
- 亞太地區
第6章 競爭情勢
- 市場集中度
- 策略趨勢
- 市佔率(%)/排名分析
- 公司簡介
- AK Scientific Inc.
- Avantium
- Biofine Technology, llc.
- GFBiochemicals
- GODAVARI BIOREFINERIES LTD.
- Hangzhou Aromalake Tech Co., Ltd.
- Hebei Yanuo Bioscience Group Co., Ltd
- LangFang Hawk Technology and Development Co,Ltd.
- Merck KGaA(Sigma-Aldrich)
- NXTLEVVEL Biochem
- Shandong Xinhua Pharma
- Thermo Fisher Scientific Inc.
- Tokyo Chemical Industry Co,. Ltd.
- Zibo Changlin Chemical Industry Co., Ltd.
第7章 市場機會與未來展望
The Levulinic Acid Market size is estimated at 22.29 kilotons in 2025, and is expected to reach 30.01 kilotons by 2030, at a CAGR of 6.13% during the forecast period (2025-2030).
Demand grows as regulatory programs such as the EU Chemicals Strategy for Sustainability and the US Federal Sustainable Chemistry Plan press manufacturers to adopt bio-based intermediates that help decarbonize value chains. Cosmetics and personal care remain the largest outlet because levulinic acid serves as a naturally sourced preservative that satisfies clean-label preferences. Fuel and fuel-additive manufacturers are scaling purchases fastest as the compound underpins gamma-valerolactone pathways for sustainable aviation fuel. Acid hydrolysis technology continues to dominate installed capacity, yet enzymatic and microbial routes are attracting new investment to cut unit costs and ease catalyst deactivation issues. Asia-Pacific keeps its lead on both volume and growth thanks to abundant biomass, supportive policy, and a dense chemical manufacturing base, while new projects in Italy and North America signal gradual capacity consolidation across the levulinic acid market.
Global Levulinic Acid Market Trends and Insights
Rising Demand for Bio-Based Solvents and Plasticizers
Regulatory pressure to replace phthalate plasticizers is propelling levulinic acid esters into polymer films and rigid packaging. Recent trials achieved 546% elongation at break in polylactic acid when 20 wt% levulinic acid ester replaced traditional citrate plasticizers, matching performance while raising bio-conetent. The EU Chemicals Strategy frames bio-based plasticizers as preferred under essential-use criteria, encouraging brand owners to specify levulinic acid derivatives. Established catalyst suppliers have lowered esterification energy demand by almost 20%, narrowing the price gap with petro-routes. Consumer packaged goods firms aim to lift bio-sourced inputs to at least 25% by 2030, creating forward purchasing commitments that anchor new capacity agreements across the levulinic acid market.
Growing Use of Levulinic Acid Derivatives as Low-Carbon Fuel Additives
Conversion of levulinic acid into gamma-valerolactone provides an intermediate for sustainable aviation fuel (SAF) that can reach breakeven production costs near USD 3.15 per gasoline-equivalent gallon in integrated biorefineries. Catalysts developed in 2024 delivered 87.6% yield of 2-methyltetrahydrofuran, a blending component that upgrades octane and lowers lifecycle carbon intensity. Global biofuel consumption rose to 107 Mtoe in 2023 and investments topped USD 13 billion, while aviation stakeholders pledge 35% SAF penetration by 2070, sharpening long-term offtake agreements for levulinic acid derivatives. Pilot enzymatic routes now claim a tenfold increase in precursor yield from identical biomass inputs, signalling further cost reduction potential.
High Production Cost versus Petro-Substitutes
Levulinic acid remains pricier than incumbent petrochemical intermediates because biomass yields are modest and downstream purification is capital intensive. Weak chemical sector recovery-US output grew only 1.5% in 2024-limits the capacity of buyers to pay bio-premiums. In polymers and solvents the levulinic acid market competes with raw materials produced at megascale crackers that long ago depreciated assets, widening the cost gap. Catalyst fouling in acid hydrolysis plants adds maintenance expense and downtime that erode margins. As a result, some bulk users defer substitution plans until second-generation processes deliver lower variable costs.
Other drivers and restraints analyzed in the detailed report include:
- Increasing Adoption in Cosmetics and Personal Care as Natural Preservative
- Increasing Usage as a Substitute in Traditional Fertilizers
- Limited Commercial-Scale Manufacturing Capacity
For complete list of drivers and restraints, kindly check the Table Of Contents.
Segment Analysis
Acid hydrolysis retained 54.65% share of the levulinic acid market in 2024 by leveraging decades of commercial experience and the Biofine process that attains 70-80% theoretical yield. Most current plants use dilute sulfuric acid to convert cellulose into intermediate sugars and then levulinic acid, a route viewed as low risk by investors. However, catalyst decay and humin disposal impose recurring costs that pressure margins, especially when feedstock moisture fluctuates. Emerging enzymatic and microbial methods post a 6.81% CAGR as developers showcase tenfold higher precursor yields per unit biomass and reduced utility demand. Start-ups in the Netherlands and Canada secured Series B funding in 2025 to scale demo units that bolt onto pulp-mill side streams, signaling confidence in biotechnological cost-down potential for the levulinic acid market.
Acid hydrolysis players are investing in continuous-flow reactors equipped with inline separation to cut residence time and limit humin buildup. Meanwhile, catalytic hydrogenation units next door upgrade in-house levulinic acid to gamma-valerolactone or 2-methyltetrahydrofuran, capturing margin in drop-in fuel additives. Enzymatic routes still face enzyme cost and stability hurdles, yet platform suppliers report double-digit reductions in enzyme loading after protein-engineering breakthroughs. The technology mix reflects a transition era where established processes secure present volumes while biotech innovation charts the next productivity leap for the levulinic acid market.
The Levulinic Acid Market Report is Segmented by Production Technology (Acid Hydrolysis, Biofine Process, and More), Grade (Industrial Grade, Pharma Grade, and Food Grade), End-User Industry (Cosmetics and Personal Care, Pharmaceuticals, and More), and Geography (Asia-Pacific, North America, Europe, South America, Middle East and Africa). The Market Forecasts are Provided in Terms of Volume (tons).
Geography Analysis
Asia-Pacific constitutes the demand epicenter at 41.29% volume share in 2024 and a projected 6.58% CAGR to 2030, supported by China's biomass surpluses and national carbon-neutrality targets. Provincial grants cover up to 30% of capital expenditure for bio-chemical projects, spurring new plants in Shandong and Guangxi. Japan's commercial woody-ethanol scheme underpins co-production of levulinic acid, while India's specialty-chemicals capacity expansion-notably in Gujarat-creates fresh downstream pull. Regional supply tightness keeps pricing firm, encouraging local investors to shorten import routes.
North America holds a mature yet opportunity-rich base where federal tax credits and loan guarantees spur biorefinery retrofits. Canada's Clean Fuel Standard compels refiners to adopt low-carbon feedstock, boosting contracts for gamma-valerolactone derived from levulinic acid. Mexican chemical clusters in Veracruz eye corn stover as an affordable feedstock, though logistics and agronomic residue management still limit scale. The market exhibits mid-single-digit growth as producers enhance process efficiency and secure long-term biomass offtake.
Europe preserves a strong foothold owing to rigorous sustainable-chemistry legislation. Italy hosts the world's largest single levulinic acid unit at 10,000 t/a, demonstrating industrial feasibility, while German and French firms pilot enzyme-enabled variants. The EU Fit-for-55 package accelerates demand in transport fuels and plastics, and Horizon Europe grants finance catalyst research that aims to outpace Asia on cost. South America and the Middle-East and Africa remain emerging pockets; Brazil's sugarcane bagasse and South Africa's forest residues present ample feedstock, yet investment decisions hinge on political stability and infrastructure to tap these reserves for the levulinic acid market.
- AK Scientific Inc.
- Avantium
- Biofine Technology, llc.
- GFBiochemicals
- GODAVARI BIOREFINERIES LTD.
- Hangzhou Aromalake Tech Co., Ltd.
- Hebei Yanuo Bioscience Group Co., Ltd
- LangFang Hawk Technology and Development Co,Ltd.
- Merck KGaA (Sigma-Aldrich)
- NXTLEVVEL Biochem
- Shandong Xinhua Pharma
- Thermo Fisher Scientific Inc.
- Tokyo Chemical Industry Co,. Ltd.
- Zibo Changlin Chemical Industry Co., Ltd.
Additional Benefits:
- The market estimate (ME) sheet in Excel format
- 3 months of analyst support
TABLE OF CONTENTS
1 Introduction
- 1.1 Study Assumptions and Market Definition
- 1.2 Scope of the Study
2 Research Methodology
3 Executive Summary
4 Market Landscape
- 4.1 Market Overview
- 4.2 Market Drivers
- 4.2.1 Rising Demand for Bio-Based Solvents and Plasticizers
- 4.2.2 Growing Use of Derivatives
- 4.2.3 Increasing Adoption in Cosmetics and Personal Care as Natural Preservative
- 4.2.4 Increasing Usage as a Substitute in Traditional Fertilizers
- 4.2.5 Circular-Economy Partnerships with Pulp and Paper Mills
- 4.3 Market Restraints
- 4.3.1 High Production Cost Vs Petro- Substitutes
- 4.3.2 Limited Commercial-Scale Manufacturing Capacity
- 4.3.3 Catalyst Deactivation from Humin Build-Up in Continuous Reactors
- 4.4 Value Chain Analysis
- 4.5 Porter's Five Forces
- 4.5.1 Bargaining Power of Suppliers
- 4.5.2 Bargaining Power of Buyers
- 4.5.3 Threat of New Entrants
- 4.5.4 Threat of Substitutes
- 4.5.5 Degree of Competition
5 Market Size and Growth Forecasts (Volume)
- 5.1 By Production Technology
- 5.1.1 Acid Hydrolysis
- 5.1.2 Biofine Process
- 5.1.3 Catalytic Hydrogenation Route
- 5.1.4 Emerging Biotechnological Routes
- 5.2 By Grade
- 5.2.1 Industrial Grade
- 5.2.2 Pharma Grade
- 5.2.3 Food Grade
- 5.3 By End-user Industry
- 5.3.1 Cosmetics and Personal Care
- 5.3.2 Pharmaceuticals
- 5.3.3 Polymers and Plasticizers
- 5.3.4 Fuel and Fuel Additives
- 5.3.5 Flavors and Fragrances
- 5.3.6 Other End-users Industries (Agriculture and Fertilizers, etc.)
- 5.4 By Geography
- 5.4.1 Asia-Pacific
- 5.4.1.1 China
- 5.4.1.2 Japan
- 5.4.1.3 India
- 5.4.1.4 South Korea
- 5.4.1.5 ASEAN Countries
- 5.4.1.6 Rest of Asia-Pacific
- 5.4.2 North America
- 5.4.2.1 United States
- 5.4.2.2 Canada
- 5.4.2.3 Mexico
- 5.4.3 Europe
- 5.4.3.1 Germany
- 5.4.3.2 United Kingdom
- 5.4.3.3 France
- 5.4.3.4 Italy
- 5.4.3.5 Spain
- 5.4.3.6 Russia
- 5.4.3.7 NORDIC Countries
- 5.4.3.8 Rest of Europe
- 5.4.4 South America
- 5.4.4.1 Brazil
- 5.4.4.2 Argentina
- 5.4.4.3 Rest of South America
- 5.4.5 Middle-East and Africa
- 5.4.5.1 Saudi Arabia
- 5.4.5.2 South Africa
- 5.4.5.3 Rest of Middle-East and Africa
- 5.4.1 Asia-Pacific
6 Competitive Landscape
- 6.1 Market Concentration
- 6.2 Strategic Moves
- 6.3 Market Share(%)/Ranking Analysis
- 6.4 Company Profiles (includes Global level Overview, Market level overview, Core Segments, Financials as available, Strategic Information, Market Rank/Share for key companies, Products and Services, and Recent Developments)
- 6.4.1 AK Scientific Inc.
- 6.4.2 Avantium
- 6.4.3 Biofine Technology, llc.
- 6.4.4 GFBiochemicals
- 6.4.5 GODAVARI BIOREFINERIES LTD.
- 6.4.6 Hangzhou Aromalake Tech Co., Ltd.
- 6.4.7 Hebei Yanuo Bioscience Group Co., Ltd
- 6.4.8 LangFang Hawk Technology and Development Co,Ltd.
- 6.4.9 Merck KGaA (Sigma-Aldrich)
- 6.4.10 NXTLEVVEL Biochem
- 6.4.11 Shandong Xinhua Pharma
- 6.4.12 Thermo Fisher Scientific Inc.
- 6.4.13 Tokyo Chemical Industry Co,. Ltd.
- 6.4.14 Zibo Changlin Chemical Industry Co., Ltd.
7 Market Opportunities and Future Outlook
- 7.1 White-space and Unmet-need Assessment
- 7.2 Growing Prevalence of Bio-based Levulinic Acid
 乙醯丙酸市場:2026-2032年全球市場預測(依產品類型、功能、純度等級、應用、終端用戶產業及通路分類)
 乙醯丙酸市場分析及預測(至2035年):類型、產品類型、應用、技術、最終用戶、劑型、製程、功能
 全球乙醯丙酸市場規模、佔有率、趨勢和成長分析報告(2026-2034年)
 乙醯丙酸市場規模、佔有率及成長分析(按生產流程、應用和地區分類)-2026-2033年產業預測
 2025-2033年乙醯丙酸市場報告,依技術(酸水解、生物精煉)、最終用途產業(農業、製藥、食品、化妝品等)、形態(液體、固體)和地區分類
 乙醯丙酸乙酯市場規模、佔有率、成長分析、按製造流程、按物理狀態、按純度等級、按應用、按最終用戶行業、按地區、按行業預測(2025-2032 年)乙醯丙酸市場:按技術、形式、應用和地區分類,2026 年至 2032 年
 乙醯丙酸乙酯市場規模、佔有率、趨勢分析報告:按類型、應用、地區、細分市場預測,2025-2030 年