


 |
市場調查報告書
商品編碼
1851867
雷射感測器:市場佔有率分析、行業趨勢、統計數據和成長預測(2025-2030 年)Laser Sensor - Market Share Analysis, Industry Trends & Statistics, Growth Forecasts (2025 - 2030) |
||||||
※ 本網頁內容可能與最新版本有所差異。詳細情況請與我們聯繫。
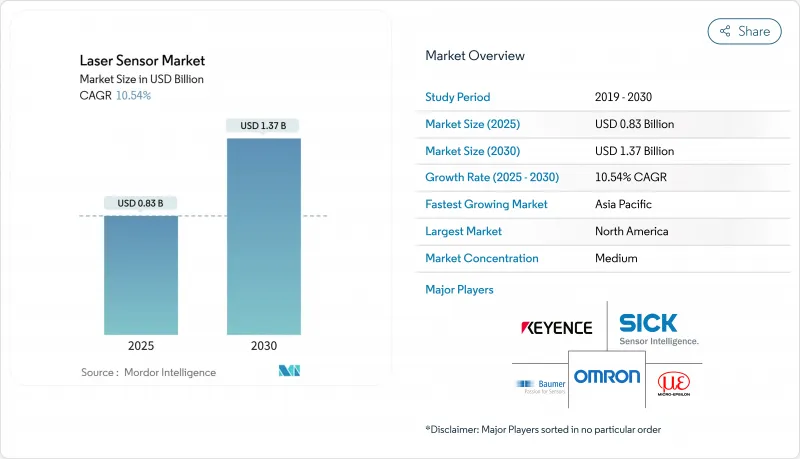
預計到 2025 年,雷射感測器市場規模將達到 8.3 億美元,到 2030 年將達到 13.7 億美元,複合年成長率為 10.54%。
隨著工廠自動化測量任務的推進,對微米級精度要求日益提高,固體雷射雷達價格的下降為自動駕駛汽車、機器人和基礎設施檢測等領域帶來了新的機會。歐洲基礎設施計劃強制使用數位雙胞胎文檔,以及亞太地區對電動車電池生產線尺寸公差要求的提高,都進一步推動了市場成長。校準、預測性維護和分析等服務的成長速度超過了硬體銷售,這表明感測器生態系統日益成熟,長期性能與感測器採購同等重要。
全球雷射感測器市場趨勢與洞察
汽車電動車電池組裝中的精密間隙閉合
在電動車電池生產線中,雷射位移感測器正在取代接觸式測量儀,因為0.1毫米的尺寸誤差可能導致電池容量減少高達5%。無散斑藍光雷射系統可即時檢測膠輪胎邊緣和焊縫,從而減少廢品和返工。亞洲電池製造商正在部署線上多感測器鑽機,該裝置可同時測量電池堆高度、極耳對齊情況和焊接熔深,從而縮短新化學系統的推出時間。
半導體封裝領域3D AOI技術的激增
先進的封裝技術採用高頻寬晶片,對空隙或共面性缺陷零容忍。線掃描3D雷射感應器可偵測不平整表面上的5微米缺陷,並結合深度學習技術,將SinceVision的誤剔率降低了40%。整合的多波長掃描頭可減少反射性模塑化合物中的干擾,並可在節拍時間內完成全區域掃描。
高溫鑄造線的熱漂移敏感性
由於半導體代工生產過程中極端溫度變化和先進節點製造流程對精度的高要求,雷射位移感測器面臨獨特的挑戰。專為嚴苛環境設計的碳化矽壓力感測器展現了材料科學的進步,能夠在-50 度C至600 度C的工作範圍內保持滿量程輸出0.18%以內的精度,從而有效解決熱穩定性問題。然而,由於光學元件的熱膨脹和波長漂移,基於雷射的系統在代工環境中面臨新的挑戰,這些因素可能會影響測量精度。
細分市場分析
到2024年,硬體將佔雷射感測器市場收入的82%,這將支撐全球生產線對高可靠性測距和位移感測器的持續需求。供應商正將多波長探頭、溫度穩定模組和M12連接器捆綁銷售,以降低整合難度。同時,用戶正在縮短重新校準週期以符合ISO9001審核,促使第三方實驗室和OEM現場團隊將設備認證頻率從每年兩次改為每季一次。
到2030年,服務業的複合年成長率將達到12.5%,因為一級供應商簽署了多年校準和預測性維護契約,以確保感測器在其使用壽命內達到±2µm的性能。新型插件將混合雷射雷達探頭連接到企業級品質平台,使漂移異常能夠在幾分鐘內顯示在統計過程控制儀表板上。隨著越來越多的中型企業將計量專業知識外包,經常性收入正在平抑資本支出週期性波動,並重塑競爭格局。
到2024年,測距設備將維持30%的雷射感測器市場佔有率,這主要得益於自動門、輸送機偵測和基本零件定位等應用。然而,3D輪廓測量單元將以14%的複合年成長率成長,因為它們能夠繪製複雜形狀的輪廓,使電子裝配商能夠測量焊料凸起,汽車生產線能夠在不中斷生產流程的情況下檢測焊點。
機械製造商正將輪廓加工頭直接整合到機器人控制器中,從而實現同步刀具路徑修正,減少20%的廢品。在安全至關重要的電動車電池生產中,用於位移建模的雷射感測器市場也將成長,因為電池厚度檢驗的公差必須控制在5微米或更小。振動和能量感測器將在結構健康監測中繼續發揮其獨特作用,而三角測量法在光線散射可預測的啞光錶面上仍將廣泛應用。
區域分析
在北美,高昂的人事費用和成熟的安全標準推動了自動化技術的快速發展。倉庫用雷射測距感測器取代超音波模組後,精度提高了50倍,貨位利用率也得到了提升,並節省了15%的占地面積,從而形成了一個促進機器人投資的良性循環。監管方面的考量,特別是與加拿大新排放法規相關的問題,迫使企業儘早採取措施以符合規定,這雖然延緩了中小企業進入自動化領域的步伐,但最終提升了整體解決方案的品質。
亞太地區在雷射感測器市場銷售方面領先,這主要得益於電動車電池、電子產品和通用製造業叢集的推動。預計到2025年,該地區在光電領域的投資將達到50億美元,從而建立一個能夠縮短前置作業時間並促進應用特定設計組件的獎勵系統。中國、日本和韓國共同引領線上計量技術的應用,而東南亞則以與工業4.0相關的激勵措施吸引產能擴張。
歐洲憑藉其強大的汽車工程實力數位雙胞胎基礎設施策略,繼續保持市場主導地位。固態雷射雷達成本的下降將加速德國和斯堪地那維亞工廠採用自動導引車(AGV),而強大的機器視覺供應鏈預計將推動其收入在2025年前實現8-9%的成長。統一的安全標準將促使供應商在互鎖外殼和故障安全電路方面進行創新,從而確保其在全部區域的市場進入。
其他福利:
- Excel格式的市場預測(ME)表
- 3個月的分析師支持
目錄
第1章 引言
- 研究假設和市場定義
- 調查範圍
第2章調查方法
第3章執行摘要
第4章 市場情勢
- 市場概覽
- 市場促進因素
- 亞洲汽車電動車電池的精密間隙閉合推動了雷射位移感測器的應用
- 3D AOI 用於半導體封裝突波檢測,推廣 3D 線雷射感測器
- 北美智慧倉庫從超音波感測器向雷射測距感測器的過渡
- 固體LiDAR成本下降,推動歐洲自動導引車採用飛行時間感測器
- 歐盟基礎設施計劃強制數位雙胞胎文件製度促進了遠距剖面感測器的應用。
- 醫療設備製造中無塵室非接觸式測量標準
- 市場限制
- 高溫拋投線的熱漂移敏感性
- 3B類和4類動力排放的監理限值
- 來自CMOS ToF相機替代品的價格壓力
- 高反射表面上的訊號雜訊
- 價值/供應鏈分析
- 技術展望
- 波特五力分析
- 新進入者的威脅
- 買方的議價能力
- 供應商的議價能力
- 替代品的威脅
- 競爭對手之間的競爭
第5章 市場規模與成長預測
- 按組件
- 硬體
- 軟體
- 服務
- 依感測器類型
- 距離/範圍感測器
- 位移感測器
- 輪廓/線感應器
- 振動和能量感測器
- 三角測量感測器
- 其他
- 按測量範圍
- 小於100毫米(短程)
- 100-300 毫米(中型範圍)
- 300毫米或以上(遠射程)
- 透過輸出
- 小於1毫瓦
- 1-100 mW
- 101-500 mW
- 500毫瓦或以上
- 按尺寸
- 一維單點感測器
- 2D面積感測器
- 3D輪廓感測器
- 按最終用戶行業分類
- 電子製造
- 汽車與出行
- 航太
- 建築/施工
- 醫療保健和醫療設備
- 食品/飲料加工
- 物流、倉儲管理與機器人技術
- 其他行業
- 按地區
- 北美洲
- 美國
- 加拿大
- 墨西哥
- 歐洲
- 英國
- 德國
- 法國
- 義大利
- 其他歐洲地區
- 亞太地區
- 中國
- 日本
- 印度
- 韓國
- 亞太其他地區
- 中東
- 以色列
- 沙烏地阿拉伯
- 阿拉伯聯合大公國
- 土耳其
- 其他中東地區
- 非洲
- 南非
- 埃及
- 其他非洲地區
- 南美洲
- 巴西
- 阿根廷
- 其他南美洲國家
- 北美洲
第6章 競爭情勢
- 市場集中度
- 策略趨勢
- 市佔率分析
- 公司簡介
- Keyence Corporation
- SICK AG
- OMRON Corporation
- Micro-Epsilon Messtechnik GmbH and Co. KG
- IFM Electronic GmbH
- Baumer Electric AG
- SmartRay GmbH
- Rockwell Automation Inc.
- Dimetix AG
- First Sensor AG(TE Connectivity)
- Banner Engineering Corp.
- Panasonic Industry Co.
- Cognex Corporation
- FARO Technologies Inc.
- Honeywell International Inc.
- Polytec GmbH
- OMS Corporation
- Teledyne DALSA
- Acuity Laser(Schmitt Measurement)
- Hokuyo Automatic Co. Ltd.
- Datalogic SpA
第7章 市場機會與未來展望
The laser sensor market size is valued at USD 0.83 billion in 2025 and is forecast to reach USD 1.37 billion by 2030 at a 10.54% CAGR.
Demand is rising as factories automate measurement tasks that require micron-level accuracy, while falling solid-state LiDAR prices open new opportunities in autonomous vehicles, robots and infrastructure inspection. Growth is reinforced by the mandatory use of digital twin documentation on European infrastructure projects and by Asia-Pacific's push to tighten dimensional tolerances in electric-vehicle (EV) battery lines. Service offerings around calibration, predictive maintenance and analytics are expanding faster than hardware sales, signalling a maturing ecosystem in which long-term performance matters as much as sensor procurement.
Global Laser Sensor Market Trends and Insights
Precision-gap closure in automotive EV battery assembly
Laser displacement sensors are replacing contact gauges on EV battery lines because 0.1 mm dimensional error can trim battery capacity by up to 5%. Speckle-free blue-laser systems now verify glue beads and weld seams in real time, cutting scrap and rework. Asian cell makers are installing in-line multi-sensor rigs that measure stack height, tab alignment and weld penetration simultaneously, shortening ramp-up times for new chemistries.
Surge in 3D AOI for semiconductor packaging
Advanced packages house high-bandwidth chips that cannot tolerate voids or coplanarity defects. Line-scan 3D laser sensors detect 5-micron faults on uneven surfaces and, when paired with deep learning, lower false-reject rates by 40% SinceVision. Integrated multi-wavelength heads reduce interference inside reflective molding compounds, enabling full-area scans within takt times.
Thermal drift sensitivity in high-temperature foundry lines
Semiconductor foundry operations present unique challenges for laser displacement sensors due to extreme temperature variations and the precision requirements of advanced node production processes. Silicon carbide pressure sensors designed for harsh environments demonstrate the material science advances needed to address thermal stability, with operational ranges extending from -50°C to 600°C while maintaining accuracy within 0.18% full-scale output. However, laser-based systems face additional challenges from thermal expansion of optical components and wavelength drift that can compromise measurement accuracy in foundry environments.
Other drivers and restraints analyzed in the detailed report include:
- Migration from ultrasonic to laser range sensors in smart warehousing
- Solid-state LiDAR cost decline enabling ToF sensors in European AGVs
- Regulatory restrictions on Class 3B & 4 power emissions
For complete list of drivers and restraints, kindly check the Table Of Contents.
Segment Analysis
Hardware dominated the laser sensor market size with an 82% revenue share in 2024, anchored by continued demand for ruggedized distance and displacement units on global production lines. Vendors are bundling multi-wavelength heads, temperature stabilization modules and M12 connectors to reduce integration effort. At the same time, users are tightening recalibration intervals to meet ISO 9001 audits, pushing third-party labs and OEM field teams to certify equipment four times per year rather than twice.
Services post a 12.5% CAGR to 2030 as tier-one suppliers lock in multi-year calibration and predictive-maintenance contracts that guarantee +-2 µm performance across sensor lifespan. Software sales ride this wave; new plug-ins link hybrid LADAR heads to enterprise quality-platforms, allowing statistical-process-control dashboards to surface drift anomalies within minutes. As more mid-cap firms outsource metrology expertise, recurring revenue smooths the cyclicality of capital expenditure, reshaping competitive priorities within the laser sensor market.
Distance and range devices retained a 30% laser sensor market share in 2024, underpinned by automatic doors, conveyor presence checks and basic part positioning. Yet 3D profile units expand at 14% CAGR because they map complex geometries, letting electronics assemblers measure solder bulges and automotive lines inspect weld nuggets without halting flow.
Machine builders integrate profile heads directly with robot controllers, enabling synchronous toolpath corrections that cut scrap by 20%. The laser sensor market size for displacement models also rises in safety-critical EV battery production, where thickness verification must stay below 5 µm tolerance. Vibration and energy sensors preserve niche roles in structural-health monitoring, while triangulation remains common on matte surfaces that scatter light predictably.
The Laser Sensors Market Report is Segmented by Component (Hardware, Software, Services), Sensor Type (Distance/Range, Displacement, Profiling, and More), Measurement Range (Less Than 100 Mm, 100 - 300 Mm, and More), Power Output (Less Than 1mW, 1 - 100mW, and More), Dimensionality (1D, 2D, 3D), End-User Industry (Electronics, Automotive, and More), and Geography. The Market Forecasts are Provided in Terms of Value (USD).
Geography Analysis
North America adopts automation quickly, aided by high labor costs and mature safety standards. Warehouses replacing ultrasonic modules with laser range sensors achieve 50 X accuracy gains and slot utilization improvements that free 15% floor space, supporting a virtuous cycle of robotics investment. Regulatory vigilance, highlighted by new Canadian emission rules, forces early compliance spending that can slow smaller entrants but ultimately raises average solution quality.
Asia-Pacific leads the laser sensor market on volume, propelled by EV battery, electronics and general manufacturing clusters. Regional photonics investment is reaching USD 5 billion by 2025, nurturing component ecosystems that shorten lead times and encourage application-specific designs. China, Japan and South Korea jointly spearhead in-line metrology adoption, while Southeast Asia lures capacity expansions with incentives linked to Industry 4.0 readiness.
Europe remains influential due to automotive engineering strength and infrastructure digital-twin mandates. Falling solid-state LiDAR costs accelerate AGV deployments in German and Scandinavian plants, and a robust machine-vision supply chain forecasts 8-9% revenue growth for 2025. Harmonized safety codes push vendors to innovate around interlocked housings and fail-safe circuits, preserving market access across the region.
- Keyence Corporation
- SICK AG
- OMRON Corporation
- Micro-Epsilon Messtechnik GmbH and Co. KG
- IFM Electronic GmbH
- Baumer Electric AG
- SmartRay GmbH
- Rockwell Automation Inc.
- Dimetix AG
- First Sensor AG (TE Connectivity)
- Banner Engineering Corp.
- Panasonic Industry Co.
- Cognex Corporation
- FARO Technologies Inc.
- Honeywell International Inc.
- Polytec GmbH
- OMS Corporation
- Teledyne DALSA
- Acuity Laser (Schmitt Measurement)
- Hokuyo Automatic Co. Ltd.
- Datalogic S.p.A.
Additional Benefits:
- The market estimate (ME) sheet in Excel format
- 3 months of analyst support
TABLE OF CONTENTS
1 INTRODUCTION
- 1.1 Study Assumptions and Market Definition
- 1.2 Scope of the Study
2 RESEARCH METHODOLOGY
3 EXECUTIVE SUMMARY
4 MARKET LANDSCAPE
- 4.1 Market Overview
- 4.2 Market Drivers
- 4.2.1 Precision-Gap Closure in Automotive EV Battery Assembly Driving Laser Displacement Sensors Adoption in Asia
- 4.2.2 Surge in 3D AOI for Semiconductor Packaging Boosting 3D Line Laser Sensor
- 4.2.3 Migration from Ultrasonic to Laser Range Sensors in Smart Warehousing in North America
- 4.2.4 Solid-State LiDAR Cost Decline Enabling ToF Sensors in European AGVs
- 4.2.5 Mandatory Digital Twin Documentation in EU Infrastructure Projects Fueling Long-Range Profiling Sensors
- 4.2.6 Clean-room Non-Contact Gauging Standards in Medical Device Manufacturing
- 4.3 Market Restraints
- 4.3.1 Thermal Drift Sensitivity in High-Temperature Foundry Lines
- 4.3.2 Regulatory Restrictions on Class 3B and 4 Power Emissions
- 4.3.3 Price Pressure from CMOS ToF Camera Alternatives
- 4.3.4 Signal Noise on Highly Reflective Surfaces
- 4.4 Value / Supply-Chain Analysis
- 4.5 Technological Outlook
- 4.6 Porter's Five Forces Analysis
- 4.6.1 Threat of New Entrants
- 4.6.2 Bargaining Power of Buyers
- 4.6.3 Bargaining Power of Suppliers
- 4.6.4 Threat of Substitutes
- 4.6.5 Intensity of Competitive Rivalry
5 MARKET SIZE AND GROWTH FORECASTS (VALUE)
- 5.1 By Component
- 5.1.1 Hardware
- 5.1.2 Software
- 5.1.3 Services
- 5.2 By Sensor Type
- 5.2.1 Distance / Range Sensors
- 5.2.2 Displacement Sensors
- 5.2.3 Profiling / Line Sensors
- 5.2.4 Vibration and Energy Sensors
- 5.2.5 Triangulation Sensors
- 5.2.6 Others
- 5.3 By Measurement Range
- 5.3.1 Less than 100 mm (Short-Range)
- 5.3.2 100 - 300 mm (Medium-Range)
- 5.3.3 Greater than 300 mm (Long-Range)
- 5.4 By Power Output
- 5.4.1 Less than 1 mW
- 5.4.2 1 - 100 mW
- 5.4.3 101 - 500 mW
- 5.4.4 Greater than 500 mW
- 5.5 By Dimensionality (Volume)
- 5.5.1 1D Point Sensors
- 5.5.2 2D Area Sensors
- 5.5.3 3D Profile Sensors
- 5.6 By End-user Industry
- 5.6.1 Electronics Manufacturing
- 5.6.2 Automotive and Mobility
- 5.6.3 Aerospace and Aviation
- 5.6.4 Building and Construction
- 5.6.5 Healthcare and Medical Devices
- 5.6.6 Food and Beverage Processing
- 5.6.7 Logistics, Warehousing and Robotics
- 5.6.8 Other Industries
- 5.7 By Geography
- 5.7.1 North America
- 5.7.1.1 United States
- 5.7.1.2 Canada
- 5.7.1.3 Mexico
- 5.7.2 Europe
- 5.7.2.1 United Kingdom
- 5.7.2.2 Germany
- 5.7.2.3 France
- 5.7.2.4 Italy
- 5.7.2.5 Rest of Europe
- 5.7.3 Asia-Pacific
- 5.7.3.1 China
- 5.7.3.2 Japan
- 5.7.3.3 India
- 5.7.3.4 South Korea
- 5.7.3.5 Rest of Asia-Pacific
- 5.7.4 Middle East
- 5.7.4.1 Israel
- 5.7.4.2 Saudi Arabia
- 5.7.4.3 United Arab Emirates
- 5.7.4.4 Turkey
- 5.7.4.5 Rest of Middle East
- 5.7.5 Africa
- 5.7.5.1 South Africa
- 5.7.5.2 Egypt
- 5.7.5.3 Rest of Africa
- 5.7.6 South America
- 5.7.6.1 Brazil
- 5.7.6.2 Argentina
- 5.7.6.3 Rest of South America
- 5.7.1 North America
6 COMPETITIVE LANDSCAPE
- 6.1 Market Concentration
- 6.2 Strategic Moves
- 6.3 Market Share Analysis
- 6.4 Company Profiles (includes Global-level Overview, Market-level Overview, Core Segments, Financials as available, Strategic Information, Market Rank/Share, Products and Services, Recent Developments)
- 6.4.1 Keyence Corporation
- 6.4.2 SICK AG
- 6.4.3 OMRON Corporation
- 6.4.4 Micro-Epsilon Messtechnik GmbH and Co. KG
- 6.4.5 IFM Electronic GmbH
- 6.4.6 Baumer Electric AG
- 6.4.7 SmartRay GmbH
- 6.4.8 Rockwell Automation Inc.
- 6.4.9 Dimetix AG
- 6.4.10 First Sensor AG (TE Connectivity)
- 6.4.11 Banner Engineering Corp.
- 6.4.12 Panasonic Industry Co.
- 6.4.13 Cognex Corporation
- 6.4.14 FARO Technologies Inc.
- 6.4.15 Honeywell International Inc.
- 6.4.16 Polytec GmbH
- 6.4.17 OMS Corporation
- 6.4.18 Teledyne DALSA
- 6.4.19 Acuity Laser (Schmitt Measurement)
- 6.4.20 Hokuyo Automatic Co. Ltd.
- 6.4.21 Datalogic S.p.A.
7 MARKET OPPORTUNITIES AND FUTURE OUTLOOK
- 7.1 White-space and Unmet-need Assessment
 粉塵濃度感測器市場報告:趨勢、預測和競爭分析(至2035年)車載顆粒物感測器市場報告:趨勢、預測及競爭分析(至2035年)對射式雷射感測器市場報告:趨勢、預測及競爭分析(至2035年)
 2026年全球道路輪廓雷射感測器市場報告
 工業雷射感測器市場:按雷射類型、檢測原理、檢測範圍、應用、終端用戶產業和銷售管道分類-2026-2032年全球市場預測
 雷射感測器市場規模、佔有率、趨勢和預測:按類型、組件、應用、最終用戶和地區分類,2026-2034年汽車雷射粉塵感測器市場按車輛類型、雷射類型、電源類型、應用和最終用戶分類,全球預測(2026-2032年)雷射粉塵濃度感測器市場(按產品類型、應用、最終用戶、連接方式、部署方式、組件和銷售管道),全球預測,2026-2032年
 雷射測距感測器市場分析及預測(至2035年):按類型、產品類型、技術、組件、應用、材質、最終用戶、功能、安裝類型和解決方案分類
 雷射感測器市場 - 全球產業規模、佔有率、趨勢、機會及預測(按類型、組件、應用、產業、地區和競爭格局分類),2021-2031年