


 |
市場調查報告書
商品編碼
1910642
全球熱泵市場:市場佔有率分析、產業趨勢與統計、成長預測(2026-2031年)Global Heat Pumps - Market Share Analysis, Industry Trends & Statistics, Growth Forecasts (2026 - 2031) |
||||||
※ 本網頁內容可能與最新版本有所差異。詳細情況請與我們聯繫。
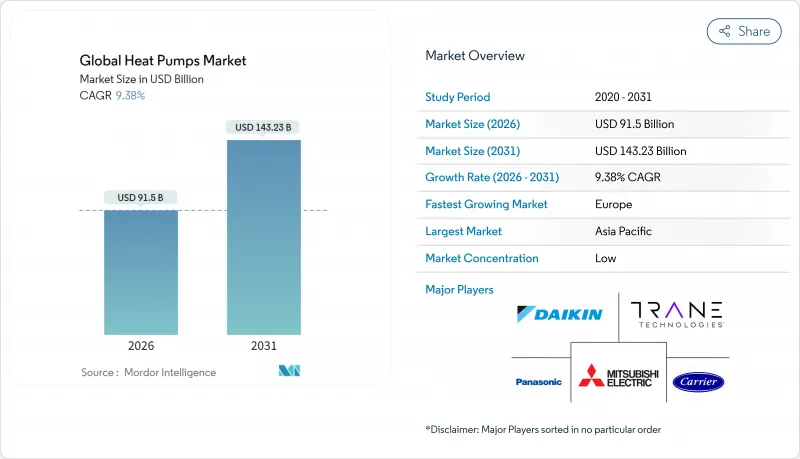
2025年熱泵市值為836.6億美元,預計從2026年的915億美元成長到2031年的1432.3億美元,在預測期(2026-2031年)內複合年成長率為9.38%。
歐洲和北美地區的脫碳政策、聯邦和州政府的大規模獎勵以及日益大規模的公用事業計劃,已使熱泵市場成為石化燃料空間和熱水解決方案的主要替代方案。中國一體化的製造地有助於控制成本,而變頻壓縮機技術的進步縮小了零下溫度下的性能差距,為在寒冷氣候地區快速推廣應用奠定了基礎。美國和波蘭的供應鏈在地化措施降低了關稅和運輸風險,而不斷發展的「供熱即服務」融資模式則解決了高昂的初始安裝成本問題,此前這一成本曾阻礙了現有建築的普及。
全球熱泵市場趨勢與洞察
政府脫碳獎勵和強制規定
積極的政策框架透過將建築規範和補貼水準與可再生熱能的性能直接掛鉤,從而創造了對熱泵的強勁需求。美國的《通貨膨脹控制法案》結合了聯邦稅額扣抵和州補貼計劃,為每個家庭提供高達14,000美元的補貼;德國則強制規定,從2024年起,新建供暖系統必須至少使用65%的可再生熱能。加拿大的「油泵轉型計畫」為低收入家庭提供高達15,000加元(約11,100美元)的補貼;英國的「鍋爐更新計畫」則提供高達7,500英鎊(約9,400美元)的津貼。這些措施人為地設定了需求下限,保護製造商免受宏觀經濟放緩的影響,並加速了市場滲透。
電氣化推廣導致空調設備更換週期延長
主要城市實施的區域溫室氣體排放上限政策,縮短了暖通空調系統的更換週期(從傳統的15-20年縮短),並加速了老舊鍋爐的維修,以高效熱泵取而代之。紐約市第97號地方法律促成了諸如Hudson街345號維修項目等計劃,該項目結合了熱泵和余熱回收技術,力爭在2030年前實現排放70%的目標。麻州一家公共產業在弗雷明漢推出了美國首個地熱網路,於2024年為135戶用戶提供服務,展現了社區電氣化的潛力。
現有建築物的安裝和維修成本很高
總安裝成本因地區而異。在德國,維修一棟典型的聯排住宅需要花費超過 3 萬歐元(約 3.24 萬美元),是法國的兩倍,即使享受了補貼,由於人事費用高昂和核准流程嚴格,實際成本仍然如此。在紐約的一個多用戶住宅案例研究中,僅配電盤升級一項就佔了計劃總成本的 40%,這凸顯了基礎設施方面的障礙,而這些障礙無法透過獎勵完全消除。
細分市場分析
由於安裝成本低且產品認知度高,空氣源熱泵預計2025年將佔據熱泵市場73.12%的佔有率。然而,地源/地熱能預計將成為該領域成長最快的細分市場,年複合成長率將達到12.35%,這主要得益於公共產業試點建設聯網迴路,例如耗資1400萬美元的弗雷明漢計劃,該項目計劃於2024年連接135戶家庭。直接膨脹式鑽孔技術和共用地下迴路的進步已將能源效率比(COP)穩定性提升至4.0以上,從而推動了高密度都市區改造區域的需求。
空氣源熱泵製造商不斷改進其低溫演算法,有效控制了-20°F(約-29 度C)時的性能下降,從而促進了北方地區的成長。同時,公用事業公司和大型開發商正將地熱系統定位為應對電網尖峰負載的保障,因為其輸出功率不受高溫驟降的影響。這些發展預示著市場結構正在逐步重新平衡,儘管預計在整個預測期內,空氣源熱泵仍將繼續在熱泵市場中主導地位。
2025年,10kW以下的住宅系統將佔總出貨量的45.92%,反映出在消費者補貼的支持下,單戶住宅的廣泛應用。然而,30kW以上的系統將佔據主導地位,年複合成長率將達到12.18%,這主要得益於區域供熱製冷和工業流程計劃的成長。例如,丹麥埃斯比約海水淡化廠(70MW)和漢堡污水利用計劃(60MW)等項目,都展現了大型集中式設施的發展動能。
標準化的安裝和簡化的核准程序將確保小容量太陽能發電系統維持較高的普及率。而倉庫、食品加工和旨在實現碳中和供暖的市政管網等應用領域的不斷拓展,則為大容量太陽能發電系統的發展提供了支撐。
热泵市场按热源类型(空气源、水源、地热源)、额定容量(<10kW、10-20kW、>20kW)、系统设计(分体式、一体式、混合式热泵)、最终用户(住宅、商业、其他)、应用(空间供暖/制冷、热水等)和地区进行细分。市場預測以美元以金額為準。
區域分析
亞太地區預計在2025年仍將佔據全球熱泵市場38.05%的主導地位,這主要得益於中國國內銷售額13%的成長、中國在全球40%的產能佔比,以及工廠自動化程度提高帶來的單位成本下降12%。日本1%的謹慎銷售成長和韓國在壓縮機技術上的領先地位穩定了區域出貨量,而印度由於其熱帶氣候限制了傳統設計的效率優勢,仍處於發展階段。
歐洲正在復甦,預計年複合成長率將達到10.92%。此前,德國一項暖氣法案的辯論打擊了消費者信心,導致2024年初銷售量下降了50%。法國承諾每年在國內生產100萬台空調,而丹麥則公佈了包括埃斯比約海水淡化廠在內的區域旗艦計劃,作為其2030年實現石化燃料燃料目標的一部分。儘管英國獲得了高達7,500英鎊的補貼,但其空調安裝目標仍落後於預期,這凸顯了基礎設施和技能方面的障礙遠比純粹的經濟因素更為重要。
在經歷了最初的放緩之後,北美已進入政策支持下的成長週期。在美國,《通膨控制法案》的獎勵措施已促使銷售額在2024年11月前年增15%。在加拿大,已處理超過13,000份撥款申請,主要集中在大西洋省份。供應鏈回流舉措,例如三菱電機壓縮機廠和Daikin-Copeland合資企業,旨在透過關鍵零件的在地化生產來抵消預計2.5億至2.75億美元的關稅負擔。
其他福利:
- Excel格式的市場預測(ME)表
- 3個月的分析師支持
目錄
第1章 引言
- 研究假設和市場定義
- 調查範圍
第2章調查方法
第3章執行摘要
第4章 市場情勢
- 市場概覽
- 市場促進因素
- 政府脫碳獎勵和強制規定
- 電氣化導致空調設備更換週期延長
- 變頻壓縮機的成本迅速下降
- 併網熱泵能夠實現需量反應收益
- 寒冷地區熱泵技術的創新
- 透過「供熱即服務」經營模式進行資金籌措的潛力
- 市場限制
- 現有建築物的安裝和維修成本很高
- 熟練安裝人員短缺
- 現有住宅存量的配電盤和電網容量有限制。
- 在某些國家,與混合氫鍋爐競爭的風險
- 價值/供應鏈分析
- 監管環境
- 技術展望
- 宏觀經濟因素的影響
- 波特五力模型
- 供應商的議價能力
- 買方的議價能力
- 新進入者的威脅
- 替代品的威脅
- 競爭程度
第5章 市場規模與成長預測
- 按來源
- 空氣源
- 空對空
- 空氣-水熱交換
- 水源
- 地表水
- 開放回路
- 地下/地熱源
- 閉合迴路垂直型
- 閉合迴路水平型
- 直接通貨膨脹
- 空氣源
- 按額定容量
- 最大功率 10kW
- 10-20 kW
- 20-30 kW
- 30千瓦或以上
- 透過系統設計
- 分離式系統
- 單體塊
- 混合熱泵
- 最終用戶
- 住宅
- 商業的
- 產業
- 對機構而言
- 透過使用
- 暖氣和冷氣設備
- 熱水供應
- 區域供熱
- 製程和工業加熱
- 按地區
- 北美洲
- 美國
- 加拿大
- 墨西哥
- 南美洲
- 巴西
- 阿根廷
- 其他南美洲
- 歐洲
- 德國
- 英國
- 法國
- 義大利
- 俄羅斯
- 其他歐洲地區
- 亞太地區
- 中國
- 日本
- 韓國
- 印度
- ASEAN
- 亞太其他地區
- 中東和非洲
- 中東
- 沙烏地阿拉伯
- 阿拉伯聯合大公國
- 土耳其
- 其他中東地區
- 非洲
- 南非
- 奈及利亞
- 其他非洲地區
- 中東
- 北美洲
第6章 競爭情勢
- 市場集中度
- 策略趨勢
- 市佔率分析
- 公司簡介
- Daikin Industries, Ltd.
- Mitsubishi Electric Corporation
- Panasonic Holdings Corporation
- Trane Technologies plc
- Carrier Global Corporation
- NIBE Industrier AB
- Glen Dimplex Group
- Viessmann Climate Solutions SE
- Stiebel Eltron GmbH & Co. KG
- Midea Group Co., Ltd.
- Guangdong Gree Electric Appliances Inc. of Zhuhai
- Haier Smart Home Co., Ltd.
- Bosch Thermotechnology GmbH(Robert Bosch GmbH)
- LG Electronics Inc.
- Lennox International Inc.
- Ariston Holding NV(Ariston Group)
- Samsung Electronics Co., Ltd.
- Rheem Manufacturing Company
- Johnson Controls International plc
- Viomi Technology Co., Ltd.
- AO Smith Corporation
- Ecoforest Geotermia SL
- WaterFurnace International, Inc.(NIBE Group)
- Danfoss A/S
- Vaillant GmbH
第7章 市場機會與未來趨勢
- 評估差距和未滿足的需求
The heat pump market was valued at USD 83.66 billion in 2025 and estimated to grow from USD 91.5 billion in 2026 to reach USD 143.23 billion by 2031, at a CAGR of 9.38% during the forecast period (2026-2031).
Decarbonization mandates in Europe and North America, large federal and provincial incentive packages, and ever-larger utility-scale projects positioned the heat pump market as the leading replacement pathway for fossil-fuel-based space and water heating solutions. China's integrated manufacturing base held costs down while inverter-driven compressor advances narrowed performance gaps in sub-zero environments, setting the stage for rapid uptake in colder regions. Supply-chain localization efforts in the United States and Poland mitigated tariff and freight risks while growing "Heat-as-a-Service" finance models addressed steep upfront installation costs that had slowed adoption in existing buildings.
Global Heat Pumps Market Trends and Insights
Government decarbonization incentives and mandates
Aggressive policy frameworks created binding demand for heat pumps by tying building codes and subsidy levels directly to renewable heat outcomes. The US Inflation Reduction Act offered combined federal tax credits and state rebates as high as USD 14,000 per household, while Germany enforced its 65% renewable-heat requirement for all new heating systems starting in 2024. Canada's Oil to Heat Pump Affordability Program provided up to CAD 15,000 (USD 11,100) to lower-income homes, and the UK's Boiler Upgrade Scheme paid grants of up to GBP 7,500 (USD 9,400). These measures set artificial demand floors that shielded manufacturers from macroeconomic slowdowns and accelerated market penetration.
Electrification-driven HVAC replacement cycles
Local greenhouse gas caps in large cities condensed typical 15-20 year HVAC replacement intervals into fast-tracked retrofits that replace failing boilers with high-efficiency heat pumps. New York City's Local Law 97 triggered projects such as the retrofit of 345 Hudson Street, combining heat pumps and waste-heat recovery to hit a 70% emissions-cut target by 2030. Massachusetts Utilities launched the first US geothermal network in Framingham, connecting 135 customers in 2024 and demonstrating district-level electrification potential.
High installation and retrofitting costs in existing buildings
Total installed pricing diverged sharply by geography. Typical German row-house retrofits exceeded EUR 30,000 (USD 32,400), double France's post-subsidy cost because of higher labor expenses and stricter permitting rules. A New York multifamily case study showed that electrical panel upgrades alone amounted to 40% of the project cost, highlighting infrastructure hurdles that incentives cannot fully offset.
Other drivers and restraints analyzed in the detailed report include:
- Rapid cost declines in inverter-driven compressors
- Cold-climate heat pump technology breakthroughs
- Skilled installer shortage
For complete list of drivers and restraints, kindly check the Table Of Contents.
Segment Analysis
Air-source units held 73.12% heat pump market share in 2025 because of lower installation costs and product familiarity. However, the ground/geothermal category is forecast to post a 12.35% CAGR, the fastest within the spectrum, as utilities pilot networked loops such as the USD 14 million Framingham project that connected 135 customers in 2024. Advances in direct-expansion boreholes and shared ground loops improved COP stability above 4.0, increasing appeal in dense urban infill.
Air-source manufacturers continued to refine low-ambient algorithms, cutting performance drop-off at -20°F and unlocking northern growth. Meanwhile, utilities and large developers viewed geothermal systems as a hedge against grid-peak constraints because output is decoupled from outdoor temperature swings. These dynamics suggest gradual rebalancing, yet the heat pump market will still see air-source units dominate unit volumes through the forecast horizon.
Residential-scale systems up to 10 kW contributed 45.92% of 2025 shipments, reflecting the breadth of single-family adoption supported by consumer rebates. The above-30 kW class, however, is projected to outpace all others at a 12.18% CAGR as district heating and industrial process projects proliferate. Denmark's 70 MW Esbjerg seawater plant and Hamburg's 60 MW wastewater initiative highlight the momentum toward centralized mega-scale assets.
Small-capacity uptake will remain elevated because of standardized equipment and simplified permitting. Large-capacity momentum underscores the widening application perimeter that includes warehouses, food processing, and municipal networks aiming for carbon-neutral heat.
Heat Pump Market is Segmented by Source Type (Air-Source, Water-Source, and Ground/Geothermal Source), Rated Capacity (Up To 10 KW, 10-20 KW, and More), System Design (Split System, Monobloc, and Hybrid Heat Pump), End-User (Residential, Commercial, and More), Application (Space Heating and Cooling, Water Heating, and More), and Geography. The Market Forecasts are Provided in Terms of Value (USD).
Geography Analysis
Asia-Pacific retained a commanding 38.05% portion of the heat pump market in 2025, underpinned by China's 13% domestic sales growth and its 40% share of global production capacity, which yielded 12% unit-cost declines from factory automation gains. Japan's cautious 1% volume uptick and South Korea's compressor technology leadership stabilized regional shipments, while India remained nascent because tropical ambient conditions limited efficiency advantages for traditional designs.
Europe is on a rebound path, with an 10.92% CAGR projected after a 50% sales dip in early 2024 when Germany's heating-law debate dampened consumer confidence. France committed to producing 1 million units per year domestically, and Denmark showcased flagship district-scale projects, including the Esbjerg seawater plant, as part of its fossil-free-by-2030 pledge. The United Kingdom trailed installation targets despite rich GBP 7,500 grants, underscoring the role of infrastructure and skills barriers over pure economics.
North America entered a policy-assisted growth cycle after initial softness: US year-over-year sales climbed 15% by November 2024 following the Inflation Reduction Act incentives, while Canada processed more than 13,000 subsidy applications concentrated in Atlantic provinces. Supply-chain reshoring efforts, including Mitsubishi Electric's compressor factory and the Daikin-Copeland joint venture, aim to offset projected USD 250-275 million tariff exposure by localizing critical components.
- Daikin Industries, Ltd.
- Mitsubishi Electric Corporation
- Panasonic Holdings Corporation
- Trane Technologies plc
- Carrier Global Corporation
- NIBE Industrier AB
- Glen Dimplex Group
- Viessmann Climate Solutions SE
- Stiebel Eltron GmbH & Co. KG
- Midea Group Co., Ltd.
- Guangdong Gree Electric Appliances Inc. of Zhuhai
- Haier Smart Home Co., Ltd.
- Bosch Thermotechnology GmbH (Robert Bosch GmbH)
- LG Electronics Inc.
- Lennox International Inc.
- Ariston Holding N.V. (Ariston Group)
- Samsung Electronics Co., Ltd.
- Rheem Manufacturing Company
- Johnson Controls International plc
- Viomi Technology Co., Ltd.
- A. O. Smith Corporation
- Ecoforest Geotermia S.L.
- WaterFurnace International, Inc. (NIBE Group)
- Danfoss A/S
- Vaillant GmbH
Additional Benefits:
- The market estimate (ME) sheet in Excel format
- 3 months of analyst support
TABLE OF CONTENTS
1 INTRODUCTION
- 1.1 Study Assumptions and Market Definition
- 1.2 Scope of the Study
2 RESEARCH METHODOLOGY
3 EXECUTIVE SUMMARY
4 MARKET LANDSCAPE
- 4.1 Market Overview
- 4.2 Market Drivers
- 4.2.1 Government decarbonization incentives and mandates
- 4.2.2 Electrification-driven HVAC replacement cycles
- 4.2.3 Rapid cost declines in inverter-driven compressors
- 4.2.4 Grid-interactive heat pumps enabling demand-response revenue
- 4.2.5 Cold-climate heat pump technology breakthroughs
- 4.2.6 Heat-as-a-Service business models unlocking financing
- 4.3 Market Restraints
- 4.3.1 High installation and retrofitting costs in existing buildings
- 4.3.2 Skilled installer shortage
- 4.3.3 Electrical-panel and grid-capacity constraints in older housing stock
- 4.3.4 Competitive risk from hybrid hydrogen boilers in specific countries
- 4.4 Value / Supply-Chain Analysis
- 4.5 Regulatory Landscape
- 4.6 Technological Outlook
- 4.7 Impact of Macroeconomic Factors
- 4.8 Porter's Five Forces
- 4.8.1 Bargaining Power of Suppliers
- 4.8.2 Bargaining Power of Buyers
- 4.8.3 Threat of New Entrants
- 4.8.4 Threat of Substitute Products
- 4.8.5 Degree of Competition
5 MARKET SIZE AND GROWTH FORECASTS (VALUES)
- 5.1 By Source Type
- 5.1.1 Air-Source
- 5.1.1.1 Air-to-Air
- 5.1.1.2 Air-to-Water
- 5.1.2 Water-Source
- 5.1.2.1 Surface Water
- 5.1.2.2 Open Loop
- 5.1.3 Ground / Geothermal Source
- 5.1.3.1 Closed Loop Vertical
- 5.1.3.2 Closed Loop Horizontal
- 5.1.3.3 Direct Expansion
- 5.1.1 Air-Source
- 5.2 By Rated Capacity
- 5.2.1 Up to 10 kW
- 5.2.2 10-20 kW
- 5.2.3 20-30 kW
- 5.2.4 Above 30 kW
- 5.3 By System Design
- 5.3.1 Split System
- 5.3.2 Monobloc
- 5.3.3 Hybrid Heat Pump
- 5.4 By End-User
- 5.4.1 Residential
- 5.4.2 Commercial
- 5.4.3 Industrial
- 5.4.4 Institutional
- 5.5 By Application
- 5.5.1 Space Heating and Cooling
- 5.5.2 Water Heating
- 5.5.3 District Heating
- 5.5.4 Process and Industrial Heating
- 5.6 By Geography
- 5.6.1 North America
- 5.6.1.1 United States
- 5.6.1.2 Canada
- 5.6.1.3 Mexico
- 5.6.2 South America
- 5.6.2.1 Brazil
- 5.6.2.2 Argentina
- 5.6.2.3 Rest of South America
- 5.6.3 Europe
- 5.6.3.1 Germany
- 5.6.3.2 United Kingdom
- 5.6.3.3 France
- 5.6.3.4 Italy
- 5.6.3.5 Russia
- 5.6.3.6 Rest of Europe
- 5.6.4 Asia-Pacific
- 5.6.4.1 China
- 5.6.4.2 Japan
- 5.6.4.3 South Korea
- 5.6.4.4 India
- 5.6.4.5 ASEAN
- 5.6.4.6 Rest of Asia-Pacific
- 5.6.5 Middle East and Africa
- 5.6.5.1 Middle East
- 5.6.5.1.1 Saudi Arabia
- 5.6.5.1.2 United Arab Emirates
- 5.6.5.1.3 Turkey
- 5.6.5.1.4 Rest of Middle East
- 5.6.5.2 Africa
- 5.6.5.2.1 South Africa
- 5.6.5.2.2 Nigeria
- 5.6.5.2.3 Rest of Africa
- 5.6.5.1 Middle East
- 5.6.1 North America
6 COMPETITIVE LANDSCAPE
- 6.1 Market Concentration
- 6.2 Strategic Moves
- 6.3 Market Share Analysis
- 6.4 Company Profiles (includes Global level Overview, Market level overview, Core Segments, Financials as available, Strategic Information, Market Rank/Share for key companies, Products and Services, and Recent Developments)
- 6.4.1 Daikin Industries, Ltd.
- 6.4.2 Mitsubishi Electric Corporation
- 6.4.3 Panasonic Holdings Corporation
- 6.4.4 Trane Technologies plc
- 6.4.5 Carrier Global Corporation
- 6.4.6 NIBE Industrier AB
- 6.4.7 Glen Dimplex Group
- 6.4.8 Viessmann Climate Solutions SE
- 6.4.9 Stiebel Eltron GmbH & Co. KG
- 6.4.10 Midea Group Co., Ltd.
- 6.4.11 Guangdong Gree Electric Appliances Inc. of Zhuhai
- 6.4.12 Haier Smart Home Co., Ltd.
- 6.4.13 Bosch Thermotechnology GmbH (Robert Bosch GmbH)
- 6.4.14 LG Electronics Inc.
- 6.4.15 Lennox International Inc.
- 6.4.16 Ariston Holding N.V. (Ariston Group)
- 6.4.17 Samsung Electronics Co., Ltd.
- 6.4.18 Rheem Manufacturing Company
- 6.4.19 Johnson Controls International plc
- 6.4.20 Viomi Technology Co., Ltd.
- 6.4.21 A. O. Smith Corporation
- 6.4.22 Ecoforest Geotermia S.L.
- 6.4.23 WaterFurnace International, Inc. (NIBE Group)
- 6.4.24 Danfoss A/S
- 6.4.25 Vaillant GmbH
7 MARKET OPPORTUNITIES AND FUTURE TRENDS
- 7.1 White-space and Unmet-need Assessment
 2026-2030年全球工業熱泵市場
 菸葉空氣源熱泵乾燥機市場:依菸草類型、技術類型、容量範圍、電源、運作模式、通路分類,全球預測(2026-2032年)
 全球熱泵市場規模、佔有率、趨勢和成長分析報告(2026-2034年)
 全球工業熱泵市場:預測(至2034年)-按熱源、容量、溫度範圍、技術、最終用戶和地區進行分析
 2026年全球熱泵市場報告
 熱驅動熱泵市場-全球產業規模、佔有率、趨勢、機會、預測:依產品類型、應用、技術、地區和競爭格局分類,2021-2031年空氣源熱泵市場按類型、容量、應用和分銷管道分類-2026-2032年全球預測
 日本熱泵市場報告(按額定容量、產品類型、最終用途產業和地區分類,2026-2034 年)
 熱泵市場規模、佔有率和趨勢分析報告:按技術、容量、應用、運作方式、地區和細分市場預測(2026-2033 年)
 水源熱泵市場規模、佔有率和成長分析(按安裝類型、熱泵類型、應用、系統配置、控制系統和地區分類)-2026-2033年產業預測