


 |
市場調查報告書
商品編碼
1851824
整合工作場所管理系統 (IWMS):市場佔有率分析、行業趨勢、統計數據和成長預測 (2025-2030)Integrated Workplace Management System (IWMS) - Market Share Analysis, Industry Trends & Statistics, Growth Forecasts (2025 - 2030) |
||||||
※ 本網頁內容可能與最新版本有所差異。詳細情況請與我們聯繫。
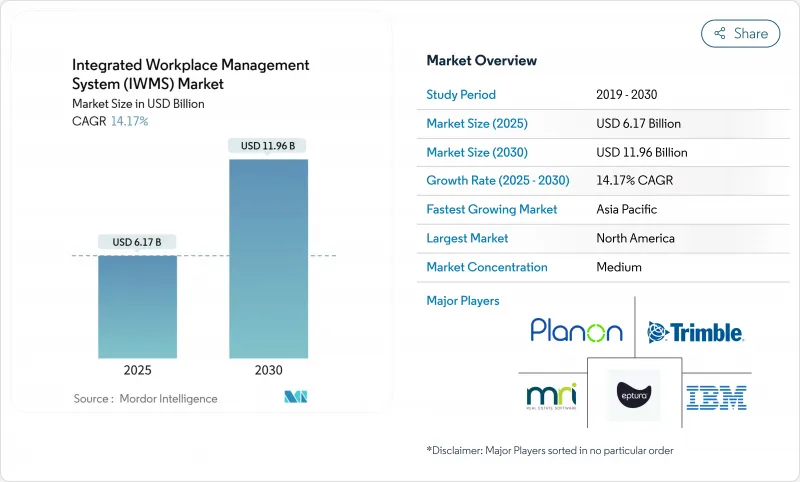
預計到 2025 年,整合工作場所管理系統市場規模將達到 61.7 億美元,到 2030 年將達到 119.6 億美元,複合年成長率為 14.17%。
這種加速發展反映出企業正在用單一平台取代分散的設施管理工具,該平台集中管理房地產、維護和永續性數據。由於遠距辦公和混合辦公模式的普及、ESG監管力度的加強以及對即時營運可視性的追求,市場需求只會不斷成長。雲端技術的採用縮短了引進週期,訂閱定價模式降低了中型企業的進入門檻。供應商正在利用人工智慧技術實現空間規劃的自動化,而監管機構則在收緊能源報告規則,使合規性成為推動整合平台發展的動力。網路安全和資料主權仍然是重中之重,因此需要建立兼顧控制和擴充性的混合架構。
全球整合工作場所管理系統 (IWMS) 市場趨勢與洞察
採用雲端優先的整合工作管理系統
如今,企業需要雲端原生平台來降低基礎設施支出,並在數週而非數月內完成部署。 SAP 報告稱,2025 年第一季雲端營收達 49.93 億歐元,其中雲端 ERP 營收年增 34%,印證了買家對訂閱交付模式的信心。與現有的人力資源和財務系統整合,可提高數據品質並加快決策速度。基於使用量的定價模式擴大了中型企業的使用範圍,這些企業過去一直覺得功能齊全的套件難以負擔。供應商也不斷推出更新,在不造成客戶停機的情況下提供新的分析功能。
透過空間最佳化節省成本
商業設施的營運成本有時甚至超過總營運成本的20%,因此,能夠減少閒置占地面積的運作分析工具正迅速普及。思科透過感測器主導的佈局重新設計,將PENN1設施的占地面積減少了25%,能源效率提高了36%。整合工作管理系統(IWMS)的儀錶板提供即時利用率視覺化,從而能夠及時做出關於整合和轉租的決策。在混合辦公環境中,動態座位分配取代了靜態的辦公桌配比,即使出勤率波動,也能維持較低的座位可用率。
IWMS領域專家短缺
如果團隊中缺乏既了解設施工作流程又了解企業軟體整合的專家,計劃就會停滯不前。同行評審的針對中小企業ERP實施的研究表明,熟練人才是成功的關鍵因素,這反映了整合工作管理系統(IWMS)面臨的挑戰。尤其是在設施管理仍以人工為主的新興市場,人才短缺會推高諮詢成本並延長實施時間。此外,由於監管或語言原因需要本地協助的採購方,本地支援的不足也會造成阻礙。
細分市場分析
到2024年,設施和空間管理市場規模將達到17億美元,佔整合工作場所管理系統市場規模的27.60%。企業將率先採用這些模組,透過減少空置率和能源浪費來實現實際的成本節約。由於國際財務報告準則第16號(IFRS 16)的合規期限臨近,物業和租賃管理也將緊隨其後。環境永續性管理雖然市場規模較小,但將引領成長,到2030年複合年成長率將達到15.90%。其強勁的成長勢頭表明,碳計量如今對董事會決策的影響與財務會計不相上下。
到2024年,專業服務收入將超過13.5億美元,反映出企業內部專業人才的缺乏。供應商提供配置、資料遷移和培訓服務,幫助客戶實現預期的投資回報。託管服務吸引了那些傾向於將營運完全外包的中型企業,從而降低了薪資和人員配置風險。例如,麥克拉倫醫療保健公司(McLaren Health Care)在採用Brightly Origin平台後,其設施資金增加了25%,案例研究充分證明了由專業合作夥伴經營該平台所帶來的益處。
到2024年,本地部署系統將佔據整合工作場所管理系統市場佔有率的51.44%。受嚴格監管的行業正在建立分層架構,透過將敏感資料置於防火牆後並在此基礎上整合雲端分析,最大限度地降低資訊外洩的風險。大型企業也充分利用現有伺服器容量,而不是急於從沉沒投資中尋求早期回報。
然而,雲端訂閱的成長速度最快,複合年成長率高達 17.40%。新加坡生產力解決方案公司等政府提供的補貼正推動中小企業轉向雲端模式,從而免去硬體採購的麻煩。供應商每月發布功能更新,讓客戶無需計劃即可享受創新功能。將雲端入口網站與本地資料湖結合的混合部署,既能讓企業擁有精細的控制權,也能受益於人工智慧工作負載的彈性處理能力。
IWMS 市場報告按提供的服務(解決方案、服務)、部署類型(雲端、本地、混合)、組織規模(大型企業、中小企業)、最終用戶垂直行業(資訊科技和通訊、銀行、金融服務和保險、醫療保健和生命科學、製造業、零售和電子商務、其他)以及地區對產業進行細分。
區域分析
預計到2024年,北美地區的營收將達到20.9億美元,佔全球營收的33.76%。先發優勢、嚴格的美國證券交易委員會(SEC)資訊揭露規則以及成熟的供應商生態系統為該地區的支出提供了支撐。該地區的企業正在將人工智慧技術應用於歷史建築訊息,以預測運轉率、預防設備故障並維持高營運指標。
歐洲的能源轉型投資金額達到17.8億美元,成長主要得益於氣候變遷法規的不斷完善,例如《企業永續發展報告指令》。設施管理團隊正在將能源計量表和碳排放儀錶板整合到綜合廢棄物管理系統(IWMS)中,以便為監管機構和投資者產生永續性審核要求的報告。淨零排放藍圖正在加速德國、荷蘭和北歐地區的維修。
亞太地區貢獻了14.9億美元的收入,預計將以15.70%的複合年成長率成為成長最快的地區。快速的都市化要求高效利用空間,而建築業的人才短缺則推動了自動化發展。日本開發人員正在其專案中部署低功耗廣域網路(LPWA)感測器網路,而新加坡則在資助智慧設施課程以彌補技能差距。印度和印尼正在採用雲端套件來完全繞過舊有系統,而中東的計劃則將整合廢棄物管理系統(IWMS)與區域冷卻和太陽能發電設施連接起來,以應對極端氣候。
其他福利:
- Excel格式的市場預測(ME)表
- 3個月的分析師支持
目錄
第1章 引言
- 研究假設和市場定義
- 調查範圍
第2章調查方法
第3章執行摘要
第4章 市場情勢
- 市場概覽
- 市場促進因素
- 採用雲端優先的整合工作管理系統
- 透過空間最佳化節省成本
- 回應 IFRS 16 和 ESG 義務
- 疫情後混合辦公模式
- CPIP轉向整合OT-IT-IoT數據
- 為職場中的碳權交易做好準備
- 市場限制
- 綜合廢棄物管理系統領域專家短缺
- 高昂的轉換成本
- 物聯網遙測的資料主權限制
- 「影子IT」資料品質不一致
- 關鍵法規結構評估
- 價值鏈分析
- 技術展望
- 波特五力模型
- 供應商的議價能力
- 買方的議價能力
- 新進入者的威脅
- 替代品的威脅
- 競爭對手之間的競爭
- 關鍵相關人員影響評估
- 主要用例和案例研究
- 宏觀經濟因素對市場的影響
- 投資分析
第5章 市場區隔
- 報價
- 解決方案
- 物業及租賃管理
- 設施和空間管理
- 資產和維護管理
- 計劃管理
- 環境永續管理
- 整合工作場所分析
- 其他解決方案
- 服務
- 專業服務
- 託管服務
- 解決方案
- 透過部署模式
- 雲
- 本地部署
- 混合
- 按組織規模
- 主要企業
- 小型企業
- 按最終用途行業分類
- 資訊科技與通訊
- 銀行、金融服務和保險
- 醫療保健和生命科學
- 製造業
- 零售與電子商務
- 政府/公共部門
- 教育
- 其他行業
- 按地區
- 北美洲
- 美國
- 加拿大
- 墨西哥
- 南美洲
- 巴西
- 阿根廷
- 其他南美洲
- 歐洲
- 英國
- 德國
- 法國
- 義大利
- 西班牙
- 北歐國家
- 其他歐洲地區
- 中東和非洲
- 中東
- 沙烏地阿拉伯
- 阿拉伯聯合大公國
- 土耳其
- 其他中東地區
- 非洲
- 南非
- 埃及
- 奈及利亞
- 其他非洲地區
- 亞太地區
- 中國
- 印度
- 日本
- 韓國
- ASEAN
- 澳洲
- 紐西蘭
- 亞太其他地區
- 北美洲
第6章 競爭情勢
- 市場集中度
- 策略趨勢
- 市佔率分析
- 公司簡介
- International Business Machines Corporation
- Planon Group BV
- MRI Software LLC
- Trimble Inc.
- Eptura Inc.
- Accruent LLC
- FM:Systems(Johnson Controls International plc)
- SAP SE
- Oracle Corporation
- ServiceNow, Inc.
- Nuvolo, Inc.
- Spacewell International NV
- Tango Analytics LLC
- iOFFICE, LP
- SpaceIQ, Inc.
- Archibus, Inc.
- Schneider Electric SE
- Causeway Technologies Limited
- AssetWorks, LLC
- OfficeSpace Software, Inc.
- Flairsoft Ltd.
第7章 市場機會與未來展望
The integrated workplace management system market was valued at USD 6.17 billion in 2025 and is forecast to reach USD 11.96 billion by 2030, advancing at a 14.17% CAGR.
The acceleration reflects enterprises replacing disconnected facility tools with single platforms that centralize real estate, maintenance, and sustainability data. Remote and hybrid work, heightened ESG scrutiny, and the push for real-time operational visibility keep demand elevated. Cloud availability shortens deployment cycles, and subscription pricing lowers entry barriers for mid-market buyers. Vendors add AI to automate space planning, while regulators tighten energy reporting rules, turning compliance into a driver for integrated platforms. Cybersecurity and data sovereignty remain priorities, prompting hybrid architectures that balance control with scalability.
Global Integrated Workplace Management System (IWMS) Market Trends and Insights
Cloud-First IWMS Adoption
Enterprises now mandate cloud-native platforms to cut infrastructure spending and deploy in weeks rather than months. SAP recorded EUR 4.993 billion cloud revenue in Q1 2025, with cloud ERP rising 34% year over year, underscoring buyer confidence in subscription delivery models. Integration with existing HR and finance systems improves data quality and speeds decision-making. Usage-based pricing broadens access for mid-sized firms that once found comprehensive suits unaffordable. Vendors also embed continuous updates that deliver new analytics features without customer downtime.
Cost-Out Through Space Optimization
Commercial property expenses can exceed 20% of operating costs, so occupancy analytics tools that reduce unused floorspace gain rapid traction. Cisco cut floor area by 25% at its PENN1 facility while improving energy efficiency by 36% through sensor-driven layout redesign. IWMS dashboards visualize real-time utilization, allowing timely consolidation or subletting decisions. In hybrid settings, dynamic seating assignments replace static desk ratios, keeping vacancies low even with variable attendance.
Shortage of IWMS Domain Expertise
Projects stall when teams lack professionals who understand both facility workflows and enterprise software integration. A peer-reviewed study on SME ERP rollouts cites skilled manpower as a critical success factor, mirroring IWMS challenges. Scarcity inflates consulting fees and elongates deployments, particularly in emerging economies where facility management remains manual. Limited local support also deters buyers that require on-site assistance for regulatory or language reasons.
Other drivers and restraints analyzed in the detailed report include:
- Compliance With IFRS 16 and ESG Mandates
- Post-Pandemic Hybrid Work Programs
- High Transformational Switching Costs
For complete list of drivers and restraints, kindly check the Table Of Contents.
Segment Analysis
Facilities and Space Management contributed USD 1.70 billion in 2024, equal to 27.60% of the integrated workplace management system market size. Firms adopt these modules first because they deliver visible savings by reducing vacancy and trimming energy waste. Real-estate and lease management follows closely as IFRS 16 compliance deadlines tighten. Environmental sustainability management, although smaller, leads growth at 15.90% CAGR to 2030. Its momentum underscores how carbon accounting now influences boardroom decisions as much as financial accounting.
Professional services revenue surpassed USD 1.35 billion in 2024, reflecting the scarcity of in-house expertise. Vendors provide configuration, data migration, and training, ensuring customers achieve intended return on investment. Managed services attract mid-market firms that prefer to outsource operations entirely, lowering payroll and retention risks. Case studies such as McLaren Health Care, which raised facilities funding by 25% after adopting Brightly Origin, illustrate the gains realized when expert partners run the platform.
On-premise installations commanded 51.44% of the integrated workplace management system market share in 2024. Highly regulated industries keep sensitive data within their firewalls and integrate cloud analytics on top, creating layered architectures that minimize breach exposure. Large enterprises also leverage existing server capacity instead of retiring sunk investments early.
Cloud subscriptions, however, register the quickest climb at 17.40% CAGR. Government grants such as Singapore's Productivity Solutions push SMEs toward cloud models that need no hardware outlay. Vendors issue feature updates monthly, letting clients consume innovations without upgrade projects. Hybrid deployment blends cloud portals with on-premise data lakes, giving organizations granular control while benefiting from elastic processing for AI workloads.
The IWMS Market Report Segments the Industry Into by Offering (Solutions, and Services), Deployment (Cloud, On-Premise, and Hybrid), Organization Size (Large Enterprise, and Small and Medium Enterprises), End-Use Industry (Information Technology and Telecommunications, Banking, Financial Services and Insurance, Healthcare and Life Sciences, Manufacturing, Retail and E-Commerce, and More), and Geography.
Geography Analysis
North America generated USD 2.09 billion in 2024, or 33.76% of global revenue. Early mover advantage, stringent SEC disclosure rules, and mature vendor ecosystems sustain spending. Enterprises there increasingly layer AI over historical building information to predict occupancy and pre-empt equipment failures, keeping operational metrics high.
Europe recorded USD 1.78 billion, with growth tied to expanded climate regulations such as the Corporate Sustainability Reporting Directive. Facilities teams integrate energy meters and carbon dashboards into IWMS to produce audit-ready reports for authorities and investors. Uptake is notable in Germany, the Netherlands, and the Nordics, where net-zero roadmaps accelerate retrofits.
Asia-Pacific contributed USD 1.49 billion yet will post the fastest 15.70% CAGR. Rapid urbanisation necessitates efficient space use, while talent shortages in building trades push automation. Japanese developers deploy LPWA sensor networks across portfolios, and Singapore sponsors smart facilities curricula to close skill gaps. India and Indonesia adopt cloud suites to bypass legacy systems altogether, and Middle East projects link IWMS with district cooling and photovoltaic assets to manage extreme climates.
- International Business Machines Corporation
- Planon Group B.V.
- MRI Software LLC
- Trimble Inc.
- Eptura Inc.
- Accruent LLC
- FM:Systems (Johnson Controls International plc)
- SAP SE
- Oracle Corporation
- ServiceNow, Inc.
- Nuvolo, Inc.
- Spacewell International NV
- Tango Analytics LLC
- iOFFICE, LP
- SpaceIQ, Inc.
- Archibus, Inc.
- Schneider Electric SE
- Causeway Technologies Limited
- AssetWorks, LLC
- OfficeSpace Software, Inc.
- Flairsoft Ltd.
Additional Benefits:
- The market estimate (ME) sheet in Excel format
- 3 months of analyst support
TABLE OF CONTENTS
1 INTRODUCTION
- 1.1 Study Assumptions and Market Definition
- 1.2 Scope of the Study
2 RESEARCH METHODOLOGY
3 EXECUTIVE SUMMARY
4 MARKET LANDSCAPE
- 4.1 Market Overview
- 4.2 Market Drivers
- 4.2.1 Cloud-first IWMS adoption
- 4.2.2 Cost-out through space optimization
- 4.2.3 Compliance with IFRS 16 and ESG mandates
- 4.2.4 Post-pandemic hybrid-work programs
- 4.2.5 CPIP shift to unify OT-IT-IoT data
- 4.2.6 Workplace carbon-credit trading readiness
- 4.3 Market Restraints
- 4.3.1 Shortage of IWMS domain expertise
- 4.3.2 High transformational switching costs
- 4.3.3 Data-sovereignty limits for IoT telemetry
- 4.3.4 "Shadow-IT" data-quality inconsistencies
- 4.4 Evaluation of Critical Regulatory Framework
- 4.5 Value Chain Analysis
- 4.6 Technological Outlook
- 4.7 Porter's Five Forces
- 4.7.1 Bargaining Power of Suppliers
- 4.7.2 Bargaining Power of Buyers
- 4.7.3 Threat of New Entrants
- 4.7.4 Threat of Substitutes
- 4.7.5 Competitive Rivalry
- 4.8 Impact Assessment of Key Stakeholders
- 4.9 Key Use Cases and Case Studies
- 4.10 Impact on Macroeconomic Factors of the Market
- 4.11 Investment Analysis
5 MARKET SEGMENTATION
- 5.1 By Offering
- 5.1.1 Solutions
- 5.1.1.1 Real Estate and Lease Management
- 5.1.1.2 Facilities and Space Management
- 5.1.1.3 Asset and Maintenance Management
- 5.1.1.4 Project Management
- 5.1.1.5 Environmental Sustainability Management
- 5.1.1.6 Integrated Workplace Analytics
- 5.1.1.7 Other Solutions
- 5.1.2 Services
- 5.1.2.1 Professional Services
- 5.1.2.2 Managed Services
- 5.1.1 Solutions
- 5.2 By Deployment Mode
- 5.2.1 Cloud
- 5.2.2 On-premise
- 5.2.3 Hybrid
- 5.3 By Organization Size
- 5.3.1 Large Enterprises
- 5.3.2 Small and Medium Enterprises
- 5.4 By End-use Industry
- 5.4.1 Information Technology and Telecommunications
- 5.4.2 Banking, Financial Services and Insurance
- 5.4.3 Healthcare and Life Sciences
- 5.4.4 Manufacturing
- 5.4.5 Retail and E-commerce
- 5.4.6 Government and Public Sector
- 5.4.7 Education
- 5.4.8 Other Industries
- 5.5 By Geography
- 5.5.1 North America
- 5.5.1.1 United States
- 5.5.1.2 Canada
- 5.5.1.3 Mexico
- 5.5.2 South America
- 5.5.2.1 Brazil
- 5.5.2.2 Argentina
- 5.5.2.3 Rest of South America
- 5.5.3 Europe
- 5.5.3.1 United Kingdom
- 5.5.3.2 Germany
- 5.5.3.3 France
- 5.5.3.4 Italy
- 5.5.3.5 Spain
- 5.5.3.6 Nordics
- 5.5.3.7 Rest of Europe
- 5.5.4 Middle East and Africa
- 5.5.4.1 Middle East
- 5.5.4.1.1 Saudi Arabia
- 5.5.4.1.2 United Arab Emirates
- 5.5.4.1.3 Turkey
- 5.5.4.1.4 Rest of Middle East
- 5.5.4.2 Africa
- 5.5.4.2.1 South Africa
- 5.5.4.2.2 Egypt
- 5.5.4.2.3 Nigeria
- 5.5.4.2.4 Rest of Africa
- 5.5.5 Asia-Pacific
- 5.5.5.1 China
- 5.5.5.2 India
- 5.5.5.3 Japan
- 5.5.5.4 South Korea
- 5.5.5.5 ASEAN
- 5.5.5.6 Australia
- 5.5.5.7 New Zealand
- 5.5.5.8 Rest of Asia-Pacific
- 5.5.1 North America
6 COMPETITIVE LANDSCAPE
- 6.1 Market Concentration
- 6.2 Strategic Moves
- 6.3 Market Share Analysis
- 6.4 Company Profiles (includes Global level Overview, Market level overview, Core Segments, Financials as available, Strategic Information, Market Rank/Share for key companies, Products and Services, and Recent Developments)
- 6.4.1 International Business Machines Corporation
- 6.4.2 Planon Group B.V.
- 6.4.3 MRI Software LLC
- 6.4.4 Trimble Inc.
- 6.4.5 Eptura Inc.
- 6.4.6 Accruent LLC
- 6.4.7 FM:Systems (Johnson Controls International plc)
- 6.4.8 SAP SE
- 6.4.9 Oracle Corporation
- 6.4.10 ServiceNow, Inc.
- 6.4.11 Nuvolo, Inc.
- 6.4.12 Spacewell International NV
- 6.4.13 Tango Analytics LLC
- 6.4.14 iOFFICE, LP
- 6.4.15 SpaceIQ, Inc.
- 6.4.16 Archibus, Inc.
- 6.4.17 Schneider Electric SE
- 6.4.18 Causeway Technologies Limited
- 6.4.19 AssetWorks, LLC
- 6.4.20 OfficeSpace Software, Inc.
- 6.4.21 Flairsoft Ltd.
7 MARKET OPPORTUNITIES AND FUTURE OUTLOOK
- 7.1 White-space and Unmet-need Assessment
 整合工作場所管理系統市場-2026-2032年全球市場預測
 2026年全球職場人工智慧(AI)市場報告
 融合工作站市場分析及預測(至2035年):依類型、產品類型、服務、技術、組件、應用、部署類型、最終用戶及功能分類
 全球整合工作場所管理系統(IWMS)市場規模、佔有率、趨勢和成長分析報告(2026-2034年)
 整合工作場所管理系統市場規模、佔有率和成長分析(按產品類型、部署類型、企業規模、最終用途和地區分類)-2026-2033年產業預測
 2032 年神經包容性穿戴裝置市場預測:按裝置類型、整合模式、技術、應用、最終用戶和地區進行的全球分析2032 年神經包容性職場市場預測:按產品、軟體類型、神經多樣性人群、就業生命週期階段、組織規模、最終用戶和地區進行的全球分析
 整合職場管理系統市場報告:2030 年趨勢、預測與競爭分析