


 |
市場調查報告書
商品編碼
1851795
供應商管理軟體:市場佔有率分析、產業趨勢、統計數據和成長預測(2025-2030 年)Vendor Management Software - Market Share Analysis, Industry Trends & Statistics, Growth Forecasts (2025 - 2030) |
||||||
※ 本網頁內容可能與最新版本有所差異。詳細情況請與我們聯繫。
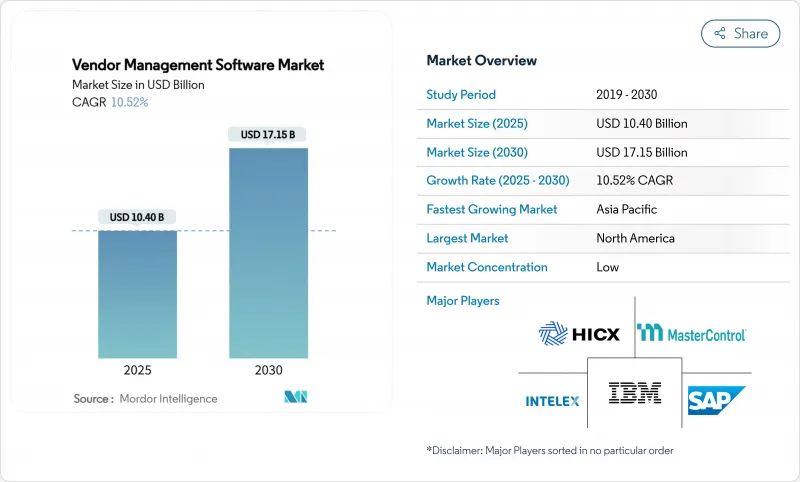
預計到 2025 年,供應商管理軟體市場規模將達到 104 億美元,年複合成長率為 10.52%,到 2030 年將達到 171.5 億美元。
強勁的發展勢頭反映出,隨著供應鏈複雜性、材料成本上漲和監管審查的加劇,企業渴望實現供應商關係的數位化。雲端原生部署、人工智慧主導的分析和內建合規性監控如今已成為新採購的基準,整合式採購到付款套件正逐步取代各種獨立工具。由於人工監控無法擴展到數百家第三方供應商,因此能夠簡化供應商入駐流程、集中管理供應商資料並展現預測性洞察的平台供應商更具優勢。目前市場競爭格局較為均衡,現有ERP供應商、業界領先的專業供應商和人工智慧原生解決方案參與企業共用其中。
全球供應商管理軟體市場趨勢與洞察
需要盡可能降低管理成本
供應商重複性任務的自動化降低了採購成本,使團隊能夠專注於策略採購。 Wefunder 透過 CloudEagle 的平台實現合約續約自動化後,每年節省了 1350 小時,終身成本降低了 416,000 美元。 BetterCloud 保證 3 倍的投資報酬率。隨著通貨膨脹擠壓淨利率,外帶成本的誘因正在加速各行業的採用。
雲端運算的快速普及
雲端原生平台縮短了引進週期,降低了資本支出,並提供了基於交易費用的彈性擴展能力。 Choice Hotels International 在運作Finout 的 SaaS 環境後,立即實現了 98.8% 的成本分配準確率。即時協作、基於 API 的 ERP 連接以及自動化安全補丁,使得雲端成為首選,尤其是在 IT 人才短缺的地區。
安裝和維護成本高昂
Conexis VMS 指出,整合、客製化和資料遷移可能會使初始預算翻倍,因此小型企業需要分階段推廣。
細分市場分析
預計到2024年,雲端採用將佔供應商管理軟體市場的63.2%,並在2030年之前以12.9%的複合年成長率成長。雲端採用之所以得到廣泛認可,是因為其前期成本更低、價值實現速度更快,並且能夠推送即時更新以保持安全控制的有效性。 Finout在Choice Hotels的成功案例表明,企業期望能夠快速獲得回報。相較之下,目前本地部署模式主要吸引那些對資料敏感且受主權機構監管的組織。整合的工作負載和人工智慧運算需求使得成本效益比向雲端傾斜。混合部署方案也存在,它利用SaaS協作和分析層,同時將關鍵資料保留在本地。訂閱定價模式會根據交易處理能力進行擴展,這進一步強化了市場動態。
第二代SaaS套件還整合了人工智慧引擎,用於預測供應商風險、推薦成本節約方案並自動收集合規性證據。這些功能依賴雲端的彈性,允許使用者配置自訂實例。升級流程也實現了自動化,使IT團隊能夠專注於策略資料管理,而不是日常的修補程式維護。因此,雲端在不斷發展的供應商管理軟體市場中繼續發揮關鍵作用。
到2024年,製造業將佔總營收的37.3%,反映出多層級供應鏈對品質、交貨時間和ESG指標的精細化可視性要求。江森自控部署的LeanDNA展示了工廠網路如何從同步的零件、供應商和庫存資料中獲益。原料成本上漲和地緣政治事件正迫使生產者實現採購多元化。零售業雖然規模較小,但其複合年成長率將達到11.2%,成為成長最快的行業,這主要得益於全通路的成長、自有品牌的擴張以及產品組合與消費者需求的匹配需求。
隨著監管機構對金融科技合作的審查日益嚴格,金融服務業採用金融科技的速度正在加快。根據Ncontracts的數據顯示,73%的金融機構管理超過300家供應商,但其供應商風險部門的員工人數卻只有兩人或更少。醫療服務提供者將HIPAA合規監管放在首位。 Med-Equip在美國實施的Vanta系統使審核準備減少了50%。各國政府正逐步推動採購現代化,透過BidNet Direct等解決方案提高透明度並促進供應商多元化。
供應商管理軟體市場按部署方式(雲端、本地部署)、最終用戶行業(零售、銀行、金融服務和保險、製造業及其他)、組織規模(大型企業、中小企業)、組件/模組(供應商入駐和資訊管理、供應商風險和合規管理及其他)以及地區進行細分。市場預測以美元(USD)計價。
區域分析
北美地區預計到2024年將保持27.9%的市場佔有率,這主要得益於數位化採購的早期成熟、強大的雲端基礎設施以及日益嚴格的銀行和醫療保健監管,這些監管措施將供應商風險工作流程製度化。特別是金融服務業,正在採用各種平台來應對美國貨幣監理署(OCC)和消費者金融保護局(CFPB)的指導意見。本土SaaS供應商的持續創新維持了產品更新換代的週期,進一步鞏固了該地區的領先地位。
亞太地區預計將成為全球成長引擎,預計到2030年將以13.2%的複合年成長率成長。政府支持的數位化項目、製造業出口的激增以及網路安全事件的增加,正促使企業專注於第三方監控。超過70%的新加坡企業報告其供應鏈中存在網路安全漏洞,其中90%的企業增加了風險管理預算。佔印度出口總額48%的中小企業依賴現代化的供應商入口網站來維持在全球競爭中的領先地位。中國在打擊強迫勞動方面的合規性正在推動對用於追蹤二級供應商的篩檢工具的需求。
在環境、社會及公司治理 (ESG) 和盡職調查要求(包括自動化資訊揭露)的推動下,歐洲市場持續穩定成長。各公司正在部署平台,以追蹤其供應鏈中的範圍 3排放和道德採購認證。中東和非洲以及南美洲在絕對成長上落後於歐洲,但隨著雲端連接性的改善和公共部門現代化資金的湧入,這些地區的採用率正在提高。整體而言,各全部區域的供應商管理軟體市場與電子採購的成熟度和監管要求密切相關,這為未來的應用指明了清晰的藍圖。
其他福利:
- Excel格式的市場預測(ME)表
- 3個月的分析師支持
目錄
第1章 引言
- 研究假設和市場定義
- 調查範圍
第2章調查方法
第3章執行摘要
第4章 市場情勢
- 市場概覽
- 市場促進因素
- 降低管理成本
- 雲端採用率快速成長
- 強調第三方風險和合規性的法規
- 全球化、多層級供應鏈的複雜性
- 人工智慧驅動的供應商風險預測評分
- 強制性ESG和範圍3透明度
- 市場限制
- 安裝和維護成本高昂
- 資料安全和隱私問題
- 與傳統ERP套件整合的複雜性
- 供應商風險人才短缺
- 供應鏈分析
- 監管環境
- 技術展望
- 波特五力模型
- 供應商的議價能力
- 買方的議價能力
- 新進入者的威脅
- 替代品的威脅
- 競爭對手之間的競爭
- 評估市場的宏觀經濟因素
第5章 市場規模與成長預測
- 透過部署
- 雲
- 本地部署
- 按最終用戶行業分類
- 零售
- BFSI
- 製造業
- 資訊科技/通訊
- 衛生保健
- 政府/公共部門
- 其他行業
- 按組織規模
- 主要企業
- 中小企業
- 按組件/模組
- 供應商入駐及資訊管理
- 供應商風險與合規管理
- 合約與績效管理
- 發票和付款管理
- 分析與報告
- 其他模組
- 按地區
- 北美洲
- 美國
- 加拿大
- 墨西哥
- 南美洲
- 巴西
- 阿根廷
- 其他南美洲
- 歐洲
- 德國
- 英國
- 法國
- 義大利
- 西班牙
- 其他歐洲地區
- 亞太地區
- 中國
- 日本
- 印度
- 韓國
- 澳洲
- 東南亞
- 亞太其他地區
- 中東和非洲
- 中東
- 沙烏地阿拉伯
- 阿拉伯聯合大公國
- 土耳其
- 其他中東地區
- 非洲
- 南非
- 奈及利亞
- 埃及
- 其他非洲地區
- 北美洲
第6章 競爭情勢
- 市場集中度
- 策略趨勢
- 市佔率分析
- 公司簡介
- IBM Corporation
- SAP SE
- Coupa Software Inc.
- MasterControl, Inc.
- Intelex Technologies Inc.
- HICX Solutions
- Gatekeeper
- MetricStream Inc.
- Ncontracts LLC
- LogicManager Inc.
- SalesWarp
- Quantivate LLC
- Ivalua
- Jaggaer
- GEP Worldwide
- Oracle Corporation
- Workday Inc.
- Beeline
- Precoro
- Zycus
第7章 市場機會與未來展望
The vendor management software market size reached USD 10.40 billion in 2025 and is forecast to post a 10.52% CAGR, lifting value to USD 17.15 billion by 2030.
Strong momentum reflects enterprises' need to digitize supplier relationships as supply-chain complexity, material-cost inflation, and regulatory scrutiny converge. Cloud-native deployment, AI-driven analytics, and embedded compliance monitoring now set the baseline for new purchases, while integrated source-to-pay suites are steadily replacing point tools. Platform vendors that streamline onboarding, centralize supplier data, and surface predictive insights win preference because manual oversight cannot scale across hundreds of third parties. Competitive conditions remain moderate; established ERP providers, best-of-breed specialists, and AI-native entrants share the field, creating ample scope for niche differentiation without any single firm dominating.
Global Vendor Management Software Market Trends and Insights
Need to Minimize Administrative Costs
Automating repetitive supplier tasks reduces procurement overhead and frees teams for strategic sourcing. Wefunder saved 1,350 hours annually and USD 416,000 in lifetime costs after automating contract renewals through CloudEagle's platform. Similar deployments typically cut processing expenses by 20-30% within year one, a result BetterCloud formalizes through its 3x ROI guarantee. As inflation narrows margins, the cost-take-out motive accelerates adoption across industries.
Rapid Adoption of Cloud Deployment
Cloud-native platforms shorten implementation cycles, lower capital outlay, and offer elastic scalability that aligns fees with transaction volume. Choice Hotels International achieved 98.8% accurate cost allocation soon after going live on Finout's SaaS environment. Real-time collaboration, API-based ERP connectivity, and automatic security patching turn cloud into the default option, especially where IT talent is scarce.
High Implementation and Maintenance Costs
Conexis VMS notes that integration, customization, and data migration can double initial budgets, pushing small firms toward phased rollouts.Annual operational spend covers software development, support, and cybersecurity, yet return on investment typically arrives within 18 months as automated workflows unlock savings.
Other drivers and restraints analyzed in the detailed report include:
- Regulatory Emphasis on Third-Party Risk Compliance
- Globalized, Multi-Tier Supply-Chain Complexity
- Integration Complexity with Legacy ERP Suites
For complete list of drivers and restraints, kindly check the Table Of Contents.
Segment Analysis
Cloud deployment captured 63.2% of the vendor management software market in 2024 and is forecast to expand at a 12.9% CAGR to 2030. Broad acceptance follows lower upfront spend, faster time-to-value, and the ability to push real-time updates that keep security controls current. Finout's success at Choice Hotels illustrates the quick wins enterprises expect. In contrast, on-premises models now appeal mainly to organizations with sensitive sovereignty mandates. Integration workloads and AI compute requirements tip the cost-benefit equation further toward cloud. Hybrid paths persist, letting firms retain critical data in-house while exploiting SaaS collaboration and analytics layers. The vendor management software market continues to shift budgets accordingly, a dynamic reinforced by subscription pricing that scales with transaction throughput.
Second-generation SaaS suites also bundle AI engines that predict supplier risk, recommend cost savings, and automate compliance evidence gathering. These capabilities rely on cloud elasticity, encouraging users to sunset bespoke instances. As upgrades arrive automatically, IT teams redirect effort toward strategic data stewardship instead of routine patching. Consequently, cloud remains the anchor as the vendor management software market advances.
Manufacturing held 37.3% of 2024 revenues, reflecting multi-tier supply chains that demand granular visibility into quality, delivery, and ESG metrics. LeanDNA's rollout at Johnson Controls shows how plant networks benefit from synchronized part, supplier, and inventory data. Inflationary raw-material swings and geopolitical events push producers to diversify sourcing, raising onboarding volumes and reinforcing platform necessity. Retail, while smaller, posts the fastest 11.2% CAGR on the back of omnichannel growth, private-label expansion, and the need to align assortments with consumer demand.
Financial-services uptake accelerates as regulators scrutinize fintech collaborations. Ncontracts found 73% of institutions staffing vendor risk functions with two or fewer employees even while managing 300+ vendors. Healthcare providers prioritize HIPAA-aligned oversight; Vanta's deployment at US Med-Equip reduced audit prep by 50%. Governments gradually modernize procurement to heighten transparency and supplier diversity, aided by solutions such as BidNet Direct.
Vendor Management Software Market is Segmented by Deployment (Cloud, On-Premises), End-User Industry (Retail, BFSI, Manufacturing, and More), Organization Size (Large Enterprises, Smes), Component / Module (Vendor Onboarding and Information Management, Vendor Risk and Compliance Management, and More), and by Geography. The Market Forecasts are Provided in Terms of Value (USD).
Geography Analysis
North America retained 27.9% share in 2024 owing to early digital procurement maturity, deep cloud infrastructure, and stringent banking and healthcare regulations that institutionalize vendor-risk workflows. Financial services, in particular, adopt platforms to navigate OCC and CFPB guidance. Continuous innovation from domestic SaaS vendors sustains refresh cycles, further anchoring the region's lead.
Asia-Pacific rises as the growth engine with a 13.2% CAGR through 2030. Government-backed digitization programs, burgeoning manufacturing exports, and increasing cyber incidents push organisations to professionalize third-party oversight. Singaporean firms reported over 70% supply-chain cyber breaches, spurring 90% of them to raise risk-management budgets. India's MSMEs contribute 48% of national exports and rely on modern vendor portals to compete globally. China's forced-labor compliance drives demand for screening tools that trace sub-tier suppliers.
Europe maintains steady growth as ESG and due-diligence directives necessitate automated disclosures. Firms deploy platforms to capture Scope-3 emissions and ethical-sourcing attestations across supply chains. Middle East and Africa along with South America trail in absolute value but display rising adoption as cloud connectivity improves and public-sector modernization funds flow. Across regions, the vendor management software market demonstrates strong correlation to e-procurement maturity and regulatory mandates, setting a clear roadmap for future penetration.
- IBM Corporation
- SAP SE
- Coupa Software Inc.
- MasterControl, Inc.
- Intelex Technologies Inc.
- HICX Solutions
- Gatekeeper
- MetricStream Inc.
- Ncontracts LLC
- LogicManager Inc.
- SalesWarp
- Quantivate LLC
- Ivalua
- Jaggaer
- GEP Worldwide
- Oracle Corporation
- Workday Inc.
- Beeline
- Precoro
- Zycus
Additional Benefits:
- The market estimate (ME) sheet in Excel format
- 3 months of analyst support
TABLE OF CONTENTS
1 INTRODUCTION
- 1.1 Study Assumptions and Market Definition
- 1.2 Scope of the Study
2 RESEARCH METHODOLOGY
3 EXECUTIVE SUMMARY
4 MARKET LANDSCAPE
- 4.1 Market Overview
- 4.2 Market Drivers
- 4.2.1 Need to minimize administrative costs
- 4.2.2 Rapid adoption of cloud deployment
- 4.2.3 Regulatory emphasis on third-party risk compliance
- 4.2.4 Globalized, multi-tier supply chains complexity
- 4.2.5 AI-driven predictive vendor risk scoring
- 4.2.6 ESG and Scope-3 transparency mandates
- 4.3 Market Restraints
- 4.3.1 High implementation and maintenance costs
- 4.3.2 Data-security and privacy concerns
- 4.3.3 Integration complexity with legacy ERP suites
- 4.3.4 Shortage of vendor-risk talent
- 4.4 Supply-Chain Analysis
- 4.5 Regulatory Landscape
- 4.6 Technological Outlook
- 4.7 Porter's Five Forces
- 4.7.1 Bargaining Power of Suppliers
- 4.7.2 Bargaining Power of Buyers
- 4.7.3 Threat of New Entrants
- 4.7.4 Threat of Substitutes
- 4.7.5 Intensity of Competitive Rivalry
- 4.8 Assesment of Macroeconomic Factors on the market
5 MARKET SIZE AND GROWTH FORECASTS (VALUE)
- 5.1 By Deployment
- 5.1.1 Cloud
- 5.1.2 On-premise
- 5.2 By End-user Industry
- 5.2.1 Retail
- 5.2.2 BFSI
- 5.2.3 Manufacturing
- 5.2.4 IT and Telecommunications
- 5.2.5 Healthcare
- 5.2.6 Government and Public Sector
- 5.2.7 Other Industries
- 5.3 By Organization Size
- 5.3.1 Large Enterprises
- 5.3.2 Small and Medium Enterprises (SMEs)
- 5.4 By Component / Module
- 5.4.1 Vendor Onboarding and Information Management
- 5.4.2 Vendor Risk and Compliance Management
- 5.4.3 Contract and Performance Management
- 5.4.4 Invoice and Payment Management
- 5.4.5 Analytics and Reporting
- 5.4.6 Other Modules
- 5.5 By Geography
- 5.5.1 North America
- 5.5.1.1 United States
- 5.5.1.2 Canada
- 5.5.1.3 Mexico
- 5.5.2 South America
- 5.5.2.1 Brazil
- 5.5.2.2 Argentina
- 5.5.2.3 Rest of South America
- 5.5.3 Europe
- 5.5.3.1 Germany
- 5.5.3.2 United Kingdom
- 5.5.3.3 France
- 5.5.3.4 Italy
- 5.5.3.5 Spain
- 5.5.3.6 Rest of Europe
- 5.5.4 Asia-Pacific
- 5.5.4.1 China
- 5.5.4.2 Japan
- 5.5.4.3 India
- 5.5.4.4 South Korea
- 5.5.4.5 Australia
- 5.5.4.6 Southeast Asia
- 5.5.4.7 Rest of Asia-Pacific
- 5.5.5 Middle East and Africa
- 5.5.5.1 Middle East
- 5.5.5.1.1 Saudi Arabia
- 5.5.5.1.2 United Arab Emirates
- 5.5.5.1.3 Turkey
- 5.5.5.1.4 Rest of Middle East
- 5.5.5.2 Africa
- 5.5.5.2.1 South Africa
- 5.5.5.2.2 Nigeria
- 5.5.5.2.3 Egypt
- 5.5.5.2.4 Rest of Africa
- 5.5.1 North America
6 COMPETITIVE LANDSCAPE
- 6.1 Market Concentration
- 6.2 Strategic Moves
- 6.3 Market Share Analysis
- 6.4 Company Profiles (includes Global level Overview, Market level overview, Core Segments, Financials as available, Strategic Information, Market Rank/Share for key companies, Products and Services, and Recent Developments)
- 6.4.1 IBM Corporation
- 6.4.2 SAP SE
- 6.4.3 Coupa Software Inc.
- 6.4.4 MasterControl, Inc.
- 6.4.5 Intelex Technologies Inc.
- 6.4.6 HICX Solutions
- 6.4.7 Gatekeeper
- 6.4.8 MetricStream Inc.
- 6.4.9 Ncontracts LLC
- 6.4.10 LogicManager Inc.
- 6.4.11 SalesWarp
- 6.4.12 Quantivate LLC
- 6.4.13 Ivalua
- 6.4.14 Jaggaer
- 6.4.15 GEP Worldwide
- 6.4.16 Oracle Corporation
- 6.4.17 Workday Inc.
- 6.4.18 Beeline
- 6.4.19 Precoro
- 6.4.20 Zycus
7 MARKET OPPORTUNITIES AND FUTURE OUTLOOK
- 7.1 White-space and Unmet-Need Assessment


