


 |
市場調查報告書
商品編碼
1851793
Dark Analytics:市場佔有率分析、產業趨勢、統計數據和成長預測(2025-2030 年)Dark Analytics - Market Share Analysis, Industry Trends & Statistics, Growth Forecasts (2025 - 2030) |
||||||
※ 本網頁內容可能與最新版本有所差異。詳細情況請與我們聯繫。
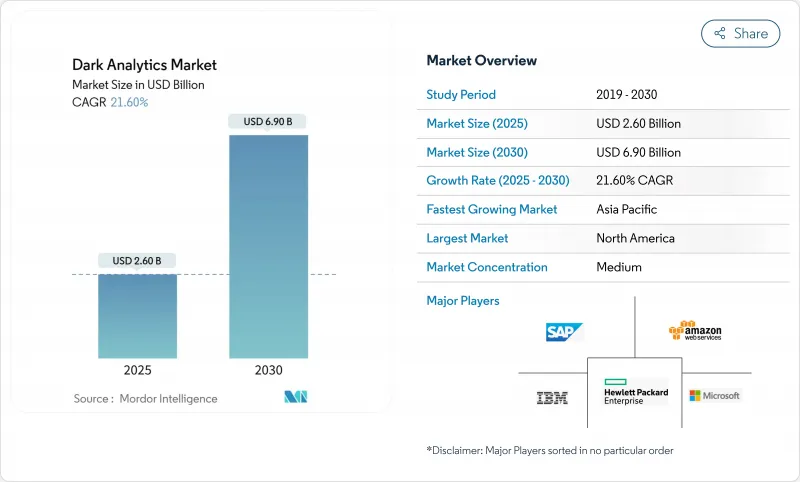
預計暗分析市場將在 2025 年達到 26 億美元,在 2030 年達到 69 億美元,年複合成長率為 21.6%。
這一成長反映出企業逐漸意識到,近 80% 的企業資料仍處於非結構化狀態,因此傳統分析系統無法取得這些資訊。人工智慧、機器學習和雲端原生平台的結合,可以將這些隱藏的資料海轉化為即時營運智慧。物聯網 (IoT) 設備的快速普及、雲端儲存成本的下降以及日益嚴格的日誌保留法規,進一步加速了對暗資料處理的需求。競爭格局正在向那些整合大規模語言模型、向量搜尋和合成資料生成的服務提供者轉變,這些技術的結合能夠加快模型訓練速度並增強隱私控制。
全球暗分析市場趨勢與洞察
引入人工智慧/機器學習優先的安全分析
以安全為中心的架構正在重塑暗分析市場,91%的美國銀行已採用人工智慧進行詐欺偵測,預計到2027年可減少400億美元的損失。首席資訊安全安全長表示,對抗性人工智慧帶來的高階威脅使得自主響應至關重要,78%的首席資訊安全長承認這對其防禦態勢產生了重大影響。金融機構正透過部署OpenAI的MongoDB向量搜尋整合等方案來展現這一轉變,該整合支援對結構化和非結構化交易流進行即時分析。雖然大型語言模型目前能夠解讀複雜的安全日誌,但影子人工智慧的興起(72%的生成式人工智慧活動發生在正式監管之外)帶來了新的風險,而這些風險只有透過複雜的監控才能應對。
物聯網數據呈指數級成長
物聯網設備正以 40% 的複合年成長率 (CAGR) 產生Zetta位元組)的非結構化數據,從根本上重塑儲存和分析的經濟格局。製造商正透過利用這些「暗數據」獲得顯著收益:捷豹路虎透過將圖分析應用於即時感測器數據,將供應鏈查詢時間從三週縮短至 45 分鐘。到 2025 年,75% 的企業產生資料將在傳統資料中心之外進行處理,這一趨勢正在推動邊緣運算的普及。邊緣運算與輕量級人工智慧結合,能夠在自主工業機械和互聯醫療設備等關鍵任務環境中實現毫秒模式識別。
數據工程和資料科學技能差距
到2025年,58%的資料中心營運商將面臨工程職位空缺,這將對暗分析市場構成瓶頸。現代計劃需要涵蓋分散式計算、領域知識和機器學習操作等多學科技能。亞太地區的快速數位化推高了稀缺專家的薪資,使中小企業處於不利地位。低程式碼框架透過簡化管道創建緩解了部分壓力,但多模態推理等高階用例仍然需要熟練的專業人員。許多公司選擇託管平台來彌補這一缺口,但這可能會帶來集中風險並限制客製化靈活性。
細分市場分析
預測性分析正以28.5%的複合年成長率快速成長,印證了決策方式正從事後分析轉向自動化編配。預測方法能夠提供機率預測以指導規劃週期,預計到2024年,其在暗分析市場中的佔有率將達到43%,繼續保持領先地位。如果目前的成長動能持續下去,到2030年,由預測引擎驅動的暗分析市場規模可望達到23億美元。自然語言疊加技術使用戶能夠以對話形式提出「假設性」問題,模型則會給出排序後的建議。製造商正在積極擁抱這項變革,建立能夠模擬整個供應鏈的數位孿生模型,使員工能夠在不中斷生產的情況下測試各種調整方案。
說明和診斷性技術仍然至關重要,因為它們能夠揭示潛在模式和根本原因,從而實現更高層次的最佳化。即時連接器將營運技術資料與企業資源規劃資料流融合,增強了說明儀錶板的功能,並拓寬了情境察覺。醫療保健領域的診斷分析結合了影像記錄、實驗室結果和臨床醫生評論,將不良後果追溯到特定的流程缺陷,從而為後續的指導性干預措施奠定基礎。這些層面相互強化,確保了暗分析產業在策略前瞻和日常戰術性執行方面都能發揮作用。
到2024年,雲端運算仍將佔據暗分析市場67%的佔有率,這得益於持續的服務升級和計量收費的靈活性。然而,隨著企業將敏感工作負載遷移到更靠近源頭的位置,預計到2030年,邊緣運算和混合配置領域將額外佔據14億美元的暗分析市場佔有率。製造業、能源業和需要亞秒推理的自主系統對這類需求最為強勁。預計到2025年,邊緣運算市場規模將達到615.4億美元,為分析模型提供充足的處理餘量。
企業通常會將公有雲和本地私有資源混合部署,以平衡全球可擴展性和自主性。這種混合整合增加了架構的複雜性。資料同步、模型管治和零信任控制必須在各個節點間無縫運作。供應商現在將整合了嵌入式 GPU 和輕量級編配的承包邊緣閘道器打包在一起,以降低整合開銷。早期採用者報告稱,電網異常檢測速度更快,自動駕駛車輛的即時調整也更加及時,從而進一步提升了分散式處理的經濟效益。
暗黑分析市場按分析類型(預測性、規範性及其他)、部署模式、資料來源(結構化、半結構化、非結構化)、最終用戶產業(銀行、金融服務和保險、醫療保健及其他)和地區進行細分。市場預測以美元計價。
區域分析
到2024年,北美將佔據暗分析市場37%的佔有率,這主要得益於成熟的雲端生態系、人工智慧的早期應用以及有利的政策環境。聯邦機構正優先考慮安全的資料共用,並鼓勵企業採用隱私增強型分析框架。對專用硬體的大量投資凸顯了該地區的決心:Oracle已累計400億美元用於購買英偉達加速器,以支持OpenAI位於德克薩斯的設施。加拿大致力於最佳化自然資源利用,而墨西哥則在汽車和電子製造業推廣分析技術,以增強出口競爭力。
亞太地區以24.4%的複合年成長率引領成長,中國、印度和東南亞各國政府正大力投資建置下一代資料中心和人才儲備。中國在巨量資料領域的支出佔該地區的37.5%,並根據國家網路安全法規利用自主雲端。印度的IT服務業正利用其成本優勢和雄厚的工程技術人才儲備,滿足不斷成長的需求,並向全球出口承包分析解決方案。日本和韓國則專注於工業自動化,利用邊緣人工智慧實現高精度機器人和品質保證。由於跨境資料流動法規仍面臨挑戰,跨國公司正在實施在地化策略,例如建立國內邊緣叢集。
儘管GDPR日益嚴格,人工智慧管治提案層出不窮,歐洲仍維持相當大的市場佔有率。德國、法國和義大利擁有龐大的傳統製造地,這些國家積極推行預測性維護以提高資產運轉率,從而受益於暗分析市場的發展。 DORA法規提高了彈性標準,推動了對高級分析的需求,以評估資訊通訊技術事件和供應鏈風險。英國,尤其是在金融服務領域,正在加速採用合成資料進行模型檢驗,而北歐國家則率先推行綠色資料中心實踐,以減少與分析相關的碳排放。
拉丁美洲和中東及非洲是規模雖小但成長迅速的機會區,前者以行動優先的消費行為為特徵,後者則以金融科技創新為特徵。在這兩個地區,超大規模資料中心的擴張正在降低運算成本,並擴大進階分析工具的普及範圍。通訊數據貨幣化和公共部門數位身分計畫正在成為關鍵應用案例,預計在未來五年內推動該地區的普及率。
其他福利:
- Excel格式的市場預測(ME)表
- 3個月的分析師支持
目錄
第1章 引言
- 調查先決條件
- 調查範圍
第2章調查方法
第3章執行摘要
第4章 市場情勢
- 市場概覽
- 市場促進因素
- 引入人工智慧/機器學習優先的安全分析
- 物聯網數據的指數級成長
- 降低雲端儲存成本
- 零信任成為強制性要求,擴大了日誌儲存的範圍。
- 合成資料的成長揭示了暗資料的奧秘。
- 市場限制
- 數據工程和資料科學技能差距
- 合規成本不斷上升(GDPR、CCPA、DORA)
- 提高靜態資料的碳足跡課稅
- 價值/供應鏈分析
- 監管環境
- 技術展望
- 波特五力分析
- 買方的議價能力
- 供應商的議價能力
- 新進入者的威脅
- 替代品的威脅
- 競爭對手之間的競爭
第5章 市場規模與成長預測
- 按分析類型
- 預言
- 規範
- 診斷
- 說明的
- 按部署模式
- 本地部署
- 雲
- 邊緣/混合
- 依資料來源
- 結構
- 半結構化
- 非結構化
- 按最終用戶行業分類
- BFSI
- 衛生保健
- 政府機構
- 通訊業務
- 零售與電子商務
- 製造業
- 其他(能源、媒體等)
- 按地區
- 北美洲
- 美國
- 加拿大
- 墨西哥
- 南美洲
- 巴西
- 阿根廷
- 其他南美洲國家
- 歐洲
- 英國
- 德國
- 法國
- 義大利
- 其他歐洲地區
- 亞太地區
- 中國
- 日本
- 印度
- 韓國
- 亞太其他地區
- 中東
- 以色列
- 沙烏地阿拉伯
- 阿拉伯聯合大公國
- 土耳其
- 其他中東地區
- 非洲
- 南非
- 埃及
- 其他非洲地區
- 北美洲
第6章 競爭情勢
- 市場集中度
- 策略趨勢
- 市佔率分析
- 公司簡介
- IBM Corporation
- Microsoft Corporation
- Amazon Web Services Inc.
- SAP SE
- Palantir Technologies
- Oracle Corporation
- Hewlett Packard Enterprise
- SAS Institute
- Teradata Corporation
- Micro Focus International
- Splunk Inc.
- Elastic NV
- Darktrace Plc.
- Rapid7 Inc.
- Securonix Inc.
- Databricks Inc.
- Snowflake Inc.
- Google Cloud Platform
- Cloudera Inc.
- Exasol AG
第7章 市場機會與未來展望
The dark analytics market is valued at USD 2.6 billion in 2025 and is forecast to reach USD 6.9 billion by 2030, advancing at a 21.6% CAGR.
This growth mirrors enterprises' realization that nearly 80% of corporate information is still unstructured and therefore invisible to conventional analytics systems. Artificial intelligence, machine learning, and cloud-native platforms now combine to turn these dormant data troves into real-time operational intelligence. Rapid proliferation of Internet-of-Things (IoT) devices, lower cloud-storage costs, and expanding regulatory mandates that require extensive log retention are further accelerating demand for dark-data processing. Competitive momentum is shifting toward providers that embed large language models, vector search, and synthetic-data generation, which together enable faster model training and stronger privacy controls.
Global Dark Analytics Market Trends and Insights
AI/ML-First Security Analytics Adoption
Security-centric architectures are redefining the dark analytics market as 91% of United States banks now use AI to detect fraud, a practice that could save USD 40 billion in losses by 2027. Chief information-security officers report that advanced threats driven by adversarial AI have made autonomous response indispensable, with 78% acknowledging material impacts on their defensive posture. Financial institutions illustrate the shift through deployments such as MongoDB's vector-search integration with OpenAI, which supports real-time analysis across structured and unstructured transaction streams. Large language models now interpret intricate security logs, but the rise of shadow AI-72% of generative-AI activity occurs outside official oversight-creates novel exposure risks that only sophisticated monitoring can address.
Exponential IoT Data Growth
IoT devices are creating zettabyte-scale unstructured data at a 40% CAGR, fundamentally reshaping storage and analytics economics. Manufacturers achieve sizable gains when they harness this dark data: Jaguar Land Rover cut supply-chain query times from three weeks to 45 minutes by applying graph analytics to real-time sensor feeds. By 2025, 75% of enterprise-generated data will be processed outside traditional data centers, a trend that is driving edge adoption. Pairing edge compute with lightweight AI allows millisecond-level pattern recognition in mission-critical settings, including automated industrial machinery and connected healthcare equipment.
Skills Gap in Data Engineering & Data Science
Fifty-eight percent of data-center operators struggled to fill engineering roles during 2025, creating a bottleneck in dark analytics market deployment. Modern projects demand multidisciplinary skills that span distributed computing, domain knowledge, and machine-learning operations. Asia-Pacific's rapid digitization inflates wages for scarce professionals, putting smaller enterprises at a disadvantage. Low-code frameworks alleviate some pressure by simplifying pipeline creation, yet advanced use cases such as multimodal inference still require seasoned talent. Many firms opt for managed platforms to bridge the gap, although this introduces concentration risk and can constrain customization flexibility.
Other drivers and restraints analyzed in the detailed report include:
- Falling Cloud-Storage Costs
- Zero-Trust Mandates Expanding Log Retention Windows
- Escalating Compliance Cost (GDPR, CCPA, DORA)
For complete list of drivers and restraints, kindly check the Table Of Contents.
Segment Analysis
Prescriptive analytics is scaling at a 28.5% CAGR, underscoring a move from hindsight toward automated decision orchestration. Predictive methods retained the largest 43% slice of dark analytics market share in 2024 by providing probabilistic forecasts that feed planning cycles. The dark analytics market size attributable to prescriptive engines could swell to USD 2.3 billion by 2030 if current adoption momentum continues. Natural-language overlays now let business users pose conversational "what-if" questions, which models answer with ranked recommendations. Manufacturers have embraced this evolution, building digital twins that simulate entire supply networks so staff can test adjustments without interrupting production.
Descriptive and diagnostic techniques retain relevance because they uncover baseline patterns and root causes that feed higher-order optimization. Descriptive dashboards are improving through real-time connectors that fuse operational technology data with enterprise resource planning streams, broadening situational awareness. Diagnostic analytics in healthcare combines imaging notes, lab results, and clinician commentary to trace adverse outcomes back to specific process lapses, forming the foundation for later prescriptive interventions. Collectively, these layers reinforce each other, ensuring the dark analytics industry can serve both strategic foresight and daily tactical execution.
Cloud maintained a commanding 67% of dark analytics market share in 2024, benefiting from continuous service upgrades and pay-as-you-go elasticity. Even so, the segment representing edge and hybrid configurations is forecast to capture an extra USD 1.4 billion of dark analytics market size by 2030 as companies shift sensitive workloads closer to origin points. Demand is strongest in manufacturing, energy, and autonomous systems that require sub-second inference. The edge computing sector itself is expected to reach USD 61.54 billion in 2025, providing abundant processing headroom for analytics models.
Enterprises frequently blend public clouds with private on-premises resources, balancing sovereignty mandates against global scalability. This hybrid coordination raises architectural complexity: data synchronization, model governance, and zero-trust controls must function seamlessly across nodes. Providers now package turnkey edge gateways with embedded GPUs and lightweight orchestration to reduce integration overhead. Early adopters report faster anomaly detection in power grids and real-time adjustments of autonomous-guided vehicles, results that reinforce the economic case for distributed processing.
Dark Analytics Market Segmented by Analytics Type (Predictive, Prescriptive and More), Deployment Model, Data Source (Structured, Semi-Structured and Unstructured), End-User Vertical (BFSI, Healthcare and More) and by Geography. The Market Forecasts are Provided in Terms of Value (USD).
Geography Analysis
North America captured 37% of dark analytics market size in 2024 owing to its mature cloud ecosystem, early AI uptake, and supportive policy environment. Federal agencies emphasize secure data-sharing, encouraging enterprises to adopt privacy-enhanced analytics frameworks. Heavy investments in specialized hardware underline the region's commitment: Oracle alone earmarked USD 40 billion for Nvidia accelerators to back OpenAI's Texas facility, a move expected to reinforce regional leadership in AI compute. Canada focuses on natural-resources optimization, while Mexico pushes analytics in automotive and electronics manufacturing to bolster export competitiveness.
Asia-Pacific is advancing at a 24.4% CAGR as governments throughout China, India, and Southeast Asia finance next-generation data centers and talent pipelines. China accounts for 37.5% of regional big-data spending, leveraging sovereign clouds that align with national cybersecurity regulations. India's IT-services sector exports turnkey analytics solutions worldwide, using cost advantages and deep engineering pools to capture incremental demand. Japan and South Korea concentrate on industrial automation, exploiting edge AI for high-precision robotics and quality assurance. Cross-border data-flow rules remain a challenge, prompting multinationals to deploy localization strategies such as in-country edge clusters.
Europe maintains meaningful share despite stringent GDPR and proliferating AI-governance proposals. The dark analytics market benefits from legacy manufacturing bases across Germany, France, and Italy that seek predictive maintenance to lift asset uptime. DORA regulations are raising resilience standards, thereby increasing demand for advanced analytics that evaluates ICT incidents and supply-chain exposures. The United Kingdom, through its financial-services focus, accelerates adoption of synthetic data for model validation, while Nordic nations pioneer green-data-center practices to reduce analytics-related carbon footprints.
Collectively, Latin America and the Middle East & Africa represent smaller but fast-growing opportunity pools, each characterized by mobile-first consumer behaviour and fintech innovation. Both regions benefit from hyperscale expansions that lower compute costs and broaden access to sophisticated analytics tools. Telecommunications data monetization and public-sector digital identity programs are emerging as primary use cases that could elevate regional penetration in the latter half of the decade.
- IBM Corporation
- Microsoft Corporation
- Amazon Web Services Inc.
- SAP SE
- Palantir Technologies
- Oracle Corporation
- Hewlett Packard Enterprise
- SAS Institute
- Teradata Corporation
- Micro Focus International
- Splunk Inc.
- Elastic N.V.
- Darktrace Plc.
- Rapid7 Inc.
- Securonix Inc.
- Databricks Inc.
- Snowflake Inc.
- Google Cloud Platform
- Cloudera Inc.
- Exasol AG
Additional Benefits:
- The market estimate (ME) sheet in Excel format
- 3 months of analyst support
TABLE OF CONTENTS
1 INTRODUCTION
- 1.1 Study Assumptions
- 1.2 Scope of the Study
2 RESEARCH METHODOLOGY
3 EXECUTIVE SUMMARY
4 MARKET LANDSCAPE
- 4.1 Market Overview
- 4.2 Market Drivers
- 4.2.1 AI/ML-first security analytics adoption
- 4.2.2 Exponential IoT data growth
- 4.2.3 Falling cloud-storage costs
- 4.2.4 Zero-trust mandates expanding log retention windows
- 4.2.5 Growth of synthetic data to unlock dark data
- 4.3 Market Restraints
- 4.3.1 Skills gap in data engineering and data-science
- 4.3.2 Escalating compliance cost (GDPR, CCPA, DORA)
- 4.3.3 Rising carbon-footprint taxes on data at rest
- 4.4 Value / Supply-Chain Analysis
- 4.5 Regulatory Landscape
- 4.6 Technological Outlook
- 4.7 Porter's Five Forces Analysis
- 4.7.1 Bargaining Power of Buyers
- 4.7.2 Bargaining Power of Suppliers
- 4.7.3 Threat of New Entrants
- 4.7.4 Threat of Substitutes
- 4.7.5 Intensity of Competitive Rivalry
5 MARKET SIZE AND GROWTH FORECASTS (VALUE)
- 5.1 By Analytics Type
- 5.1.1 Predictive
- 5.1.2 Prescriptive
- 5.1.3 Diagnostic
- 5.1.4 Descriptive
- 5.2 By Deployment Model
- 5.2.1 On-premise
- 5.2.2 Cloud
- 5.2.3 Edge / Hybrid
- 5.3 By Data Source
- 5.3.1 Structured
- 5.3.2 Semi-Structured
- 5.3.3 Unstructured
- 5.4 By End-user Vertical
- 5.4.1 BFSI
- 5.4.2 Healthcare
- 5.4.3 Government
- 5.4.4 Telecommunications
- 5.4.5 Retail and E-commerce
- 5.4.6 Manufacturing
- 5.4.7 Others (Energy, Media, etc.)
- 5.5 By Geography
- 5.5.1 North America
- 5.5.1.1 United States
- 5.5.1.2 Canada
- 5.5.1.3 Mexico
- 5.5.2 South America
- 5.5.2.1 Brazil
- 5.5.2.2 Argentina
- 5.5.2.3 Rest of South America
- 5.5.3 Europe
- 5.5.3.1 United Kingdom
- 5.5.3.2 Germany
- 5.5.3.3 France
- 5.5.3.4 Italy
- 5.5.3.5 Rest of Europe
- 5.5.4 Asia-Pacific
- 5.5.4.1 China
- 5.5.4.2 Japan
- 5.5.4.3 India
- 5.5.4.4 South Korea
- 5.5.4.5 Rest of Asia-Pacific
- 5.5.5 Middle East
- 5.5.5.1 Israel
- 5.5.5.2 Saudi Arabia
- 5.5.5.3 United Arab Emirates
- 5.5.5.4 Turkey
- 5.5.5.5 Rest of Middle East
- 5.5.6 Africa
- 5.5.6.1 South Africa
- 5.5.6.2 Egypt
- 5.5.6.3 Rest of Africa
- 5.5.1 North America
6 COMPETITIVE LANDSCAPE
- 6.1 Market Concentration
- 6.2 Strategic Moves
- 6.3 Market Share Analysis
- 6.4 Company Profiles {(includes Global level Overview, Market level overview, Core Segments, Financials as available, Strategic Information, Market Rank/Share for key companies, Products and Services, and Recent Developments)}
- 6.4.1 IBM Corporation
- 6.4.2 Microsoft Corporation
- 6.4.3 Amazon Web Services Inc.
- 6.4.4 SAP SE
- 6.4.5 Palantir Technologies
- 6.4.6 Oracle Corporation
- 6.4.7 Hewlett Packard Enterprise
- 6.4.8 SAS Institute
- 6.4.9 Teradata Corporation
- 6.4.10 Micro Focus International
- 6.4.11 Splunk Inc.
- 6.4.12 Elastic N.V.
- 6.4.13 Darktrace Plc.
- 6.4.14 Rapid7 Inc.
- 6.4.15 Securonix Inc.
- 6.4.16 Databricks Inc.
- 6.4.17 Snowflake Inc.
- 6.4.18 Google Cloud Platform
- 6.4.19 Cloudera Inc.
- 6.4.20 Exasol AG
7 MARKET OPPORTUNITIES AND FUTURE OUTLOOK
- 7.1 White-space and Unmet-need Assessment


