


 |
市場調查報告書
商品編碼
1851786
客流統計系統:市場佔有率分析、產業趨勢、統計數據和成長預測(2025-2030 年)People Counting System - Market Share Analysis, Industry Trends & Statistics, Growth Forecasts (2025 - 2030) |
||||||
※ 本網頁內容可能與最新版本有所差異。詳細情況請與我們聯繫。
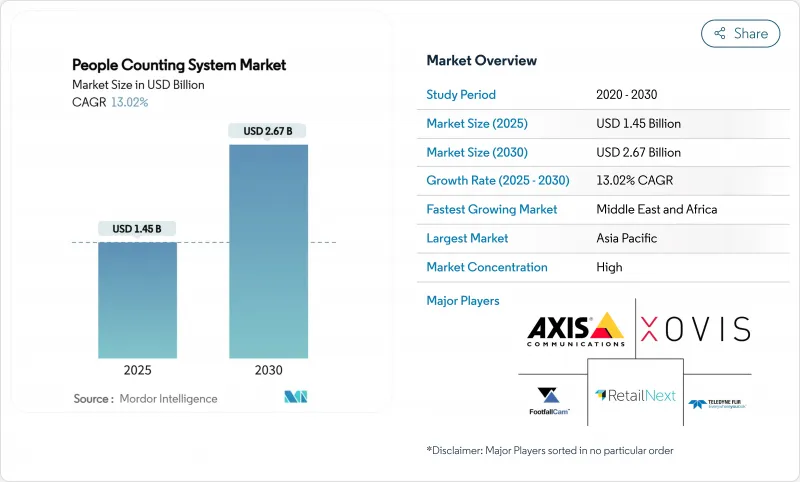
預計到 2025 年,客流統計系統市場規模將達到 14.5 億美元,到 2030 年將達到 26.7 億美元,預測期(2025-2030 年)複合年成長率為 13.02%。
強勁的需求源自於智慧城市建設支出、疫情後居住要求以及人工智慧感測器融合技術的持續發展,該技術旨在提高精度並降低營運成本。隨著飛行時間(ToF) 感測器精度達到 99.8%,並整合隱私設計功能以幫助業主滿足 GDPR 和 CCPA 的合規要求,其應用正在加速普及。與暖通空調 (HVAC) 系統的節能整合凸顯了從點分析向整體最佳化的轉變,一項商業建築試點項目記錄了 12.5% 的節能效果。亞太地區的智慧交通計劃、中東的地鐵擴建以及美國購物中心客流量的復甦,都為市場帶來了多方面的成長動能。同時,半導體供應中斷和不斷上漲的合規成本正給中小型零售商帶來定價壓力。
全球客流統計系統市場趨勢與洞察
北美和歐洲的智慧零售商對即時客流量分析的需求
美國購物中心在實施數據分析後,營收成長了5%至15%。 Link Retail的LinkVision攝影機軟體利用現有CCTV,準確率超過95%,進而降低了歐洲連鎖店的整修成本。 Telstra正在澳洲門市部署2024系統,該系統結合了超過95%的準確率和設備端處理技術,以應對隱私風險,凸顯了其全球影響力。透過人口統計元資料增強客流量統計,零售商無需共用資料即可調整版面配置並進行精準促銷活動。這些優勢鞏固了客流量統計系統的市場地位,而客流量統計系統是全通路策略的核心。
新冠疫情後租戶合規要求強制安裝加油設施(歐盟、美國)
修訂後的建築規範要求即時統計人數,以支援緊急疏散和室內空氣品質監測,這促使醫療機構和政府辦公大樓開始採用這項技術。美國總務奧克拉荷馬市聯邦大樓將居住感測器與其建築管理系統 (BMS) 連接,從而降低了 41% 的能源消耗,向政府採購方展示了投資回報率。 FootfallCam 符合 GDPR 標準的設計在晶片層面匿名化數據,防止儲存個人影像,同時保持計數精度。美國國土國防安全保障部 2024 年的一項調查核准了15 種雲分析工具,證實了該技術對公共準備的重要性。因此,日益嚴格的合規要求既是催化劑也是篩選器,它獎勵那些擁有可靠隱私認證的供應商。
GDPR/CCPA隱私合規性阻礙了歐盟和加拿大基於攝影機的監控系統的應用。
嚴格的授權規則迫使供應商採用匿名化和本地處理技術。 AuraVision 的裝置端分析技術可在不儲存影像的情況下擷取方向計數,從而滿足監管機構的要求。飛行時間 (ToF) 感測器無需可辨識的幀即可提供超過 95% 的精度,降低了認證門檻。能夠檢驗端到端合規性的供應商在公共競標中越來越具有優勢,進而影響市場競爭動態。
細分市場分析
硬體仍將是客流統計系統市場收入的主導力量,到2024年將佔據64%的市場。資本支出主要集中在安裝在零售入口、機場航站大樓和公共場所的飛行時間(ToF)和雷射雷達(LiDAR)感測器上。同時,隨著營運商尋求外包分析、合規性審核和持續校準等服務,託管服務正以13.7%的複合年成長率成長。從一次性安裝模式轉變為訂閱模式的將改變收入的可見性,並支持永續成長。客流統計系統產業的參與者將利用交叉銷售,將感測器升級和儀錶板培訓相結合,簽訂多年合約。軟體平台將轉型為微服務架構,整合第三方數據,以支援預測性人員配置和能源最佳化等應用情境。
整合程度的提高增加了複雜性,使服務公司扮演起協調者的角色,負責統籌IT安全、設施管理和行銷。運轉率數據與暖通空調(HVAC)運行計劃相結合的計劃展現出切實的營運成本效益,促使業主將支出從固定資產轉向基於結果的合約。因此,服務類別正在幫助客流統計系統市場擺脫硬體更新周期的限制,以實現多元化發展。
2024年,紅外線光束感測器佔據了36.5%的客流統計系統市場佔有率,這主要得益於其在狹窄門安裝環境中的可靠性。然而,飛行時間(ToF)3D感測器預計將以14.4%的複合年成長率成長。 ToF感測器透過將光飛行時間轉換為深度圖,能夠區分人、推車和寵物,即使在光照條件變化的情況下也能保持精確度。這種轉變對擁有可整合符合GDPR要求的邏輯的專有ToF ASIC晶片的供應商來說是個好消息。基於視訊的方法將透過轉向去除個人影像的邊緣推理技術而繼續生存,但一些買家仍然持謹慎態度。熱感成像技術在醫院佔據獨特的市場地位,因為醫院的體溫篩檢和客流統計功能在此融合。隨著組件成本的下降,預計到2030年,與ToF感測器相關的客流統計系統的市場規模將超過紅外線感測器。
混合部署方案,例如在入口處使用飛行時間(ToF)感測器,在開放區域使用Wi-Fi探測器,顯示人們對多模態精度的需求日益成長。高通公司可擴展深度估計專利清晰地表明了其對廣泛技術棧的投入,旨在不斷提升ToF的性能。隨著應用範圍的擴大,規模經濟將進一步降低價格分佈,進而進一步推動技術轉型。
區域分析
亞太地區預計到2024年將佔全球收入的31.4%,這主要得益於政府資助的智慧城市計畫以及本地生產的降低單位成本的感測器硬體。新加坡地鐵正在升級攝影機並利用車票資料推送擁塞預警,而香港則將雷射雷達(LiDAR)支援的邊緣人工智慧技術應用於鐵路安全。日本JR東日本公司正在處理約600個車站的Suica卡交易記錄,以模擬通勤流量,用於交通規劃和商店選址。中國二線城市的快速都市化推動了人群管理套件的大量訂單,而東南亞的機場正在部署飛行時間計數器以加快安檢速度。這些協調一致的基礎設施建設目標正在鞏固該地區在客流統計系統市場的長期主導地位。
中東是成長最快的地區,複合年成長率高達14.2%。 「2030願景」計畫正在沙烏地阿拉伯、阿拉伯聯合大公國和卡達推動大規模感測器部署。 Bold Technologies公司向Ion Sentia的認知城市平台投資25億美元,該平台將出行、醫療保健和能源數據整合到一個人工智慧層中。杜拜的目標是利用街道感測器建構全城數位孿生,這將為雲端分析提供者帶來更多機會。大量創業投資湧入中東和北非地區的分析新興企業,預示著當地供給能力的提升。
在北美,零售業的更新換代週期和聯邦政府的設施法規正在推動相關技術的應用。預計到2025年,消費者將重返美國購物中心,從而更加重視員工與消費者之間的差異化服務。歐洲的GDPR法規將推動以隱私為中心的飛行時間(ToF)技術和尖端視訊解決方案的發展,鼓勵企業進行現有系統的升級而非全新部署。南美洲中小企業面臨著技術成本的挑戰,而非洲新興的智慧城市規劃則帶來了更長遠的成長潛力。
其他福利:
- Excel格式的市場預測(ME)表
- 3個月的分析師支持
目錄
第1章 引言
- 研究假設和市場定義
- 調查範圍
第2章調查方法
第3章執行摘要
第4章 市場情勢
- 市場概覽
- 市場促進因素
- 北美和歐洲智慧零售業對客流量分析的需求
- 新冠疫情後入住率合規義務推動設施改造(歐盟、美國)
- 智慧城市交通樞紐在亞洲各地部署人流感測器
- 人工智慧驅動的視訊分析可降低整體擁有成本並提高準確性
- 透過商業建築運轉率整合實現暖通空調能源最佳化
- 創業投資中東和北非地區的客流量即服務平台
- 市場限制
- GDPR/CCPA隱私合規性阻礙了歐盟和加拿大基於攝影機的監控系統的應用。
- 開放區域(體育場)數量統計準確性的不足會降低買家信心。
- 新興市場傳統建築管理系統整合的複雜性
- 南美中小零售商的價格敏感度
- 監理與技術展望
- 波特五力分析
- 供應商的議價能力
- 買方的議價能力
- 新進入者的威脅
- 替代品的威脅
- 競爭對手之間的競爭
- 技術概覽
- 有線感應器
- 無線(Wi-Fi/BLE/LoRa)
- 熱感成像感測器
- 飛行時間3D感測器
- 其他技術(壓力墊、磁性、LiDAR)
第5章 市場規模與成長預測
- 報價
- 硬體
- 軟體
- 服務
- 透過感測器技術
- 紅外線光束
- 熱感成像(IR)
- 基於視訊的(單聲道/立體/人工智慧)
- 飛行時間(3D)
- 壓力和磁性
- Wi-Fi/BLE探針
- 透過部署模式
- 本地部署
- 雲
- 連結性別
- 有線(乙太網路/PoE)
- 無線(Wi-Fi)
- LP-WAN(LoRa、Zigbee、BLE)
- 按行業
- 零售店
- 購物中心和大賣場
- 交通樞紐(機場/捷運/公車)
- 飯店及休閒(飯店、賭場、主題樂園)
- 體育和娛樂場所
- 銀行和金融機構
- 企業及政府大樓
- 醫療機構
- 智慧城市與公共空間
- 其他
- 按地區
- 北美洲
- 美國
- 加拿大
- 墨西哥
- 南美洲
- 巴西
- 阿根廷
- 智利
- 其他南美洲國家
- 歐洲
- 英國
- 德國
- 法國
- 義大利
- 西班牙
- 北歐國家(瑞典、挪威、丹麥、芬蘭)
- 其他歐洲地區
- 亞太地區
- 中國
- 日本
- 印度
- 韓國
- 東南亞
- 澳洲
- 紐西蘭
- 亞太其他地區
- 中東和非洲
- 中東
- 沙烏地阿拉伯
- 阿拉伯聯合大公國
- 土耳其
- 其他中東地區
- 非洲
- 南非
- 奈及利亞
- 其他非洲地區
- 北美洲
第6章 競爭情勢
- 市場集中度
- 策略趨勢
- 市佔率分析
- 公司簡介
- RetailNext Inc.
- Sensormatic Solutions(ShopperTrak)
- Axis Communications AB
- Teledyne FLIR Systems Inc.
- HELLA Aglaia Mobile Vision GmbH
- IEE SA
- InfraRed Integrated Systems Ltd.(IRISYS)
- Traf-Sys Inc.
- FootfallCam Ltd.
- V-Count Inc.
- Xovis AG
- iris-GmbH infrared and intelligent sensors
- DILAX Intelcom GmbH
- Eurotech SpA
- SensMax Ltd.
- Countlogic LLC
- Dor Technologies Inc.
- Density Inc.
- Cognimatics AB
- Megvii Technology Ltd.
第7章 市場機會與未來展望
The People Counting System Market size is estimated at USD 1.45 billion in 2025, and is expected to reach USD 2.67 billion by 2030, at a CAGR of 13.02% during the forecast period (2025-2030).
Steady demand comes from smart-city spending, post-pandemic occupancy requirements, and the continuing shift toward AI-enabled sensor fusion that raises accuracy while lowering operating costs. Adoption accelerates as Time-of-Flight (ToF) sensors deliver 99.8% accuracy and integrate privacy-by-design features that help owners meet GDPR and CCPA mandates. Energy-saving tie-ins with HVAC systems underline a move from point analytics to portfolio-wide optimization, with documented commercial-building pilots posting 12.5% energy reductions. Smart-transport projects across Asia Pacific, metro expansion in the Middle East, and mall traffic rebounds in the United States sustain multi-vertical momentum. At the same time, semiconductor supply disruption and heightened compliance costs create price tension that smaller retailers must navigate.
Global People Counting System Market Trends and Insights
Smart-retail demand for real-time footfall analytics in North America and Europe
Retailers rely on anonymized footfall data to raise conversion and calibrate staffing; evidence from U.S. malls shows 5-15% revenue uplift after analytics rollouts. Link Retail's LinkVision camera software leverages existing CCTV to surpass 95% accuracy, lowering retrofit costs for European chains. Telstra's 2024 deployment across Australian stores underscores global reach, pairing >95% accuracy with on-device processing that addresses privacy risk. By enriching traffic counts with demographic metadata, retailers adjust layouts and execute targeted promotions without data-sharing exposure. These traction points reinforce the People Counting System market as a core pillar of omnichannel strategy.
Post-COVID occupancy compliance mandates fueling installations (EU, US)
Revised building codes now require live head-counting to support emergency egress and indoor-air-quality monitoring, spurring adoption in health facilities and public offices. The GSA Oklahoma City Federal Building linked occupancy sensors to its BMS and cut energy use 41%, proving ROI to government buyers. GDPR-aligned designs from FootfallCam anonymize data at chip level, preventing storage of personal imagery while sustaining counting fidelity. Homeland Security's 2024 survey that endorsed 15 crowd-analysis tools confirms the technology's relevance to public-safety readiness. Heightened compliance requirements therefore work as both catalyst and filter, rewarding vendors with defensible privacy credentials.
GDPR/CCPA privacy compliance hindering camera-based adoption in EU and CA
Stringent consent rules compel vendors to embed anonymization and local processing, raising bill-of-materials and legal consultancy costs. Aura Vision's on-device analytics avoid image storage, satisfying regulators yet still capturing directional counts. ToF sensors emerge as a substitute, providing >95% accuracy without identifiable frames, easing certification hurdles. Vendors that can verify end-to-end compliance are increasingly favored in public tenders, which shapes competitive dynamics within the People Counting System market.
Other drivers and restraints analyzed in the detailed report include:
- Smart-city transportation hubs deploying crowd-flow sensors across Asia
- AI-enabled video analytics cutting TCO and boosting accuracy
- Accuracy gaps in open-area counting reducing buyer confidence (stadiums)
For complete list of drivers and restraints, kindly check the Table Of Contents.
Segment Analysis
Hardware continues to dominate People Counting System market revenue, holding 64% share in 2024. Capital outlays concentrate on ToF and LiDAR sensors installed across retail thresholds, airport terminals, and public facilities. Managed services, however, are climbing at a 13.7% CAGR as operators seek outsourced analytics, compliance auditing, and continuous calibration. The migration from one-off installs to subscription models transforms revenue visibility and underpins sustainable growth. People Counting System industry participants leverage cross-selling-pairing sensor upgrades with dashboard training-to lock in multi-year contracts. Software platforms move toward micro-services that ingest third-party data, supporting predictive staffing and energy-optimization use cases.
Integration depth raises complexity, positioning services firms as orchestrators that align IT security, facilities management, and marketing. Projects that join occupancy data with HVAC schedules demonstrate tangible opex gains, encouraging building owners to shift spending from fixed assets to outcome-based agreements. As a result, the services category helps diversify the People Counting System market beyond hardware refresh cycles.
Infrared beam sensors captured 36.5% of People Counting System market share in 2024 on the back of reliability in narrow-door installations. Yet ToF 3D sensors are set to expand at a 14.4% CAGR, catalyzed by privacy laws that favor non-imaging depth measurement. By converting light-flight time into depth maps, ToF differentiates people from carts and pets, sustaining accuracy under changing lighting. The shift bodes well for vendors with proprietary ToF ASICs that can embed GDPR-inclusive logic. Video-based approaches survive by pivoting to on-edge inference that strips personal imagery, but some buyers remain cautious. Thermal imaging occupies a niche in hospitals where temperature screening merges with head counts. The People Counting System market size tied to ToF sensors is projected to eclipse infrared revenues before 2030 as component cost curves decline.
Hybrid deployments that blend ToF at entry points with Wi-Fi probes in open zones demonstrate rising interest in multimodal precision. Qualcomm's patent work on scalable depth estimation underscores wider tech-stack investment that will keep ToF on a steep performance trajectory. As adoption broadens, economies of scale further compress price points, reinforcing switch-over momentum.
People Counting System Market Report is Segmented by Offering (Hardware, Software, Services), Sensor Technology (Infrared Beam, Thermal Imaging, Video-Based and More), Deployment Mode (On-Premise, Cloud), Connectivity (Wired, Wireless, LP-WAN), End-User Vertical (Retail, Malls, Transportation, Hospitality and More), and by Geography. The Market Forecasts are Provided in Terms of Value (USD).
Geography Analysis
Asia Pacific holds a 31.4% revenue stake in 2024, propelled by government-funded smart-city frameworks and locally manufactured sensor hardware that compresses unit costs. Singapore's MRT applies camera upgrades and ticket data to push crowdedness alerts, while Hong Kong integrates LiDAR-backed edge AI for railway safety. Japan's JR East processes Suica transaction logs across ~600 stations to model commuter flow, feeding both transport planning and retail placement. China's tier-two city urbanization fuels bulk orders for crowd-management kits, and Southeast Asian airports deploy ToF counters to speed security lines. These coordinated infrastructure goals cement the region's long-term dominance within the People Counting System market.
The Middle East emerges as the fastest-growing geography at a 14.2% CAGR. Vision 2030 programs back large-scale sensor rollouts in Saudi Arabia, the UAE, and Qatar. Bold Technologies allocates USD 2.5 billion to the Aion Sentia cognitive-city platform that fuses mobility, healthcare, and energy data on one AI layer. Dubai targets a city-wide digital twin via street-level sensors, expanding opportunities for crowd analytics providers. Venture-capital flows into MENA analytics startups indicate rising local supply capacity.
North America sustains adoption through retail refresh cycles and federal facility mandates. The return of U.S. mall shoppers in 2025 renews appetite for staff-versus-shopper differentiation features. Europe's GDPR regime fosters privacy-centric ToF and on-edge video solutions, stimulating upgrades rather than greenfield sales. South America grapples with SMB affordability, while Africa's nascent smart-city schemes provide longer-dated upside.
- RetailNext Inc.
- Sensormatic Solutions (ShopperTrak)
- Axis Communications AB
- Teledyne FLIR Systems Inc.
- HELLA Aglaia Mobile Vision GmbH
- IEE S.A.
- InfraRed Integrated Systems Ltd. (IRISYS)
- Traf-Sys Inc.
- FootfallCam Ltd.
- V-Count Inc.
- Xovis AG
- iris-GmbH infrared and intelligent sensors
- DILAX Intelcom GmbH
- Eurotech S.p.A.
- SensMax Ltd.
- Countlogic LLC
- Dor Technologies Inc.
- Density Inc.
- Cognimatics AB
- Megvii Technology Ltd.
Additional Benefits:
- The market estimate (ME) sheet in Excel format
- 3 months of analyst support
TABLE OF CONTENTS
1 INTRODUCTION
- 1.1 Study Assumptions and Market Definition
- 1.2 Scope of the Study
2 RESEARCH METHODOLOGY
3 EXECUTIVE SUMMARY
4 MARKET LANDSCAPE
- 4.1 Market Overview
- 4.2 Market Drivers
- 4.2.1 Smart-Retail Demand for Real-Time Footfall Analytics in North America and Europe
- 4.2.2 Post-COVID Occupancy Compliance Mandates Fueling Installations (EU, US)
- 4.2.3 Smart-City Transportation Hubs Deploying Crowd-Flow Sensors Across Asia
- 4.2.4 AI-Enabled Video Analytics Cutting TCO and Boosting Accuracy
- 4.2.5 HVAC Energy-Optimization via Occupancy Integration in Commercial Buildings
- 4.2.6 Venture-Capital Surge into MENA Footfall-as-a-Service Platforms
- 4.3 Market Restraints
- 4.3.1 GDPR/CCPA Privacy Compliance Hindering Camera-Based Adoption in EU and CA
- 4.3.2 Accuracy Gaps in Open-Area Counting Reducing Buyer Confidence (Stadiums)
- 4.3.3 Legacy BMS Integration Complexity in Emerging Markets
- 4.3.4 Price Sensitivity of SMB Retailers in South America
- 4.4 Regulatory and Technological Outlook
- 4.5 Porter's Five Forces Analysis
- 4.5.1 Bargaining Power of Suppliers
- 4.5.2 Bargaining Power of Buyers
- 4.5.3 Threat of New Entrants
- 4.5.4 Threat of Substitutes
- 4.5.5 Competitive Rivalry
- 4.6 Technology Snapshot
- 4.6.1 Wired Sensors
- 4.6.2 Wireless (Wi-Fi / BLE / LoRa)
- 4.6.3 Thermal Imaging Sensors
- 4.6.4 Time-of-Flight 3-D Sensors
- 4.6.5 Other Technologies (Pressure Mats, Magnetic, LiDAR)
5 MARKET SIZE AND GROWTH FORECASTS (VALUE)
- 5.1 By Offering
- 5.1.1 Hardware
- 5.1.2 Software
- 5.1.3 Services
- 5.2 By Sensor Technology
- 5.2.1 Infrared Beam
- 5.2.2 Thermal Imaging (IR)
- 5.2.3 Video-Based (Mono / Stereo / AI)
- 5.2.4 Time-of-Flight (3-D)
- 5.2.5 Pressure and Magnetic
- 5.2.6 Wi-Fi / BLE Probe
- 5.3 By Deployment Mode
- 5.3.1 On-Premise
- 5.3.2 Cloud
- 5.4 By Connectivity
- 5.4.1 Wired (Ethernet / PoE)
- 5.4.2 Wireless (Wi-Fi)
- 5.4.3 LP-WAN (LoRa, Zigbee, BLE)
- 5.5 By End-User Vertical
- 5.5.1 Retail Stores
- 5.5.2 Shopping Malls and Hypermarkets
- 5.5.3 Transportation Hubs (Airports / Metro / Bus)
- 5.5.4 Hospitality and Leisure (Hotels, Casinos, Theme Parks)
- 5.5.5 Sports and Entertainment Venues
- 5.5.6 Banks and Financial Institutions
- 5.5.7 Corporate and Government Buildings
- 5.5.8 Healthcare Facilities
- 5.5.9 Smart Cities and Public Spaces
- 5.5.10 Others
- 5.6 By Geography
- 5.6.1 North America
- 5.6.1.1 United States
- 5.6.1.2 Canada
- 5.6.1.3 Mexico
- 5.6.2 South America
- 5.6.2.1 Brazil
- 5.6.2.2 Argentina
- 5.6.2.3 Chile
- 5.6.2.4 Rest of South America
- 5.6.3 Europe
- 5.6.3.1 United Kingdom
- 5.6.3.2 Germany
- 5.6.3.3 France
- 5.6.3.4 Italy
- 5.6.3.5 Spain
- 5.6.3.6 Nordics (Sweden, Norway, Denmark, Finland)
- 5.6.3.7 Rest of Europe
- 5.6.4 Asia Pacific
- 5.6.4.1 China
- 5.6.4.2 Japan
- 5.6.4.3 India
- 5.6.4.4 South Korea
- 5.6.4.5 Southeast Asia
- 5.6.4.6 Australia
- 5.6.4.7 New Zealand
- 5.6.4.8 Rest of Asia Pacific
- 5.6.5 Middle East and Africa
- 5.6.5.1 Middle East
- 5.6.5.1.1 Saudi Arabia
- 5.6.5.1.2 United Arab Emirates
- 5.6.5.1.3 Turkey
- 5.6.5.1.4 Rest of Middle East
- 5.6.5.2 Africa
- 5.6.5.2.1 South Africa
- 5.6.5.2.2 Nigeria
- 5.6.5.2.3 Rest of Africa
- 5.6.1 North America
6 COMPETITIVE LANDSCAPE
- 6.1 Market Concentration
- 6.2 Strategic Moves
- 6.3 Market Share Analysis
- 6.4 Company Profiles (includes Global level Overview, Market level overview, Core Segments, Financials as available, Strategic Information, Market Rank/Share for key companies, Products and Services, and Recent Developments)
- 6.4.1 RetailNext Inc.
- 6.4.2 Sensormatic Solutions (ShopperTrak)
- 6.4.3 Axis Communications AB
- 6.4.4 Teledyne FLIR Systems Inc.
- 6.4.5 HELLA Aglaia Mobile Vision GmbH
- 6.4.6 IEE S.A.
- 6.4.7 InfraRed Integrated Systems Ltd. (IRISYS)
- 6.4.8 Traf-Sys Inc.
- 6.4.9 FootfallCam Ltd.
- 6.4.10 V-Count Inc.
- 6.4.11 Xovis AG
- 6.4.12 iris-GmbH infrared and intelligent sensors
- 6.4.13 DILAX Intelcom GmbH
- 6.4.14 Eurotech S.p.A.
- 6.4.15 SensMax Ltd.
- 6.4.16 Countlogic LLC
- 6.4.17 Dor Technologies Inc.
- 6.4.18 Density Inc.
- 6.4.19 Cognimatics AB
- 6.4.20 Megvii Technology Ltd.
7 MARKET OPPORTUNITIES AND FUTURE OUTLOOK
- 7.1 White-Space and Unmet-Need Assessment
 人體流量測量系統市場:按組件、技術、應用和最終用戶分類-2026-2032年全球市場預測
 2026年全球員工計數系統市場報告
 人流監控系統市場分析及預測(至2035年):依類型、產品類型、服務、技術、組件、應用、部署類型、最終用戶及功能分類
 全球人流監控系統市場規模、佔有率、趨勢和成長分析報告(2026-2034年)
 客流統計系統市場-全球產業規模、佔有率、趨勢、機會與預測:按類型、產品、技術、最終用戶、地區和競爭格局分類,2021-2031年
 人流監控系統市場規模、佔有率和成長分析(按類型、交付模式、平台、技術、最終用戶和地區分類)-2026-2033年產業預測
 人流監控系統:全球市佔率及排名、總收入及需求預測(2025-2031年)
 2025-2029年全球客流統計系統市場
 人數統計系統市場規模、佔有率、趨勢分析報告:按類型、按產品、按硬體、按技術、按安裝平台、按最終用途、按地區和細分趨勢:2025-2030人數統計系統的全球市場:到 2033 年的機會與策略