


 |
市場調查報告書
商品編碼
1851779
生質塑膠包裝:市場佔有率分析、行業趨勢、統計數據和成長預測(2025-2030 年)Bioplastics Packaging - Market Share Analysis, Industry Trends & Statistics, Growth Forecasts (2025 - 2030) |
||||||
※ 本網頁內容可能與最新版本有所差異。詳細情況請與我們聯繫。
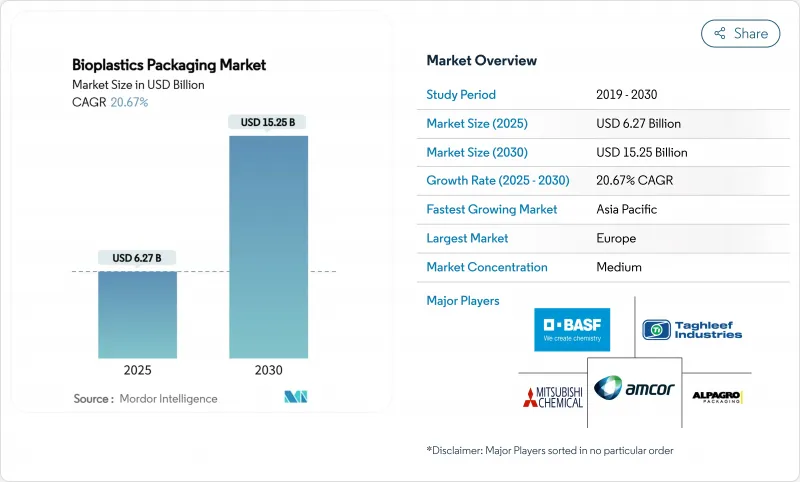
預計到 2025 年,生質塑膠包裝市場規模將達到 62.7 億美元,到 2030 年將達到 152.5 億美元,預測期內複合年成長率將達到 20.67%。
生產者延伸責任制(EPR)費用的不斷上漲、生物基加工成本效益的提高以及消費者對低碳材料的偏好,正在重塑整個生質塑膠包裝市場的供應商經濟格局。歐盟新的回收目標、印度的可追溯性強制令以及中國的快捷郵件小包裹標準正在協調監管時間表。同時,阿拉伯聯合大公國和泰國正在大幅擴大聚乳酸(PLA)和生物基聚對苯二甲酸乙二醇酯(bio-PET)的產能,消除傳統的供應瓶頸。全球食品服務連鎖企業和高階個人護理品牌正積極採用生質塑膠產品,推動其走向主流市場,並加速塗層、多層薄膜和阻隔性能的創新。這些因素的匯聚凸顯了包裝材料選擇的巨大轉變,可可再生化石基聚合物。
全球生質塑膠包裝市場趨勢與洞察
全球生產者責任延伸制度推動生物基包裝的普及
加州、歐盟和肯亞的強制生產者責任延伸制度(EPR)將報廢成本內部化,直接獎勵企業從傳統塑膠轉向可再生替代品。生產商現在需要根據產品的可回收性、可堆肥性和再生材料含量支付不同的費用,這使得生質塑膠材料在生質塑膠包裝市場更具成本競爭力。自2025年3月起,統一的報告截止日期簡化了跨境合規流程,並鼓勵跨國品牌所有者採用永續的標準化包裝形式。調整後的收費政策對不可回收的基材進行處罰,進一步擴大了可觸及的生質塑膠包裝市場。隨著泰國和阿拉伯聯合大公國大型聚乳酸(PLA)工廠的推出,監管時間表趨於一致,可預測的供應和更低的價格將推動生物塑膠的普及。
跨國連鎖餐廳的需求快速成長
領先的餐飲品牌加快了可堆肥包裝形式的測試和推廣,推動了生質塑膠包裝市場的新成長。麥當勞的杯子現在使用50%的生物聚合物混合物,星巴克正在將其模塑纖維冷飲杯試點計畫擴展到美國多個州。這些公司正在利用其採購規模來降低單位樹脂成本並檢驗消費者的接受度。簡化分類、降低掩埋費用和提升品牌股權等營運優勢,能夠促進消費者重複購買。生質塑膠的快速普及向加工商表明,他們的生質塑膠庫存設備可以達到傳統基材的加工能力,而不會維修瓶頸。
生物基原料長期短缺
巴西創紀錄的乙醇產量和美國可再生燃料標準的擴大加劇了原料競爭,推高了玉米和糖的價格,而玉米和糖正是聚乳酸(PLA)和生物基聚對苯二甲酸乙二醇酯(bio-PET)生產的主要原料。由於法律規定的需求配額和稅額扣抵,生質燃料生產商往往能在這些競爭中獲勝。 NatureWorks公司正在探索木薯和木質纖維素原料,但在非農作物原料廣泛供應之前,原料短缺仍將是生質塑膠包裝市場面臨的結構性阻力。
細分市場分析
到2024年,生物基PET將佔生質塑膠包裝市場39.43%的佔有率,因為生產商正利用現有的PET回收管道,迅速採用可直接取代PET的產品。這一細分市場受益於經ISCC PLUS認證的生質能基PTA供應鏈。可口可樂在歐洲投入1.8億歐元進行轉型,顯示大型買家正在對樹脂溢價施加下行壓力,以支撐生質塑膠包裝市場的穩定擴張。 PHA目前仍是小眾市場,但隨著市場整合趨於穩定,以及特種等級產品瞄準海洋可分解應用領域,預計其複合年成長率將達到22.38%。
玉米、馬鈴薯和木薯等原料提供了價格對沖的靈活性。泰國和阿拉伯聯合大公國的PLA產能提升了該地區的供應,而PBAT和PBS因其在較低加工溫度下仍能保持韌性而日益受到青睞。雙重籌資策略能夠幫助加工商抵禦樹脂價格波動的影響,使生質塑膠包裝市場更能抵禦價格衝擊。
預計到2024年,軟包裝將佔銷售額的58.31%,以21.61%的複合年成長率領先市場。薄膜、包裝紙和軟包裝袋與PLA和生物基PE的機械性能和阻隔性能非常匹配。雀巢在歐洲斥資1.2億瑞士法郎維修,顯示了轉型所需的資金投入,以及消費者對新產品的接受度所帶來的溢價,足以抵銷樹脂價格上漲的影響。 Accredo的甘蔗基軟包裝袋系列凸顯了其在碳減排方面的優勢,而這正是推動採購決策的關鍵因素。
儘管硬質容器由於更高的耐熱變形標準而落後於其他材料,但PLA-纖維素多層結構的氧阻隔性能如今已接近適用於常溫熱源的水平。軟性包裝技術向硬質包裝技術的過渡正在縮小性能Delta,並在更廣泛的生質塑膠包裝市場中開闢新的收入來源。
區域分析
歐洲仍將是生質塑膠包裝市場最大的區域貢獻者,預計到2024年將佔全球市場佔有率的38.28%。這主要得益於《包裝和包裝廢棄物法規》,該法規要求到2030年實現所有包裝的可回收性,並禁止在食品接觸材料中使用全氟烷基和多氟烷基物質(PFAS)。德國包裝法(VerpackG)將於2024年徵收21億歐元的生產者責任延伸(EPR)費用,鼓勵品牌商選擇生物基包裝形式,並可享有30%的費用折扣。南歐地區正在迅速推廣生鮮食品薄膜,而北歐地區則對符合低溫運輸規範的硬質優格杯表現出濃厚的興趣。
亞太地區是成長最快的地區,預計到2030年將以22.56%的複合年成長率成長。印度的可追溯性法規、中國的GB 43352-2023標準以及日本政府對可生物分解替代品的採購,都在使政策槓桿與投資獎勵策略措施相協調。 NatureWorks和Balrampur Chini Mills為國內加工商供貨,降低了運輸成本並規避了外匯波動風險。東南亞國協毗鄰豐富的農業原料產地,使其成為對歐盟高需求市場的戰略出口樞紐,從而擴大了該地區生質塑膠包裝市場的規模。
在北美,加州、奧勒岡州和科羅拉多已採用生產者責任延伸(EPR)收費系統,且勢頭強勁,絲毫沒有放緩的跡象。麥當勞和星巴克餐飲服務業的試點計畫正在加速下游加工商的資格認證。聯邦政府撥款7500萬美元建造堆肥設施,使基礎設施達到平衡。加拿大和墨西哥已採用統一的標籤標準,以保護跨境供應鏈,確保整合品牌推廣的監管清晰度。
其他好處
- Excel格式的市場預測(ME)表
- 3個月的分析師支持
目錄
第1章 引言
- 研究假設和市場定義
- 調查範圍
第2章調查方法
第3章執行摘要
第4章 市場情勢
- 市場概覽
- 市場促進因素
- 全球生產者責任延伸法促進生物基包裝的採用
- 隨著跨國食品服務連鎖企業採用可堆肥包裝,對生質塑膠包裝的需求激增。
- 亞太地區的政策轉變為生質塑膠包裝的發展創造了動力
- 擴大全球生物基PET和PLA的生產可以降低成本障礙。
- 奢侈品和個人護理品牌擴大採用生質塑膠包裝
- 政府對堆肥基礎設施的投資加速了下游產業的推廣應用。
- 市場限制
- 由於對生質燃料的競爭性需求,生物基原料長期短缺。
- 工業堆肥基礎設施不完善阻礙了報廢索賠
- 高溫應用中的功能性能極限
- 供應鏈分析
- 生質塑膠創新
- 生態系分析
- 生物塑膠-生產狀況
- 行業標準和法規
- 波特五力分析
- 供應商的議價能力
- 買方的議價能力
- 新進入者的威脅
- 替代品的威脅
- 競爭對手之間的競爭
第5章 市場規模與成長預測
- 依材料類型
- 不可生物分解的生質塑膠
- 生物PET
- 生物聚乙烯
- 其他不可生物分解的生質塑膠
- 可生物分解的生質塑膠
- 澱粉混合物
- 聚乳酸(PLA)
- 聚己二酸丁二醇酯-對苯二甲酸丁二醇酯(PBAT)
- 聚丁二酸丁二醇酯(PBS)
- 聚羥基烷酯(PHAs)
- 其他可生物分解的生質塑膠
- 不可生物分解的生質塑膠
- 依產品類型
- 硬包裝
- 瓶子和罐子
- 托盤和容器
- 其他硬質包裝
- 軟包裝
- 薄膜和包裝
- 小袋和袋子
- 其他軟包裝
- 硬包裝
- 按最終用途行業分類
- 食物
- 飲料
- 製藥
- 個人護理和化妝品
- 其他終端用戶產業
- 透過分銷管道
- 直銷
- 間接銷售
- 按地區
- 北美洲
- 美國
- 加拿大
- 墨西哥
- 歐洲
- 德國
- 英國
- 法國
- 義大利
- 西班牙
- 俄羅斯
- 其他歐洲地區
- 亞太地區
- 中國
- 印度
- 日本
- 韓國
- 澳洲和紐西蘭
- 亞太其他地區
- 中東和非洲
- 中東
- 阿拉伯聯合大公國
- 沙烏地阿拉伯
- 土耳其
- 其他中東地區
- 非洲
- 南非
- 奈及利亞
- 埃及
- 其他非洲地區
- 南美洲
- 巴西
- 阿根廷
- 其他南美洲國家
- 北美洲
第6章 競爭情勢
- 市場集中度
- 策略舉措與發展
- 市佔率分析
- 公司簡介
- BIO PACKAGING FILMS
- Folietec Kunststoffwerk AG
- HUBEI HYF PACKAGING CO., LTD.
- BIO FUTURA BV
- PLABOTTLES.EU(GLOBAL SOLUTIONS BV)
- FKUR KUNSTSTOFF GMBH
- PACTIV EVERGREEN INC.
- POUCH ME
- GS-Company
- GracePack
- NaKu eU
- Easy Green Eco Packaging Co., Ltd
- Amcor Plc
- PLAMFG
- COMPAC SRL
- Jarsking Group
- Zhejiang Sanle Plastic Co.,Ltd
- Shanghai COPAK Industry Co., LTD,
- Greendot Biopak Pvt. Ltd.
- Biogreen Biotech
第7章 市場機會與未來展望
The bioplastic packaging market reached a valuation of USD 6.27 billion in 2025 and is projected to advance to USD 15.25 billion by 2030, expanding at a 20.67% CAGR during the forecast period.
Rising Extended Producer Responsibility (EPR) fees, cost-efficient bio-feedstock processing, and consumer preference for low-carbon materials are redefining supplier economics across the bioplastic packaging market. New European Union recycling targets, India's traceability mandate, and China's express-parcel standards are synchronizing regulatory timetables, while large PLA and Bio-PET capacity additions in the United Arab Emirates and Thailand remove legacy supply constraints. Global food-service chains and luxury personal care brands now treat bioplastic formats as mainstream, accelerating innovation in coatings, multilayer films, and barrier performance. These converging forces confirm a structural shift in packaging material choice that favors renewable feedstocks over fossil-based polymers.
Global Bioplastics Packaging Market Trends and Insights
Global EPR legislation driving bio-based packaging adoption
Mandatory EPR schemes in California, the European Union, and Kenya internalize end-of-life costs, creating direct financial incentives to switch from conventional plastics to renewable alternatives. Producers now face differentiated fees based on recyclability, compostability, and recycled content, making bioplastic materials more cost-competitive in the bioplastic packaging market. Harmonized reporting deadlines beginning March 2025 simplify cross-border compliance, encouraging multinational brand owners to standardize sustainable formats. Fee modulation policies that penalize non-recyclable substrates further enlarge the addressable bioplastic packaging market. As regulatory timelines converge with the start-up of large PLA plants in Thailand and the UAE, predictable supply and lower prices reinforce adoption momentum.
Demand surge from multinational food-service chains
Leading restaurant brands accelerated trials and roll-outs of compostable formats, catalyzing new volume streams in the bioplastic packaging market. McDonald's cups now use a 50% biopolymer blend, while Starbucks has extended molded-fiber cold-cup pilots across several US states. These firms leverage procurement scale to compress per-unit resin costs and validate consumer acceptance. Operational benefits-simpler sorting, reduced landfill fees, and brand equity gains-reinforce repeat purchasing. Their rapid adoption signals to converters that bioplastic stock-keeping units can match the throughput of conventional substrates without retooling bottlenecks.
Chronic shortage of bio-based feedstock
Record ethanol runs in Brazil and rising US Renewable Fuel Standard volumes intensify feedstock competition, inflating corn and sugar prices that underpin PLA and Bio-PET production. Biofuel producers often win allocation battles thanks to legislated demand quotas and tax credits. While NatureWorks explores cassava and lignocellulosic routes, feedstock scarcity remains a structural headwind to the bioplastic packaging market until non-crop inputs reach scale.
Other drivers and restraints analyzed in the detailed report include:
- Asia-Pacific policy shifts creating momentum
- Capacity expansion in Bio-PET and PLA
- Inconsistent industrial composting infrastructure
For complete list of drivers and restraints, kindly check the Table Of Contents.
Segment Analysis
Bio-PET held 39.43% share of the bioplastic packaging market in 2024 as producers leveraged existing PET recycling streams for rapid drop-in substitution. The segment benefits from biomass-based PTA supply chains certified under ISCC PLUS. Coca-Cola's EUR 180 million European transition illustrates how large buyers exert downward pressure on resin premiums, supporting stable bioplastic packaging market size expansion. PHA, while only a niche share today, is forecast at 22.38% CAGR as consolidation stabilizes and specialty grades target marine-degradable applications.
Starch blends remain the volume leader among biodegradable polymers, with maize, potato, and cassava feedstocks offering price hedging flexibility. PLA capacity from Thailand and the UAE boosts regional supply, while PBAT and PBS gain traction in films requiring enhanced toughness at lower processing temperatures. Dual-sourcing strategies protect converters from resin volatility, keeping the bioplastic packaging market resilient to price shocks.
Flexible formats commanded 58.31% of 2024 revenue and are projected to lead at a 21.61% CAGR. Films, wraps, and pouches align well with the mechanical and barrier properties of PLA and Bio-PE. Nestle's CHF 120 million European retrofit shows the capital needed to switch over but also demonstrates consumer acceptance premiums that offset higher resin prices. Accredo's sugarcane-based pouch series underscores carbon-reduction gains that drive procurement decisions.
Rigid containers lag due to higher heat-deflection standards, yet multilayer PLA-cellulose structures now approach oxygen barrier levels suitable for ambient sauces. Technology spillover from flexible to rigid applications is narrowing the performance delta, opening new revenue pockets inside the broader bioplastic packaging market.
The Bioplastic Packaging Market Report is Segmented by Material Type (Non-Biodegradable Bioplastics, Biodegradable Bioplastics), Product Type (Rigid Packaging, Flexible Packaging), End-Use Industry (Food, Beverages, Pharmaceuticals, Personal Care and Cosmetics, Other End-Use Industry), Distribution Channel (Direct Sales, Indirect Sales), and Geography. The Market Forecasts are Provided in Terms of Value (USD).
Geography Analysis
Europe remained the largest regional contributor with 38.28% of the bioplastic packaging market in 2024, driven by the Packaging and Packaging Waste Regulation that mandates universal recyclability by 2030 and bans PFAS in food contact articles. Germany's VerpackG imposed EUR 2.1 billion EPR fees in 2024, prompting brand owners to select bio-based formats that earn 30% fee discounts. Southern Europe witnesses swift adoption in fresh-produce films, while Northern markets focus on rigid yoghurt cups that meet cold-chain specifications.
Asia-Pacific is the fastest-growing region, projected at 22.56% CAGR through 2030. India's traceability rule, China's GB 43352-2023, and Japanese government procurement of biodegradable alternatives align policy levers with investment stimuli. NatureWorks and Balrampur Chini Mills supply domestic converters, cutting freight costs and hedging against currency swings. Proximity to agricultural feedstocks positions ASEAN nations as strategic export bases to high-demand EU markets, amplifying the bioplastic packaging market size in the region.
North America shows robust momentum as California, Oregon, and Colorado finalize EPR fee schedules that escalate annually. Food-service pilot programs at McDonald's and Starbucks accelerate downstream converter qualifications. Federal grants worth USD 75 million for composting build-outs signal impending infrastructure parity, a critical enabler for bioplastic packaging market penetration beyond coastal cities. Canada and Mexico adopt harmonized labeling to protect cross-border supply chains, ensuring regulatory clarity for integrated brand roll-outs.
- BIO PACKAGING FILMS
- Folietec Kunststoffwerk AG
- HUBEI HYF PACKAGING CO., LTD.
- BIO FUTURA B.V.
- PLABOTTLES.EU (GLOBAL SOLUTIONS B.V.)
- FKUR KUNSTSTOFF GMBH
- PACTIV EVERGREEN INC.
- POUCH ME
- GS-Company
- GracePack
- NaKu eU
- Easy Green Eco Packaging Co., Ltd
- Amcor Plc
- PLAMFG
- COMPAC SRL
- Jarsking Group
- Zhejiang Sanle Plastic Co.,Ltd
- Shanghai COPAK Industry Co., LTD,
- Greendot Biopak Pvt. Ltd.
- Biogreen Biotech
Additional Benefits:
- The market estimate (ME) sheet in Excel format
- 3 months of analyst support
TABLE OF CONTENTS
1 INTRODUCTION
- 1.1 Study Assumptions and Market Definition
- 1.2 Scope of the Study
2 RESEARCH METHODOLOGY
3 EXECUTIVE SUMMARY
4 MARKET LANDSCAPE
- 4.1 Market Overview
- 4.2 Market Drivers
- 4.2.1 Global EPR Legislation Driving Bio-Based Packaging Adoption
- 4.2.2 Demand for bioplastic packaging surges as multinational food-service chains embrace compostable packaging
- 4.2.3 Asia-Pacific Policy Shifts Creating Momentum for Bioplastic Packaging
- 4.2.4 Expansion of global Bio-PET and PLA production is lowering cost barriers to adoption
- 4.2.5 Increasing adoption of bioplastic packaging among Luxury and personal care brands
- 4.2.6 Government Investment in Composting Infrastructure Accelerating Downstream Adoption
- 4.3 Market Restraints
- 4.3.1 Chronic shortage of bio-based feedstock owing to competing biofuel demand
- 4.3.2 Inconsistent industrial composting infrastructure hindering end-of-life claims
- 4.3.3 Functional performance limitations in high-temperature applications
- 4.4 Supply-Chain Analysis
- 4.5 Innovations in Bioplastics
- 4.6 Industry Ecosystem Analysis
- 4.7 Bioplastic - Production Landscape
- 4.8 Industry Standards and Regulations
- 4.9 Porter's Five Forces Analysis
- 4.9.1 Bargaining Power of Suppliers
- 4.9.2 Bargaining Power of Buyers
- 4.9.3 Threat of New Entrants
- 4.9.4 Threat of Substitute Products
- 4.9.5 Intensity of Competitive Rivalry
5 MARKET SIZE AND GROWTH FORECASTS (VALUE)
- 5.1 By Material Type
- 5.1.1 Non-Biodegradable Bioplastics
- 5.1.1.1 Bio-PET
- 5.1.1.2 Bio-PE
- 5.1.1.3 Other Non-Biodegradable Bioplastics
- 5.1.2 Biodegradable Bioplastics
- 5.1.2.1 Starch Blends
- 5.1.2.2 Polylactic Acid (PLA)
- 5.1.2.3 Poly(Butylene Adipate-co-Terephthalate) (PBAT)
- 5.1.2.4 Polybutylene Succinate (PBS)
- 5.1.2.5 Polyhydroxyalkanoates (PHA)
- 5.1.2.6 Other Biodegradable Bioplastics
- 5.1.1 Non-Biodegradable Bioplastics
- 5.2 By Product Type
- 5.2.1 Rigid Packaging
- 5.2.1.1 Bottles and Jars
- 5.2.1.2 Trays and Containers
- 5.2.1.3 Other Rigid Packaging
- 5.2.2 Flexible Packaging
- 5.2.2.1 Films and Wraps
- 5.2.2.2 Pouches and Bags
- 5.2.2.3 Other Flexible Packaging
- 5.2.1 Rigid Packaging
- 5.3 By End-Use Industry
- 5.3.1 Food
- 5.3.2 Beverages
- 5.3.3 Pharmaceuticals
- 5.3.4 Personal Care and Cosmetics
- 5.3.5 Other End - Use Industry
- 5.4 By Distribution Channel
- 5.4.1 Direct Sales
- 5.4.2 Indirect Sales
- 5.5 By Geography
- 5.5.1 North America
- 5.5.1.1 United States
- 5.5.1.2 Canada
- 5.5.1.3 Mexico
- 5.5.2 Europe
- 5.5.2.1 Germany
- 5.5.2.2 United Kingdom
- 5.5.2.3 France
- 5.5.2.4 Italy
- 5.5.2.5 Spain
- 5.5.2.6 Russia
- 5.5.2.7 Rest of Europe
- 5.5.3 Asia-Pacific
- 5.5.3.1 China
- 5.5.3.2 India
- 5.5.3.3 Japan
- 5.5.3.4 South Korea
- 5.5.3.5 Australia and New Zealand
- 5.5.3.6 Rest of Asia-Pacific
- 5.5.4 Middle East and Africa
- 5.5.4.1 Middle East
- 5.5.4.1.1 United Arab Emirates
- 5.5.4.1.2 Saudi Arabia
- 5.5.4.1.3 Turkey
- 5.5.4.1.4 Rest of Middle East
- 5.5.4.2 Africa
- 5.5.4.2.1 South Africa
- 5.5.4.2.2 Nigeria
- 5.5.4.2.3 Egypt
- 5.5.4.2.4 Rest of Africa
- 5.5.5 South America
- 5.5.5.1 Brazil
- 5.5.5.2 Argentina
- 5.5.5.3 Rest of South America
- 5.5.1 North America
6 COMPETITIVE LANDSCAPE
- 6.1 Market Concentration
- 6.2 Strategic Moves and Developments
- 6.3 Market Share Analysis
- 6.4 Company Profiles (includes Global level Overview, Market level overview, Core Segments, Financials as available, Strategic Information, Market Rank/Share for key companies, Products and Services, and Recent Developments)
- 6.4.1 BIO PACKAGING FILMS
- 6.4.2 Folietec Kunststoffwerk AG
- 6.4.3 HUBEI HYF PACKAGING CO., LTD.
- 6.4.4 BIO FUTURA B.V.
- 6.4.5 PLABOTTLES.EU (GLOBAL SOLUTIONS B.V.)
- 6.4.6 FKUR KUNSTSTOFF GMBH
- 6.4.7 PACTIV EVERGREEN INC.
- 6.4.8 POUCH ME
- 6.4.9 GS-Company
- 6.4.10 GracePack
- 6.4.11 NaKu eU
- 6.4.12 Easy Green Eco Packaging Co., Ltd
- 6.4.13 Amcor Plc
- 6.4.14 PLAMFG
- 6.4.15 COMPAC SRL
- 6.4.16 Jarsking Group
- 6.4.17 Zhejiang Sanle Plastic Co.,Ltd
- 6.4.18 Shanghai COPAK Industry Co., LTD,
- 6.4.19 Greendot Biopak Pvt. Ltd.
- 6.4.20 Biogreen Biotech
7 MARKET OPPORTUNITIES AND FUTURE OUTLOOK
- 7.1 White-space and Unmet-need Assessment
 生質塑膠包裝市場:2026-2032年全球市場按產品類型、材料類型、應用和製造流程分類的預測
 竹製包裝市場規模、佔有率、成長及全球產業分析:按類型、應用和區域分類,預測2026-2034年
 生物分解感測器市場分析及預測(至2035年):按類型、產品類型、技術、組件、應用、材料類型、最終用戶、功能和安裝類型分類
 用於生質塑膠的生物塑膠市場:市場規模-按地區、應用和預測至2034年零廢棄生物發酵市場分析及預測(至2035年):依類型、產品、服務、技術、應用、製程、最終用戶、材料類型、設備及解決方案分類可生物分解紙和塑膠包裝市場:規模、佔有率、成長和全球產業分析:按類型、應用和地區分類,並預測至2026-2034年生質塑膠包裝市場規模、佔有率、成長及全球產業分析:按類型和應用分類,區域洞察及2026-2034年預測全球可生物分解紙和塑膠包裝市場規模、佔有率、趨勢和成長分析報告(2026-2034年)軟性包裝中的可生物分解生質塑膠:市場規模、平均價格和預測(2018-2034 年)
 2026年全球可生物分解紙和塑膠包裝市場報告