


 |
市場調查報告書
商品編碼
1851763
綠色包裝:市場佔有率分析、行業趨勢、統計數據和成長預測(2025-2030 年)Green Packaging - Market Share Analysis, Industry Trends & Statistics, Growth Forecasts (2025 - 2030) |
||||||
※ 本網頁內容可能與最新版本有所差異。詳細情況請與我們聯繫。
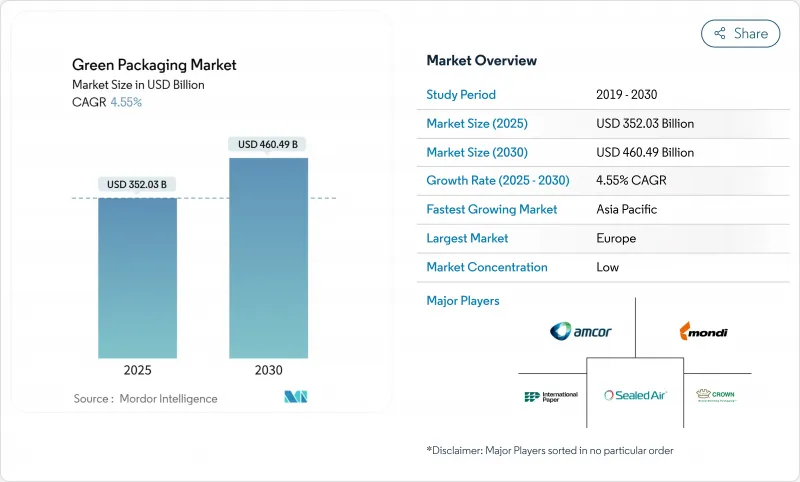
預計到 2025 年,綠色包裝市場價值將達到 3,520.3 億美元,到 2030 年將達到 4,604.9 億美元,年複合成長率為 4.55%。
這種穩定成長是多種因素共同作用的結果:歐盟的《包裝材料和包裝法規》(PPWR) 等具有約束力的法規、企業實現淨零包裝目標以及再生材料帶來的成本節約。
歐洲在政策嚴格性方面處於領先地位,包括強制要求在2030年實現全面回收、強制要求數位化可追溯性以及分階段實施回收率配額。亞太地區的需求成長最為迅速,印度、韓國和日本加快了消費成長並禁止使用一次性塑膠製品。在公司層面,全球規模為合規性、研發和多材料處理能力提供了支持,例如Smurfit Kappa和WestRock的合併以及Novolex和Pactiv Evergreen的合併。技術突破,特別是數位數位浮水印和先進聚合物化學技術,正在消除以往閉合迴路回收在品質和速度方面的限制。
全球綠色包裝市場趨勢與洞察
嚴格禁止使用一次性塑膠製品
歐盟、印度和智利加速推進相關政策,將大幅限制傳統聚合物的使用,並鼓勵即時轉向可堆肥薄膜和高回收率PET。俄羅斯將於2025年9月禁用某些類型的PET,歐盟已全面禁止在食品接觸包裝中使用雙酚A。印度法規將於2025年要求飲料瓶中含有30%的消費後回收材料,智利則要求到2060年達到70%,這將縮短創新週期,並將資本支出引導至海藻基材料和PHA混合物。韓國的海洋創新計畫展示了這些法規如何扶持擁有專利海洋生質能基材的新興企業,並證明了其市場可行性。加州的「生產者延伸責任制」計劃,在重複使用強制性規定的基礎上,正將材料替代從品牌要求轉變為競爭必需品。
企業環境、社會及治理 (ESG) 與淨零包裝承諾
品牌擁有者如今不再空談永續性,而是以遠超過監管標準的採購訂單來取代空洞的口號。波爾的目標是到2030年實現85%的回收率和90%的全球鋁回收率。聯合利華於2024年5月承諾,到2025年實現100%可回收、可重複使用或可堆肥的產品形式,並將設計改進與絕對的材料減量目標相結合,這無疑加大了供應商的壓力。歐萊雅設立了7,200萬歐元的基金來支持可回收新興企業,但該公司迄今的回收率僅49%。 Seven & i Holdings的「綠色挑戰2050」計畫旨在2030年使用50%的永續原料,並已與多個國家簽署承購協議,以證明其生產PHA和生物基PE專用生產線的必要性。一旦這些跨國公司設定了基準規範,二級供應商就必須遵守這些規範才能繼續留在核准供應商名單中。
生物基原料供應的限制
PLA、PHA 和澱粉衍生物的生產依賴農業投入,而這些投入又與食品和生質燃料的需求競爭。 SK Chemicals 和 NatureWorks 面臨玉米和糖價波動帶來的挑戰,這些波動會影響樹脂價格,導致生物聚合物在商品價格上漲期間競爭力下降。北美和歐洲有限的發酵和精煉能力造成了瓶頸,導致現貨供不應求,迫使加工商採用雙重採購或改用再生 PET。大規模產能擴張需要投資數億美元建造折舊免稅額長達十年的工廠,這阻礙了對需求激增的快速反應。季節性因素也會增加風險,因為收穫週期會影響年度產量,使庫存和現金流量管理更加複雜。
細分市場分析
在紙張、金屬、玻璃和PET回收系統成熟的支撐下,到2024年,再生材料解決方案將佔綠色包裝市場60.35%的佔有率。可分解包裝雖然目前規模較小,但其複合年成長率高達7.94%,並受益於即將實施的一次性塑膠禁令。目前的綠色包裝市場支持對回收和可分解包裝兩個方面的投資:回收利用可帶來即時的成本效益,而可分解包裝則能滿足未來更嚴格的消費後塑膠法規。主要的快速消費品企業正在選擇使用再生PET來實現瓶到瓶的循環利用,而快餐連鎖店則在試點使用可在海洋環境中分解的海藻吸管。透過利用可重複使用的桶子和木箱,各行業正在證明,在單一的綠色包裝市場架構中,產品的耐用性和材料的循環利用可以並存。
可重複使用的物流新興企業正在透過引入物聯網標籤的容器來降低人口密集城市走廊的整體成本,這些容器可在使用30次後重複使用。預計隨著德國PFAND計畫等大眾零售措施的推進,可重複使用系統的綠色包裝市場規模將持續成長。同時,Loop和Pa(fyll)正在將其押金返還模式擴展到美妝和家居領域,證明消費者的便利性可以與循環經濟的要求相契合。可回收、可分解和可重複使用設計之間的相互作用,既能使收入來源多元化,又能有效抵禦原料價格波動帶來的影響。
2024年,可回收PET、HDPE和PP將佔總收入的68.24%,這主要得益於路邊回收的廣泛覆蓋以及飲料巨頭對瓶裝級rPET的需求。 Indorama和酵母宣布擴大機械和化學回收規模,這將為滿足歐盟再生材料含量基準值提供必要的原料。然而,PLA和PHA的複合年成長率將達到8.45%,這主要受政策禁令、企業試點計畫以及具有冷凍庫級阻隔性能的新型混合物的推動。紙張和紙板將憑藉防油防水的奈米纖維素塗層重新奪回市場佔有率,為快餐店提供氟化學品的替代方案。預計先進纖維基綠色包裝的市場規模將在電子商務通路中成長最快,因為在電商通路,尺寸品質比貨架上的視覺吸引力更為重要。
玻璃和金屬的無限可回收性使其在高階飲料和化妝品領域佔據了一席之地,品牌股權足以彌補重量上的劣勢。隨著波爾公司85%的再生材料含量目標確保了合約需求,鋁材的使用量將呈上升趨勢。相反,由於拆卸成本超過回收價值,多層複合材料的市場佔有率將會下降,這將促使品牌所有者轉向整體式聚乙烯(PE)和聚丙烯(PP)解決方案。因此,在綠色包裝市場中,材料替代決策必須在功能性、成本和合規性之間取得平衡,以滿足每種應用的需求。
綠色包裝市場報告按包裝類型(再生材料包裝、可重複使用包裝、可分解包裝)、材料(紙和紙板、玻璃、其他)、包裝功能(一級、二級、其他)、最終用戶行業(食品、食品飲料、其他)和地區(北美、歐洲、亞太、南美、中東和非洲)進行細分。
區域分析
在《塑膠包裝可回收性指令》(PPWR)的推動下,歐洲在2024年維持了36.54%的市佔率。該指令要求在2030年實現完全可回收,且再生塑膠含量達30%。德國的押金返還率超過98%,確保了瓶到瓶循環利用過程中PET塑膠的高品質;而法國2025年的《再利用法案》將加速灌裝基礎設施的建設。北歐的創新企業正在引入纖維基阻隔層數位浮水印,為該地區成熟的零售網路樹立了功能性標竿。然而,複雜的跨境合規要求給中小企業帶來了沉重的負擔,他們必須在27個不同的司法管轄區內協調標籤檢視、再生塑膠含量和報告標準。
亞太地區到2030年將以8.32%的複合年成長率成為成長最快的地區,這主要得益於人口密度快速成長和都市區消費的推動。印度的包裝產業目標是到2025年達到2,048.1億美元,並正在加強QR碼溯源,以遏制非正規回收。日本奢侈品牌正在採用生物基PET(生物基PET)生產化妝品瓶,而韓國的食品廢棄物分類率已超過90%,並正在推進可堆肥包裝的報廢處理。為了維持市場進入,中國以出口為導向的加工企業正在努力符合歐盟標準,並透過區域供應基地來滿足更嚴格的規範要求。然而,生物基樹脂的快速普及導致供應趨緊,促使泰國和印尼等國成立合資企業,以實現PLA(聚乳酸)產能的在地化。
北美的發展勢頭喜憂參半。加州的生產者責任延伸制度(EPR)要求在2030年實現50%的產品可回收或可重複使用,並鼓勵大型零售商進行可重複填充試點計畫。加拿大的塑膠公約實現了50%的再生設計目標,但在下游分類基礎設施仍面臨挑戰。同時,像Novolex和Pactiv Evergreen這樣的合併案帶來了規模經濟效益,有助於應對各州不同的法律法規。墨西哥融入美國供應鏈,刺激了對再生紙廠的投資,也促使企業需要在成本和永續性之間取得平衡。這些動態使得北美大陸能夠選擇性地向前發展,而領先企業則在監管、消費者情緒和基礎設施的交匯點上匯聚。
其他好處
- Excel格式的市場預測(ME)表
- 3個月的分析師支持
目錄
第1章 引言
- 研究假設和市場定義
- 調查範圍
第2章調查方法
第3章執行摘要
第4章 市場情勢
- 市場概覽
- 市場促進因素
- 嚴格禁止使用一次性塑膠製品
- 企業環境、社會及治理 (ESG) 與淨零包裝承諾
- 透過減輕重量和回收來降低成本
- 數位浮水印可實現高速分揀
- 快速部署閉合迴路補給物流
- 市場限制
- 生物基原料供應的限制
- 與傳統包裝相比,單價更高
- 可堆肥材料的障礙和特徵局限性
- 堆肥/厭氧消化基礎設施分散。
- 供應鏈分析
- 監管環境
- 技術展望
- 波特五力分析
- 供應商的議價能力
- 買方的議價能力
- 新進入者的威脅
- 替代品的威脅
- 競爭對手之間的競爭
第5章 市場規模與成長預測
- 按包裝類型
- 可回收材料包裝
- 紙
- 金屬
- 塑膠
- 玻璃
- 可重複使用的包裝
- 鼓
- 塑膠週轉箱和IBC噸桶
- 托盤和墊材
- 可分解包裝
- 可堆肥生物聚合物
- 可食用/水溶性薄膜
- 可回收材料包裝
- 材料
- 紙和紙板
- 玻璃
- 金屬(鋁、鋼)
- 硬質和軟質再生塑膠
- 生物聚合物(PLA、PHA、澱粉混合物)
- 按最終用戶行業分類
- 食物
- 飲料
- 製藥
- 個人護理和化妝品
- 電子商務與零售
- 其他終端用戶產業
- 透過包裝功能
- 基本的
- 二次性
- 第三產業/交通運輸
- 按地區
- 北美洲
- 美國
- 加拿大
- 墨西哥
- 歐洲
- 德國
- 英國
- 法國
- 義大利
- 西班牙
- 俄羅斯
- 其他歐洲地區
- 亞太地區
- 中國
- 印度
- 日本
- 韓國
- 澳洲和紐西蘭
- 亞太其他地區
- 中東和非洲
- 中東
- 阿拉伯聯合大公國
- 沙烏地阿拉伯
- 土耳其
- 其他中東地區
- 非洲
- 南非
- 奈及利亞
- 埃及
- 其他非洲地區
- 南美洲
- 巴西
- 阿根廷
- 其他南美洲
- 北美洲
第6章 競爭情勢
- 市場集中度
- 策略趨勢
- 市佔率分析
- 公司簡介
- Amcor PLC
- Mondi Group
- Tetra Pak International SA
- International Paper Co.(DS Smith PLC)
- Smurfit WestRock
- Ball Corporation
- Crown Holdings Inc.
- Ardagh Group SA
- Sealed Air Corporation
- Sonoco Products Co.
- Uflex Ltd.
- Plastipak Holdings Inc.
- Brambles Ltd.(CHEP)
- IFCO Systems
- Menasha Corporation
- Emerald Packaging
- Elopak ASA
第7章 市場機會與未來展望
The green packaging market size stood at USD 352.03 billion in 2025 and is forecast to reach USD 460.49 billion by 2030, expanding at a 4.55% CAGR.This steady growth results from converging forces: binding regulations such as the European Union's PPWR, corporate net-zero packaging targets, and cost reduction from recycled feedstocks.
Europe leads in policy stringency, mandating full recyclability by 2030, compulsory digital traceability, and step-wise recycled-content quotas. Asia-Pacific delivers the fastest incremental demand as India, South Korea, and Japan combine expanding consumption with escalating bans on single-use plastics. At the company level, megamergers such as Smurfit Kappa-WestRock and Novolex-Pactiv Evergreen signal that global scale now underpins compliance, R&D, and multi-material capabilities. Technology breakthroughs-particularly digital watermarking and advanced polymer chemistry-remove earlier quality and speed constraints in closed-loop recycling.
Global Green Packaging Market Trends and Insights
Stringent bans on single-use plastics
Accelerated policy roll-outs across the European Union, India, and Chile sharply limit legacy polymers and stimulate immediate switches to compostable films and high-recycled-content PET. Russia's September 2025 prohibition on specific PET items and the EU's blanket ban on Bisphenol A in food contact packaging wipe out entire material categories, forcing converters to fast-track biopolymer commercialisation. Indian rules introduce 30% post-consumer recycled content for beverage bottles in 2025, while Chile pushes the requirement to 70% by 2060, compressing innovation cycles and redirecting CAPEX toward seaweed-based and PHA blends. South Korea's Marine Innovation illustrates how these rules nurture startups that hold patents for ocean-biomass substrates, proving market-ready viability. California's extended producer responsibility regime layers on reuse mandates, turning material substitution into a competitive necessity rather than a branding exercise.
Corporate ESG and net-zero packaging pledges
Brand owners now translate sustainability rhetoric into purchase orders that exceed regulatory floors. Ball Corporation is moving to 85% recycled content by 2030 and targets a 90% global aluminum recycling rate, effectively guaranteeing demand for secondary smelter output. Unilever's May 2024 pledge to achieve 100% recyclable, reusable, or compostable formats by 2025 combines design changes with absolute material reduction targets, amplifying pressure on suppliers. L'Oreal's EUR 72 million fund backs recycling start-ups despite the company only hitting 49% recyclability so far, indicating that capital is migrating toward scalable solutions rather than incremental tweaks. Seven & i Holdings' GREEN CHALLENGE 2050 specifies 50% sustainable inputs by 2030, anchoring multi-country offtake agreements that justify dedicated production lines for PHA or bio-PE. Once these multinationals set baseline specifications, tier-2 suppliers must comply to remain on approved vendor lists.
Bio-based feedstock supply constraints
PLA, PHA, and starch derivatives hinge on agricultural inputs that compete with food and biofuel demand. SK Chemicals and NatureWorks face corn and sugar price volatility that dictates resin pricing, making biopolymers less competitive during commodity spikes. Limited fermentation and purification assets in North America and Europe create bottlenecks that lead to spot shortages, forcing converters to dual-source or revert to recycled PET. Large-scale capacity additions require multi-hundred-million-dollar plants with decade-long depreciation, dampening rapid response to demand surges. Seasonality compounds risk as harvest cycles shape annual throughput, complicating inventory and cash-flow management.
Other drivers and restraints analyzed in the detailed report include:
- Cost savings from light-weighting and recycling
- Digital watermarking enabling high-speed sortation
- Higher unit costs vs. legacy packaging
For complete list of drivers and restraints, kindly check the Table Of Contents.
Segment Analysis
Recycled-content solutions retained 60.35% of the green packaging market in 2024, supported by mature collection systems for paper, metal, glass, and PET. Degradable formats, while smaller now, are pacing a 7.94% CAGR and benefit from imminent bans on single-use plastics. The current green packaging market supports investment in both streams because recycling delivers immediate cost advantages whereas degradables future-proof against stricter end-of-life rules. Primary adopters in FMCG select recycled PET for bottle-to-bottle loops, while QSR chains pilot seaweed-based straws that degrade in marine settings. Industrial players leverage reusable drums and crates, demonstrating that longevity and material circularity can coexist within a single green packaging market architecture.
Start-ups in refill logistics deploy IoT-tagged containers that cycle through 30 uses before refurbishment, driving total cost downward across high-density urban corridors. The green packaging market size for reusable systems is projected to climb alongside mass-retail initiatives such as Germany's PFAND scheme. In parallel, Loop and Pa(fyll) extend deposit-and-return models into beauty and household segments, evidence that consumer convenience can align with circularity mandates. Collectively, the interplay of recycled, degradable, and reusable designs diversifies revenue pools while creating hedges against raw-material shocks.
Recyclable PET, HDPE, and PP combine for 68.24% of 2024 revenue thanks to wide curbside coverage and bottle-grade rPET demand from beverage majors. Mechanical and chemical recycling expansions announced by Indorama and Eastman supply the feedstock required to reach EU recycled-content thresholds. However, PLA and PHA post an 8.45% CAGR, leveraged by policy bans, corporate pilots, and new blends that achieve freezer-grade barrier properties. Paper and paperboard regain share via nano-cellulose coatings that repel grease and water, giving quick-service restaurants an alternative to fluorinated chemistries. The green packaging market size for advanced fibre substrates is projected to expand fastest in e-commerce channels where dimensional quality outranks visual shelf appeal.
Glass and metal's infinite recyclability secures niche positions in premium beverages and cosmetics where brand equity offsets weight penalties. Aluminum trends up as Ball Corporation's 85% recycled-content target guarantees contracted demand. Conversely, multilayer laminates lose share because disassembly costs outweigh recycling value, propelling brand owners to mono-material PE or PP solutions. Material substitution decisions thus hinge on balancing functionality, cost, and compliance within each green packaging market application.
The Green Packaging Market Report is Segmented by Packaging Type (Recycled Content Packaging, Reusable Packaging, Degradable Packaging), Material (Paper and Paperboard, Glass and More), Packaging Function (Primary, Secondary, and More), End User Industry (Food, Beverage, and More), and Geography (North America, Europe, Asia-Pacific, South America, Middle East and Africa).
Geography Analysis
Europe maintained a 36.54% share in 2024, propelled by the PPWR mandate that compels full recyclability by 2030 and 30% recycled plastic content. Germany's deposit return rate surpasses 98%, ensuring high-quality PET for bottle-to-bottle loops, while France's 2025 reuse legislation accelerates refill infrastructure. Nordic innovators deploy fibre-based barriers and digital watermarks, setting functional benchmarks for the region's sophisticated retail networks. Complex cross-border compliance, however, burdens SMEs that must align labelling, recycled-content, and reporting standards across 27 jurisdictions.
Asia-Pacific delivers the fastest 8.32% CAGR through 2030 as population density and urban consumption surge. India's packaging sector aims for USD 204.81 billion by 2025 and enforces QR-code traceability to curb informal recycling practices. Japan's premium brands adopt bio-PET in cosmetic bottles, while South Korea records over 90% food-waste separation, enabling compostable packaging end-of-life processing. China's export-oriented converters move to meet EU compliance so they can retain market access, cascading stricter specifications through regional supply bases. Rapid uptake, though, strains bio-resin supply, fostering joint ventures in Thailand and Indonesia to localise PLA capacity.
North America shows mixed momentum. California's EPR rules mandate 50% recyclable or reusable design by 2030 and incentivise refill pilots from big-box retailers. Canada's Plastics Pact reaches 50% design-for-recycling but still struggles with downstream sorting infrastructure. Meanwhile, mergers such as Novolex-Pactiv Evergreen embed scale advantages in navigating disparate state laws. Mexico's integration into US supply chains draws investment in recycled-paper mills, aligning cost and sustainability imperatives. These dynamics position the continent to advance selectively, with leadership pockets clustered where regulation, consumer sentiment, and infrastructure intersect.
- Amcor PLC
- Mondi Group
- Tetra Pak International SA
- International Paper Co. (DS Smith PLC)
- Smurfit WestRock
- Ball Corporation
- Crown Holdings Inc.
- Ardagh Group SA
- Sealed Air Corporation
- Sonoco Products Co.
- Uflex Ltd.
- Plastipak Holdings Inc.
- Brambles Ltd. (CHEP)
- IFCO Systems
- Menasha Corporation
- Emerald Packaging
- Elopak ASA
Additional Benefits:
- The market estimate (ME) sheet in Excel format
- 3 months of analyst support
TABLE OF CONTENTS
1 INTRODUCTION
- 1.1 Study Assumptions and Market Definition
- 1.2 Scope of the Study
2 RESEARCH METHODOLOGY
3 EXECUTIVE SUMMARY
4 MARKET LANDSCAPE
- 4.1 Market Overview
- 4.2 Market Drivers
- 4.2.1 Stringent bans on single-use plastics
- 4.2.2 Corporate ESG and net-zero packaging pledges
- 4.2.3 Cost savings from light-weighting and recycling
- 4.2.4 Digital watermarking enabling high-speed sortation
- 4.2.5 Rapid roll-out of closed-loop refill logistics
- 4.3 Market Restraints
- 4.3.1 Bio-based feedstock supply constraints
- 4.3.2 Higher unit costs vs. legacy packaging
- 4.3.3 Barrier-property limitations in compostables
- 4.3.4 Patchy composting / anaerobic-digestion infra
- 4.4 Supply-Chain Analysis
- 4.5 Regulatory Landscape
- 4.6 Technological Outlook
- 4.7 Porter's Five Forces Analysis
- 4.7.1 Bargaining Power of Suppliers
- 4.7.2 Bargaining Power of Buyers
- 4.7.3 Threat of New Entrants
- 4.7.4 Threat of Substitutes
- 4.7.5 Intensity of Competitive Rivalry
5 MARKET SIZE AND GROWTH FORECASTS (VALUE)
- 5.1 By Packaging Type
- 5.1.1 Recycled-Content Packaging
- 5.1.1.1 Paper
- 5.1.1.2 Metal
- 5.1.1.3 Plastic
- 5.1.1.4 Glass
- 5.1.2 Reusable Packaging
- 5.1.2.1 Drums
- 5.1.2.2 Plastic Crates and IBCs
- 5.1.2.3 Pallets and Dunnage
- 5.1.3 Degradable Packaging
- 5.1.3.1 Compostable Biopolymers
- 5.1.3.2 Edible and Water-soluble Films
- 5.1.1 Recycled-Content Packaging
- 5.2 By Material
- 5.2.1 Paper and Paperboard
- 5.2.2 Glass
- 5.2.3 Metals (Al, Steel)
- 5.2.4 Rigid and Flexible Recyclable Plastics
- 5.2.5 Biopolymers (PLA, PHA, Starch blends)
- 5.3 By End-User Industry
- 5.3.1 Food
- 5.3.2 Beverage
- 5.3.3 Pharmaceutical
- 5.3.4 Personal Care and Cosmetics
- 5.3.5 E-commerce and Retail
- 5.3.6 Other End-User Industry
- 5.4 By Packaging Function
- 5.4.1 Primary
- 5.4.2 Secondary
- 5.4.3 Tertiary / Transport
- 5.5 By Geography
- 5.5.1 North America
- 5.5.1.1 United States
- 5.5.1.2 Canada
- 5.5.1.3 Mexico
- 5.5.2 Europe
- 5.5.2.1 Germany
- 5.5.2.2 United Kingdom
- 5.5.2.3 France
- 5.5.2.4 Italy
- 5.5.2.5 Spain
- 5.5.2.6 Russia
- 5.5.2.7 Rest of Europe
- 5.5.3 Asia-Pacific
- 5.5.3.1 China
- 5.5.3.2 India
- 5.5.3.3 Japan
- 5.5.3.4 South Korea
- 5.5.3.5 Australia and New Zealand
- 5.5.3.6 Rest of Asia-Pacific
- 5.5.4 Middle East and Africa
- 5.5.4.1 Middle East
- 5.5.4.1.1 United Arab Emirates
- 5.5.4.1.2 Saudi Arabia
- 5.5.4.1.3 Turkey
- 5.5.4.1.4 Rest of Middle East
- 5.5.4.2 Africa
- 5.5.4.2.1 South Africa
- 5.5.4.2.2 Nigeria
- 5.5.4.2.3 Egypt
- 5.5.4.2.4 Rest of Africa
- 5.5.5 South America
- 5.5.5.1 Brazil
- 5.5.5.2 Argentina
- 5.5.5.3 Rest of South America
- 5.5.1 North America
6 COMPETITIVE LANDSCAPE
- 6.1 Market Concentration
- 6.2 Strategic Moves
- 6.3 Market Share Analysis
- 6.4 Company Profiles (includes Global level Overview, Market level overview, Core Segments, Financials as available, Strategic Information, Market Rank/Share for key companies, Products and Services, and Recent Developments)
- 6.4.1 Amcor PLC
- 6.4.2 Mondi Group
- 6.4.3 Tetra Pak International SA
- 6.4.4 International Paper Co. (DS Smith PLC)
- 6.4.5 Smurfit WestRock
- 6.4.6 Ball Corporation
- 6.4.7 Crown Holdings Inc.
- 6.4.8 Ardagh Group SA
- 6.4.9 Sealed Air Corporation
- 6.4.10 Sonoco Products Co.
- 6.4.11 Uflex Ltd.
- 6.4.12 Plastipak Holdings Inc.
- 6.4.13 Brambles Ltd. (CHEP)
- 6.4.14 IFCO Systems
- 6.4.15 Menasha Corporation
- 6.4.16 Emerald Packaging
- 6.4.17 Elopak ASA
7 MARKET OPPORTUNITIES AND FUTURE OUTLOOK
- 7.1 White-space and Unmet-Need Assessment
 綠色包裝市場:2026-2032年全球市場預測(依材料、包裝類型、終端用戶產業及通路分類)綠色軟性包裝市場:依材料、包裝類型、結構、應用和銷售管道分類-2026-2032年全球市場預測
 綠色包裝市場報告:按包裝類型、最終用途行業和地區分類(2026-2034 年)
 全球單一材料包裝薄膜市場(至2030年):按類型(PE、PP、PET、PVC)、包裝形式(袋裝、薄膜及包裝膜、捲材及片材)、終端用戶行業(食品飲料、個人護理及化妝品、醫藥及醫療)及地區分類
 單一材料包裝市場預測至2034年—按材料類型、包裝類型、形式、技術、最終用戶和地區分類的全球分析植物來源包裝市場預測至2034年-全球材料、包裝類型、包裝形式、通路、應用、最終用戶和區域分析
 全球植物來源包裝市場:市場規模、佔有率、成長率和行業分析:按材料類型、包裝類型、最終用途和區域預測(至2034年)
 回收半導體封裝市場分析及預測(至2035年):依類型、產品類型、服務、技術、組件、應用、材料類型、製程、最終用戶分類綠色包裝市場分析及預測(至2035年):依類型、產品類型、材料類型、技術、應用、製程、最終用戶、採用情形及解決方案分類
 再生包裝市場規模、佔有率、成長及全球產業分析:按類型、應用和地區的洞察,2026-2034年預測