


 |
市場調查報告書
商品編碼
1851744
威脅情報:市場佔有率分析、產業趨勢、統計數據和成長預測(2025-2030 年)Threat Intelligence - Market Share Analysis, Industry Trends & Statistics, Growth Forecasts (2025 - 2030) |
||||||
※ 本網頁內容可能與最新版本有所差異。詳細情況請與我們聯繫。
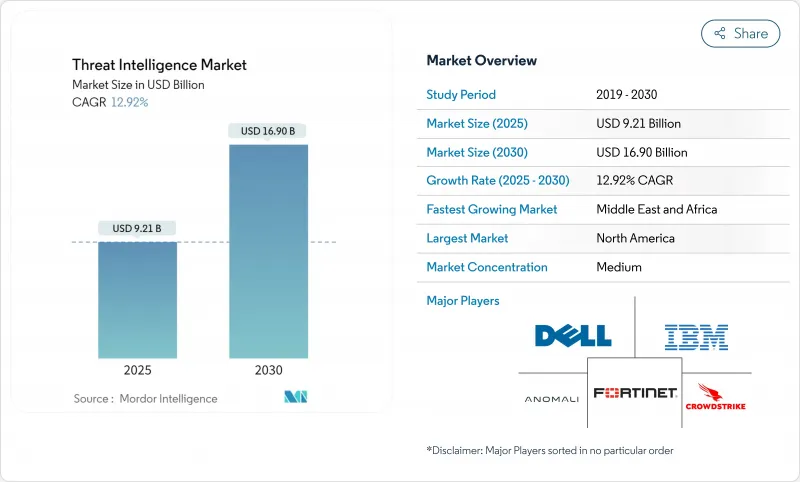
預計到 2025 年,威脅情報市場規模將達到 92.1 億美元,到 2030 年將達到 169 億美元,複合年成長率為 12.92%。
雲端技術的日益普及、攻擊者對人工智慧的快速應用,以及歐盟網路資訊安全指令(EU-NIS2 Directive)等監管框架的不斷完善,都在推動主動情報平台領域的投資成長。安全領導者正優先考慮富含上下文資訊的分析,以加快響應速度並降低安全漏洞成本;與此同時,保險公司和投資者在評估網路風險之前,也擴大審查即時情報資訊。儘管主要供應商之間的整合正在擴大平台範圍,但在需要特定行業情報時,專業供應商仍然發揮著至關重要的作用。威脅情況依然動盪不安,國家級網路活動活性化,資金籌措勒索軟體集團,這些因素共同推動了所有關鍵領域的持續投資。
全球威脅情報市場趨勢與洞察
AI主導的多態惡意軟體瞄準雲端原生工作負載
人工智慧產生的多態惡意軟體能夠動態重寫程式碼,繞過傳統的特徵碼偵測工具,迫使防禦者依賴行為分析。 IBM 的研究表明,此類惡意軟體現在無需人工干預即可進行勒索談判,並根據雲端配置改變策略,這使得事件回應更加複雜。美國司法部近期搗毀了一個利用人工智慧漏洞竊取價值 2.63 億美元加密貨幣的組織,凸顯了此類金融風險的巨大程度。北美企業正在增加機器學習偵測方面的預算,這使得威脅情報市場對於保護雲端工作負載至關重要。
關鍵基礎設施營運商的歐盟-NIS2合規支出
NIS2指令將於2024年10月生效,屆時約30萬家歐洲營業單位將需要進行風險評估、事件報告和供應鏈審計。違規罰款最高可達1000萬歐元或全球營業額的2%,將促使董事會優先考慮即時情報。歐盟以外的跨國公司在服務歐盟客戶時也需要遵守該指令,這為提供符合審核要求的情報資料來源的供應商創造了商機。
傳統SOC中的STIX/TAXII互通性差距
儘管 STIX 和 TAXII 已於 2021 年成為 OASIS 標準,但許多傳統平台仍然使用專有格式,阻礙了資料的無縫共用。研究表明,整合複雜性和不一致的編碼是主要障礙。因此,企業正在推遲平台升級並削減短期支出。
細分市場分析
平台型威脅情報市場佔據主導地位,其解決方案在2024年佔據全球收入的56%。光是微軟Defender威脅情報每天就能處理78兆個訊號,凸顯了其規模優勢。這項優勢也解釋了為何基於平台的威脅情報市場規模預計將持續成長至2030年。領先的供應商正在將人工智慧融入行為分析,從而減輕分析師的工作量並提高偵測的準確性。
託管服務和專業服務以14.5%的複合年成長率超過了產品成長速度,反映出人才短缺和日益複雜的市場環境。 SANS的研究表明,許多公司正在將威脅情報搜尋功能外包以彌補技能缺口。尤其是在威脅情報產業的中端市場,將實施與培訓相結合的夥伴關係能夠為買家提供更快的價值,並推動服務的普及。
到2024年,本地部署將佔總支出的55%,因為監管嚴格的行業更傾向於本地資料儲存。儘管如此,雲端託管平台仍以16.8%的複合年成長率成長,顯示市場對服務提供者的安全加固和FedRAMP擴展充滿信心,微軟Defender威脅情報已獲得「高」級認證。業內人士預計,在預測期的後半段,基於雲端的威脅情報市場將超越本地部署市場。
混合方法將傳統感測器與SaaS分析結合,吸引了那些以自身節奏進行現代化改造的組織。隨著金融監管機構發布安全雲採用藍圖,其中特別提到了持續智慧的整合,這種趨勢正在加速發展。
區域分析
北美地區預計到2024年將佔全球收入的38%,這主要得益於成熟的雲端運算應用、公私資訊共用以及廠商的積極佈局。各州立法機構正在推進資訊自由法案,而聯邦機構則在支援即時數據交換平台,這將增強威脅情報市場。針對雲端工作負載的AI惡意軟體仍然是該地區的首要關注點,相關平台的支出仍然強勁。
在歐洲,隨著NIS2的強制實施,威脅情報市場規模從2萬家公司擴大到30萬家,前景更加光明。諸如《網路彈性法案》等配套法規進一步推動了整個供應鏈持續漏洞資訊的需求。能夠提供包含多語言威脅資料且可直接用於審核的彙報的供應商將佔據有利地位。
到2030年,中東地區的複合年成長率將達到15.8%,是全球成長最快的地區。阿拉伯聯合大公國和沙烏地阿拉伯的國家機構正在投資建立特定產業的融合中心,能源巨頭也因即時數據流而獲得了網路保險折扣。該地區日益緊張的地緣政治局勢,提升了威脅情報市場對公共和私營部門的戰略價值。
亞太地區的網路攻擊數量正以兩位數的速度成長,尤其是在印度尼西亞,每週發生的攻擊事件超過 3300 起。快速的數位化加上各國不同的主權規則,導致需求分散:日本、韓國和澳洲正在主導零信任試點項目,將即時情報納入存取決策;而中國和印度的資料本地化法律則更傾向於使用國內雲端節點。
在南美洲,中型銀行、金融服務和保險機構(BFSI)透過外包威脅搜尋來克服技能短缺,從而推動了威脅搜尋技術的普及,並在較小規模上提高了全球收入。
其他福利:
- Excel格式的市場預測(ME)表
- 3個月的分析師支持
目錄
第1章 引言
- 研究假設和市場定義
- 調查範圍
第2章調查方法
第3章執行摘要
第4章 市場情勢
- 市場概覽
- 市場促進因素
- AI驅動的多態惡意軟體瞄準北美雲端原生工作負載
- 關鍵基礎設施營運商為遵守歐盟NIS2法規而進行的支出
- 亞太大型企業零信任部署
- RaaS卡特爾推動加密錢包監控的需求
- 為一家中型南美銀行、金融服務和保險機構提供威脅狩獵外包服務
- 網路保險保費折扣與即時威脅保障掛鉤(中東能源)
- 市場限制
- 傳統SOC中的STIX/TAXII互通性差距
- 可操作情報數據的訂閱成本不斷上漲
- 資料主權障礙(中國CSL、印度DPDP等)
- 資源受限團隊中的分析師疲勞和警報過載
- 監理展望
- 技術展望
- 波特五力分析
- 新進入者的威脅
- 買方的議價能力
- 供應商的議價能力
- 替代品的威脅
- 競爭對手之間的競爭
- 評估宏觀經濟因素對市場的影響
第5章 市場規模與成長預測
- 按組件
- 解決方案
- 威脅情報平台
- 安全資訊和事件管理 (SIEM) 資訊流
- 威脅狩獵/分析工具
- 服務
- 託管/外包服務
- 專業諮詢
- 培訓和支持
- 解決方案
- 透過部署
- 本地部署
- 雲
- 混合
- 按威脅情報類型
- 策略
- 戰術上的
- 手術
- 技術的
- 按組織規模
- 主要企業
- 小型企業
- 按最終用戶行業分類
- BFSI
- 資訊科技/通訊
- 零售與電子商務
- 製造業
- 醫療保健和生命科學
- 政府/國防
- 能源與公共產業
- 其他
- 按地區
- 北美洲
- 美國
- 加拿大
- 墨西哥
- 南美洲
- 巴西
- 阿根廷
- 智利
- 秘魯
- 其他南美洲
- 歐洲
- 德國
- 英國
- 法國
- 義大利
- 西班牙
- 其他歐洲地區
- 亞太地區
- 中國
- 日本
- 韓國
- 印度
- 澳洲
- 紐西蘭
- 亞太其他地區
- 中東
- 阿拉伯聯合大公國
- 沙烏地阿拉伯
- 土耳其
- 其他中東地區
- 非洲
- 南非
- 其他非洲地區
- 北美洲
第6章 競爭情勢
- Strategic Developments
- Vendor Positioning Analysis
- 公司簡介
- IBM Corporation
- Cisco Systems Inc.
- Dell Technologies Inc.
- CrowdStrike Holdings Inc.
- Check Point Software Technologies Ltd.
- Trend Micro Incorporated
- Palo Alto Networks Inc.
- Fortinet Inc.
- Rapid7 Inc.
- Secureworks Inc.
- FireEye-Trellix
- Recorded Future Inc.
- Anomali Inc.
- LookingGlass Cyber Solutions Inc.
- LogRhythm Inc.
- McAfee LLC
- Broadcom Inc.(Symantec)
- Juniper Networks Inc.
- F-Secure Corporation
- SentinelOne Inc.
- Microsoft Corp.(Defender Threat Intelligence)
第7章 市場機會與未來展望
The threat intelligence market is valued at USD 9.21 billion in 2025 and is forecast to reach USD 16.90 billion by 2030, reflecting a CAGR of 12.92%.
Expanding cloud adoption, rapid attacker use of AI, and tighter regulatory frameworks such as the EU-NIS2 directive are lifting spending on proactive intelligence platforms. Security leaders are prioritizing context-rich analytics that shorten response times and lower breach costs, while insurers and investors now examine live intelligence feeds before underwriting cyber risk. Consolidation among large vendors is accelerating platform breadth, yet specialist providers remain relevant where sector-specific intelligence is required. Heightened nation-state activity and ransomware cartel funding through cryptocurrencies are expected to keep the threat environment volatile, sustaining investment momentum across every major vertical.
Global Threat Intelligence Market Trends and Insights
AI-driven Polymorphic Malware Targeting Cloud-Native Workloads
AI-generated polymorphic malware can rewrite its code on the fly, defeating traditional signature tools and forcing defenders to rely on behavioural analytics. IBM research shows such malware now negotiates ransoms without human contact and pivots tactics based on cloud configuration, complicating incident response. The U.S. Department of Justice recently dismantled a ring that stole USD 263 million in cryptocurrency through AI-enabled exploits, underscoring the financial risk. North American enterprises are boosting budget for machine-learning detection, making the threat intelligence market essential for cloud workload protection.
EU-NIS2 Compliance Spend by Critical Infrastructure Operators
Effective October 2024, the NIS2 directive subjects roughly 300,000 European entities to mandatory risk assessments, incident reporting, and supply-chain scrutiny. Penalties can reach EUR 10 million or 2% of global turnover, pushing boards to prioritise real-time intelligence. Multinationals outside the bloc must also comply when serving EU customers, widening opportunity for vendors that package ready-to-audit intelligence feeds.
STIX/TAXII Interoperability Gaps in Legacy SOCs
Although STIX and TAXII became OASIS standards in 2021, many legacy platforms still process proprietary formats, preventing seamless data sharing. An exploratory study identified integration complexity and inconsistent notation as primary hurdles. As a result, organisations delay platform upgrades, restraining short-term spending.
Other drivers and restraints analyzed in the detailed report include:
- Zero Trust Roll-outs in APAC Large Enterprises
- RaaS Cartels Fuelling Crypto-Wallet Monitoring Demand
- Escalating Subscription Costs for Actionable Intel Data
For complete list of drivers and restraints, kindly check the Table Of Contents.
Segment Analysis
Solutions generated 56% of global revenue in 2024, giving platforms an outsized hold on the threat intelligence market. Microsoft Defender Threat Intelligence alone processes 78 trillion signals per day, highlighting scale advantages. This dominance underlines why the threat intelligence market size attached to platforms is expected to keep rising through 2030. Leading vendors incorporate AI for behaviour analytics, easing analyst workload and improving detection fidelity.
Managed and professional services are outpacing product growth with a 14.5% CAGR, reflecting talent shortages and rising complexity. SANS surveys show many enterprises outsource hunting duties to close skill gaps. Partnerships that wrap training around deployments allow buyers to derive quicker value, propelling service uptake, especially across the threat intelligence industry's mid-market segment.
On-premise deployments held 55% of spending in 2024 as heavily regulated sectors prefer local data residency. Even so, cloud-hosted platforms are the fastest riser at 16.8% CAGR, signalling confidence in provider hardening and FedRAMP expansions such as Microsoft Defender Threat Intelligence gaining High attestation. Segment observers see the threat intelligence market size for cloud deliveries eclipsing on-premise totals late in the forecast window.
Hybrid approaches blend legacy sensors with SaaS analytics, appealing to organisations modernising at their own pace. Financial regulators now publish blueprints for secure cloud adoption that specifically mention continuous intelligence integration, accelerating momentum.
The Threat Intelligence Market Report is Segmented by Component (Solutions, and Services), Deployment (On-Premise, Cloud, and Hybrid), Threat-Intelligence Type (Strategic, Tactical, Operational, and Technical), Organization Size (Large Enterprises, and Small and Medium-Sized Enterprises), End-User Industry (BFSI, IT and Telecommunications, and More), and Geography. The Market Forecasts are Provided in Terms of Value (USD).
Geography Analysis
North America commanded 38% of 2024 revenue owing to mature cloud uptake, joint public-private information sharing, and deep vendor presence. Legislators continue to refine disclosure laws, while federal bodies sponsor real-time data-exchange platforms that reinforce the threat intelligence market. AI-enabled malware against cloud workloads remains the top regional concern, keeping platform spending buoyant.
Europe's outlook brightens under NIS2, which scales mandatory coverage from 20 000 to 300 000 entities, greatly enlarging the addressable threat intelligence market. Complementary legislation such as the Cyber Resilience Act furthers demand for continuous vulnerability context across supply chains. Vendors that package audit-ready reporting with multi-lingual threat data are well positioned.
The Middle East shows the fastest CAGR at 15.8% through 2030. National agencies in the UAE and Saudi Arabia invest in sector-focused fusion centres while energy majors receive cyber-insurance discounts tied to live feeds. Rising geopolitical tension in the region elevates the strategic value of the threat intelligence market for both public and private sectors.
Asia-Pacific sees a double-digit attack uptick, notably in Indonesia where weekly incidents top 3,300. Rapid digitalisation, paired with diverse sovereignty rules, produces fragmented demand. Japan, South Korea, and Australia lead Zero Trust pilots that embed live intelligence into access decisions, while China and India's data-localisation laws create preferences for in-country cloud nodes.
South America's adoption is spurred by mid-tier BFSI outsourcing threat-hunting to overcome skills shortages, adding to global revenue even if from a smaller base.
- IBM Corporation
- Cisco Systems Inc.
- Dell Technologies Inc.
- CrowdStrike Holdings Inc.
- Check Point Software Technologies Ltd.
- Trend Micro Incorporated
- Palo Alto Networks Inc.
- Fortinet Inc.
- Rapid7 Inc.
- Secureworks Inc.
- FireEye - Trellix
- Recorded Future Inc.
- Anomali Inc.
- LookingGlass Cyber Solutions Inc.
- LogRhythm Inc.
- McAfee LLC
- Broadcom Inc. (Symantec)
- Juniper Networks Inc.
- F-Secure Corporation
- SentinelOne Inc.
- Microsoft Corp. (Defender Threat Intelligence)
Additional Benefits:
- The market estimate (ME) sheet in Excel format
- 3 months of analyst support
TABLE OF CONTENTS
1 Introduction
- 1.1 Study Assumptions and Market Definition
- 1.2 Scope of the Study
2 Research Methodology
3 Executive Summary
4 Market Landscape
- 4.1 Market Overview
- 4.2 Market Drivers
- 4.2.1 AI-Driven Polymorphic Malware Targeting Cloud-Native Workloads in North America
- 4.2.2 EU-NIS2 Compliance Spend by Critical Infrastructure Operators
- 4.2.3 Zero-Trust Roll-outs in APAC Large Enterprises
- 4.2.4 RaaS Cartels Fueling Crypto-Wallet Monitoring Demand
- 4.2.5 Outsourced Threat-Hunting by South-American Mid-Tier BFSI
- 4.2.6 Cyber-Insurance Premium Discounts Tied to Live Threat Feeds (Middle East Energy)
- 4.3 Market Restraints
- 4.3.1 STIX/TAXII Interoperability Gaps in Legacy SOCs
- 4.3.2 Escalating Subscription Costs for Actionable Intel Data
- 4.3.3 Data-Sovereignty Barriers (China CSL, India DPDP, etc.)
- 4.3.4 Analyst Fatigue and Alert Overload in Resource-Constrained Teams
- 4.4 Regulatory Outlook
- 4.5 Technological Outlook
- 4.6 Porter's Five Forces Analysis
- 4.6.1 Threat of New Entrants
- 4.6.2 Bargaining Power of Buyers
- 4.6.3 Bargaining Power of Suppliers
- 4.6.4 Threat of Substitute Products
- 4.6.5 Intensity of Competitive Rivalry
- 4.7 Assessment of the Impact of Macroeconomic Factors on the Market
5 Market Size and Growth Forecasts (Value)
- 5.1 By Component
- 5.1.1 Solutions
- 5.1.1.1 Threat Intelligence Platforms
- 5.1.1.2 Security Information and Event Management (SIEM) Feeds
- 5.1.1.3 Threat Hunting/Analytics Tools
- 5.1.2 Services
- 5.1.2.1 Managed/Outsourced Services
- 5.1.2.2 Professional and Consulting
- 5.1.2.3 Training and Support
- 5.1.1 Solutions
- 5.2 By Deployment
- 5.2.1 On-premise
- 5.2.2 Cloud
- 5.2.3 Hybrid
- 5.3 By Threat-Intelligence Type
- 5.3.1 Strategic
- 5.3.2 Tactical
- 5.3.3 Operational
- 5.3.4 Technical
- 5.4 By Organization Size
- 5.4.1 Large Enterprises
- 5.4.2 Small and Medium-Sized Enterprises
- 5.5 By End-user Industry
- 5.5.1 BFSI
- 5.5.2 IT and Telecommunications
- 5.5.3 Retail and E-commerce
- 5.5.4 Manufacturing
- 5.5.5 Healthcare and Life Sciences
- 5.5.6 Government and Defense
- 5.5.7 Energy and Utilities
- 5.5.8 Others
- 5.6 By Geography
- 5.6.1 North America
- 5.6.1.1 United States
- 5.6.1.2 Canada
- 5.6.1.3 Mexico
- 5.6.2 South America
- 5.6.2.1 Brazil
- 5.6.2.2 Argentina
- 5.6.2.3 Chile
- 5.6.2.4 Peru
- 5.6.2.5 Rest of South America
- 5.6.3 Europe
- 5.6.3.1 Germany
- 5.6.3.2 United Kingdom
- 5.6.3.3 France
- 5.6.3.4 Italy
- 5.6.3.5 Spain
- 5.6.3.6 Rest of Europe
- 5.6.4 Asia-Pacific
- 5.6.4.1 China
- 5.6.4.2 Japan
- 5.6.4.3 South Korea
- 5.6.4.4 India
- 5.6.4.5 Australia
- 5.6.4.6 New Zealand
- 5.6.4.7 Rest of Asia-Pacific
- 5.6.5 Middle East
- 5.6.5.1 United Arab Emirates
- 5.6.5.2 Saudi Arabia
- 5.6.5.3 Turkey
- 5.6.5.4 Rest of Middle East
- 5.6.6 Africa
- 5.6.6.1 South Africa
- 5.6.6.2 Rest of Africa
- 5.6.1 North America
6 Competitive Landscape
- 6.1 Strategic Developments
- 6.2 Vendor Positioning Analysis
- 6.3 Company Profiles (includes Global level Overview, Market level overview, Core Segments, Financials as available, Strategic Information, Products and Services, and Recent Developments)
- 6.3.1 IBM Corporation
- 6.3.2 Cisco Systems Inc.
- 6.3.3 Dell Technologies Inc.
- 6.3.4 CrowdStrike Holdings Inc.
- 6.3.5 Check Point Software Technologies Ltd.
- 6.3.6 Trend Micro Incorporated
- 6.3.7 Palo Alto Networks Inc.
- 6.3.8 Fortinet Inc.
- 6.3.9 Rapid7 Inc.
- 6.3.10 Secureworks Inc.
- 6.3.11 FireEye - Trellix
- 6.3.12 Recorded Future Inc.
- 6.3.13 Anomali Inc.
- 6.3.14 LookingGlass Cyber Solutions Inc.
- 6.3.15 LogRhythm Inc.
- 6.3.16 McAfee LLC
- 6.3.17 Broadcom Inc. (Symantec)
- 6.3.18 Juniper Networks Inc.
- 6.3.19 F-Secure Corporation
- 6.3.20 SentinelOne Inc.
- 6.3.21 Microsoft Corp. (Defender Threat Intelligence)
7 Market Opportunities and Future Outlook
- 7.1 White-space and Unmet-Need Assessment
 威脅情報市場:依組件、威脅情報類型、應用、部署模式和組織規模分類-2026年至2032年全球市場預測威脅建模工具市場:按組件、部署模式、用例、組織規模和產業分類-2026-2032年全球市場預測
 威脅建模工具市場分析及預測(至 2035 年):類型、產品類型、服務、技術、組件、應用、部署模式、最終用戶、功能、解決方案威脅情報市場分析及預測(至 2035 年):類型、產品類型、服務、技術、組件、應用、部署模式、最終用戶、解決方案、交付模式
 2026年全球威脅欺騙平台市場報告2026年全球人工智慧驅動威脅情報市場報告2026年全球威脅情報市場報告
 威脅情報市場規模、佔有率和成長分析(按解決方案、部署類型、組織規模、組件、最終用戶產業和地區分類)-2026-2033年產業預測
 威脅情報市場規模、佔有率、成長及全球產業分析:依類型、應用和地區劃分的洞察與預測(2026-2034 年)
 全球基於人工智慧的網路威脅情報市場:預測至 2032 年——按組件、部署類型、組織規模、應用、最終用戶和地區進行分析