


 |
市場調查報告書
商品編碼
1851713
智慧廢棄物管理:市場佔有率分析、產業趨勢、統計數據和成長預測(2025-2030 年)Smart Waste Management - Market Share Analysis, Industry Trends & Statistics, Growth Forecasts (2025 - 2030) |
||||||
※ 本網頁內容可能與最新版本有所差異。詳細情況請與我們聯繫。
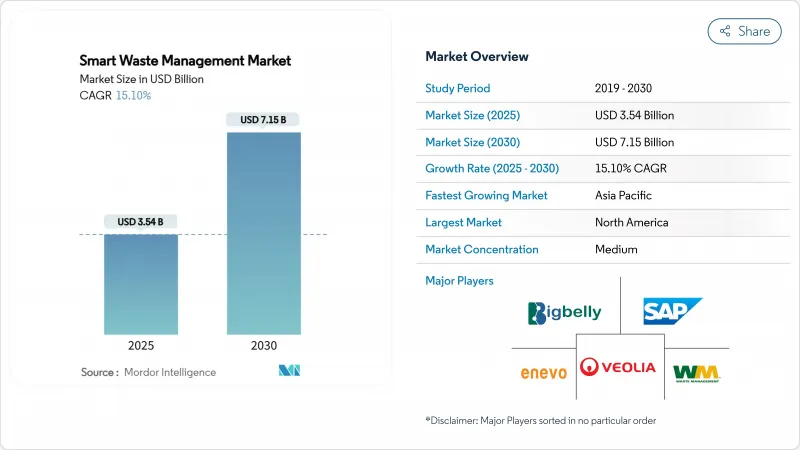
預計到 2025 年,智慧廢棄物管理市場規模將達到 35.4 億美元,到 2030 年將成長至 71.5 億美元,在此期間的複合年成長率為 15.1%。
快速的都市化、日益嚴格的碳排放法規以及掩埋的垃圾掩埋費,使得數據驅動的廢棄物服務成為城市的一項必要支出,而非可有可無的升級選項。物聯網感測器價格的下降、5G和低功耗廣域網路(LPWAN)覆蓋範圍的擴大以及人工智慧平台的日趨成熟,使得即時垃圾收集過程得以可視化,這不僅有助於城市降低燃料成本,還能展現其對循環經濟法規的遵守。碳權計畫如今已將回收的有機垃圾貨幣化,而計量收費模式則為城市提供了新的經常性收入來源。創業投資人正將大量資金投入人工智慧機器人分類新興企業,而現有垃圾運輸企業也正在加速整合以確保技術實力,從而創造出一個創新與規模並存的平衡環境。
全球智慧廢棄物管理市場趨勢與洞察
數據主導的路線最佳化可降低燃油消耗
即時料位感測器和人工智慧路線規劃引擎可將車輛行駛里程減少 25%,柴油消費量減少 10%。動態路線規劃避免了清空半滿箱的習慣,從而在保持正常服務的同時,減少了交通堵塞和二氧化碳排放。車隊管理人員更傾向於使用能夠視覺化預測料位曲線的雲端儀錶板,以便工作人員僅在有利時才離開料場。該模型在人口密集的都市區網格和郊區都能靈活擴展,因此對預算緊張的公共部門極具吸引力。隨著碳定價機制的日益普及,檢驗的燃油節省量還可以轉化為可交易的排碳權,進一步增強了基於感測器的最佳化技術的投資價值。
小費制度可提高地方政府的投資報酬率
馬薩諸塞州和緬因州的城鎮採用按量付費(PAYT)模式,已將垃圾噸位減少了44%,並將垃圾收整合本從房產稅轉移到了用戶直接付費。安裝在垃圾桶上的荷重元會傳輸重量數據,計費系統會將這些數據轉換為家庭帳單,從而形成一個透明的回饋循環,鼓勵居民進行垃圾回收。財務負責人讚賞該模式將服務使用量與成本回收掛鉤,從而穩定預算;而環保人士則強調了僅對產生的廢棄物收費所帶來的社會公平效益。該系統能夠產生穩定的現金流,這些現金流可以再投資於感測器部署和回收基礎設施建設,從而在智慧廢棄物管理市場中形成減少廢棄物和增強財務韌性的良性循環。
老舊車輛的維修成本很高
對感測器、遠端資訊處理系統、液壓系統和稱重感測器進行全面升級,每輛卡車的成本可能高達 25,000 美元,這給市政財政造成了巨大壓力,尤其是在依賴老舊車隊的較小轄區。分散的駕駛室佈局和專有的車載電腦需要客製化介面,這延長了安裝週期並推高了人事費用。這迫使城市根據車輛更換週期分階段部署,從而抑制了依賴數據密度的網路效應。供應商推出了將硬體攤銷打包到月費中的訂閱模式,但資產負債表的限制導致採用率不均衡,抑制了智慧廢棄物管理市場各細分領域的成長潛力。
細分市場分析
到2024年,分析和彙報將佔智慧廢棄物管理市場32%的佔有率,到2030年將以17.21%的複合年成長率成長。城市正逐漸採用雲端儀錶板,將原始感測器讀數轉化為易於理解的關鍵績效指標(KPI),例如漏收警報、每噸垃圾的燃油消費量和溫室氣體減排量。預測模型整合了歷史收集趨勢、天氣模式和事件日曆,提前數天安排動態路線,從而提高卡車運轉率和居民滿意度。車隊管理模組疊加即時GPS軌跡和診斷警報,最大限度地減少計劃外停機時間,延長資產使用壽命。行動工作人員工具則為駕駛室平板電腦提供逐嚮導航更新,從而在分析洞察和現場執行之間形成反饋閉迴路。
不同解決方案支柱的整合產生了協同效應:資產管理引擎根據行人足跡資料推薦最佳垃圾箱擺放位置;遠端監控系統可對威脅回收品質的污染事件發出警報;人工智慧視訊分析可檢測非法傾倒事件並將帶有地理標記的證據傳輸給執法部門。這種跨模組工作流程增加了供應商的轉換成本,從而鞏固了供應商的地位並提高了合約總額,進而支撐了智慧廢棄物管理市場強勁的收入成長動能。
預計到2024年,軟體產品將佔智慧廢棄物管理市場規模的41%,並在2030年之前以20.11%的複合年成長率加速成長,因為市政當局為了避免巨額資本支出而採用訂閱定價模式。雲端架構提供無線功能更新和網路安全補丁,無需現場維護。供應商API可實現與城市ERP系統、碳排放登記系統和市民報告應用程式的即插即用連接,從而釋放網路效應,擴大目標用戶群。雖然硬體仍然是資料收集的核心,但通用感測器的價格逐年下降,使得支出結構向軟體功能和增值分析方向轉變。
隨著整合商制定變革管理藍圖、培訓員工並監控資料品質儀表板,服務收入也同步成長。託管服務協議將保障、分析最佳化和合規性報告打包成可預測的月費,使供應商的獎勵與客戶的最終成果保持一致。這種經常性收入模式吸引了私募股權的投資興趣,並推動了產業整合,重塑了智慧廢棄物管理市場的競爭格局。
智慧廢棄物管理系統市場報告按解決方案(車隊管理、遠端監控、分析、其他)、組件(硬體、軟體、其他)、廢棄物類型(工業廢棄物、生活廢棄物、其他)、應用(智慧收集、智慧處理、其他)、部署(雲端基礎、本地部署)和地區進行細分。
區域分析
到2024年,北美將佔據智慧廢棄物管理市場38%的佔有率,這主要得益於成熟的通訊網路、早期碳定價機制以及聯邦政府津貼智慧城市部署而提供的基礎設施津貼。 Big Belly公司的太陽能小型垃圾桶已展現出顯著的成本節約優勢,在紐約和波士頓等地,垃圾收集量減少了高達80%。加拿大的有機物分流抵銷通訊協定允許像SusGlobal位於貝爾維爾的工廠這樣的計劃將10.5萬個檢驗信用額度貨幣化,從而縮短投資回收期。此外,區域卡車運輸公司也正在利用《通貨膨脹削減法案》提供的清潔車隊稅額扣抵,加速電動卡車與感測器路線規劃軟體結合的試點計畫。
亞太地區是成長最快的地區,年複合成長率達16.7%,主要得益於都市化和各國數位基礎建設項目的推動。日本川越市部署了配備太陽能電池板、壓縮機和蜂窩數據機的SmaGO垃圾桶,這些設備可將垃圾桶的滿溢狀態傳輸至控制室,從而減少了旅遊區的垃圾溢出申訴。韓國加強了RoHS框架,推動了對人工智慧分類技術的投資。中國的「零廢棄城市」試點計畫透過整合感測器網路,顯著減少了垃圾掩埋量和二氧化碳排放量。多邊金融機構提供優惠貸款,將廢棄物管理硬體、網路連接和分析功能打包,降低了二線城市的進入門檻,並擴大了整體智慧廢棄物管理市場。
由於二十年來不斷發展的循環經濟政策,歐洲在循環經濟領域維持了強勁的普及勢頭。 《巴塞爾公約》的合規性、不斷上漲的掩埋稅以及嚴格的回收目標,正迫使各市政當局對每一噸垃圾進行數位追蹤。威立雅集團斥資40億歐元推出的「綠色升級」計劃,透過實施先進的危險廢棄物追蹤和資源回收系統,展現了其大規模推進循環經濟的承諾。威立雅的廢棄物焚化發電廠正在整合碳捕獲模組和即時排放儀表板,以支援歐盟的永續財務資訊揭露要求,這充分體現了合規性與技術如何協同運作。跨國合作計畫正在規範應用程式介面(API)模式,並將垃圾桶感測器資料提供給各國統計機構,進一步建構了該地區智慧廢棄物管理市場的數位基礎設施。
美國是北美智慧廢棄物管理市場中最大的國家。其領先地位得益於各大城市和市政當局廣泛實施的策略性廢棄物管理計畫。預計到2024年,美國對智慧廢棄物管理解決方案的接受度很高。推動美國市場成長的因素包括政府為促進永續性所做的努力、智慧城市廢棄物管理舉措在高度都市化地區的普及,以及對高效廢棄物收集和處理方法的日益重視。
加拿大是智慧廢棄物管理解決方案的快速成長市場,預計2024年至2029年年平均成長率約為13%。該市場以工業化進程加快和住宅區規模擴大為特徵,從而催生了對智慧廢棄物管理解決方案的強勁需求。加拿大各城市和市政當局正積極尋求創新解決方案,以應對廢棄物管理挑戰、提高效率並促進永續性。政府為創造更清潔的環境和減少廢棄物而採取的各項舉措,正在推動加拿大各地智慧廢棄物管理系統的普及應用。
歐洲已展現出對智慧廢棄物管理解決方案的堅定承諾,這得益於全部區域不斷進步的環境政策和技術創新。市場格局涵蓋德國、英國、法國、西班牙和義大利等主要國家,它們都為區域市場的發展做出了重要貢獻。該地區的成長動力來自日益加快的都市化、日益嚴格的廢棄物管理法規以及智慧城市廢棄物管理舉措的廣泛應用。
德國在歐洲智慧廢棄物管理市場佔據領先地位,預計2024年將佔約21%的市場。德國的領先地位歸功於其先進的廢棄物管理基礎設施和對技術創新的高度重視。德國採用五階段廢棄物等級制度:預防、再利用準備、回收、替代回收方式及處置。
英國預計將成為歐洲成長潛力最大的國家,2024年至2029年的預期成長率約為18%。該國市場的快速擴張得益於感測器、物聯網設備和數據分析技術的日益普及,這些技術旨在最佳化廢棄物收集並提高效率。英國致力於環境永續性和智慧城市廢棄物管理,因此對智慧廢棄物管理技術進行了大量投資,尤其是在都市區。
亞太地區是智慧廢棄物管理解決方案的活力市場,其特點是快速的都市化、日益增強的環保意識以及政府舉措的不斷增加。主要市場包括中國、印度、澳洲和日本,它們各自為該地區的市場發展做出了獨特的貢獻。推動該地區轉型發展的因素包括智慧城市廢棄物管理措施、日益成長的環境問題以及快速發展的都市區對高效廢棄物管理系統的需求。
中國已成為亞太地區最大的市場,展現出對智慧廢棄物管理解決方案的強勁需求。中國在市場上的領先地位得益於智慧城市廢棄物管理技術的廣泛應用以及對廢棄物管理基礎設施的大量投資。國務院致力於建造零廢棄物城市,並將人工智慧融入廢棄物管理系統,這體現了中國對先進廢棄物管理解決方案的堅定承諾。
澳洲是亞太地區成長最快的市場,在智慧廢棄物管理方面取得了顯著進展。該國的成長得益於其對永續性和環境保護措施的高度重視。人工智慧智慧廢棄物系統和先進廢棄物分類技術的引入,體現了澳洲致力於創新廢棄物管理解決方案的決心,尤其是在都市區。
世界其他地區,包括拉丁美洲、中東和非洲,也擴大採用智慧廢棄物管理解決方案。快速的都市化、工業化以及人們對永續廢棄物管理實踐日益成長的興趣,是這些地區市場成長的關鍵促進因素。儘管市場仍在發展中,但對智慧城市廢棄物管理專案的大量投資,尤其是在中東地區,正在為智慧廢棄物管理解決方案創造新的機會。在該地區,阿拉伯聯合大公國處於市場領先地位,而巴西則展現出最快的成長潛力,這得益於智慧城市技術的日益普及以及政府為推廣永續廢棄物管理實踐而採取的舉措。
其他福利:
- Excel格式的市場預測(ME)表
- 3個月的分析師支持
目錄
第1章 引言
- 研究假設和市場定義
- 調查範圍
第2章調查方法
第3章執行摘要
第4章 市場洞察
- 市場概覽
- 產業吸引力:波特五力分析
- 供應商的議價能力
- 買方的議價能力
- 新進入者的威脅
- 替代品的威脅
- 競爭對手之間的競爭
- 新冠疫情副作用及其他宏觀經濟因素對市場的影響
第5章 市場動態
- 市場促進因素
- 廢棄物量增加推動市場發展
- 智慧城市的日益普及將刺激市場發展。
- 市場挑戰
- 高昂的實施成本
第6章 技術概覽
- 技術概述
- 創新技術革新廢棄物管理
- 智慧廢棄物管理階段 - 按連接器
- 智慧廢棄物管理市場中的感測器應用
- 智慧廢棄物管理階段
- 智慧收藏
- 智慧處理
- 智慧型能源回收
- 智慧處理
第7章 市場區隔
- 透過解決方案
- 車隊管理
- 遠端監控
- 分析
- 廢棄物類型
- 工業廢棄物
- 生活廢棄物
- 按地區
- 北美洲
- 美國
- 加拿大
- 歐洲
- 德國
- 英國
- 法國
- 西班牙
- 義大利
- 亞洲
- 印度
- 中國
- 澳洲
- 日本
- 澳洲和紐西蘭
- 拉丁美洲
- 中東和非洲
- 北美洲
第8章 競爭情勢
- 公司簡介
- SAP SE
- Veolia Environmental Services
- Enevo
- Waste Management Inc.
- Bigbelly Inc.
- Covanta Holding Corporation
- Evoeco
- Pepperl+Fuchs GmbH
- IBM Corporation
- BIN-e
第9章 投資分析
第10章:市場的未來
The smart waste management market size stood at USD 3.54 billion in 2025 and is forecast to rise to USD 7.15 billion by 2030, translating to a 15.1% CAGR during the period.
Rapid urbanisation, tightening carbon regulations and mounting landfill levies make data-driven waste services a fiscal necessity for municipalities rather than an optional upgrade. Lower IoT sensor prices, wider 5G and LPWAN footprints and maturing AI platforms enable real-time collection visibility that slashes fuel expenditure while proving compliance with circular-economy rules. Carbon-credit programmes now monetise diverted organics, and pay-as-you-throw schemes give cities new recurring revenue streams. Venture investors channel capital into AI robotic-sorting start-ups, and incumbent haulers accelerate consolidation to secure technology capabilities, creating a balanced landscape where innovation and scale coexist.
Global Smart Waste Management Market Trends and Insights
Data-driven route optimisation cuts fuel use
Real-time fill-level sensors and AI routing engines shorten vehicle kilometres travelled by 25% and reduce diesel consumption by 10%, attacking the single largest controllable cost in collection operations. Dynamic routing ends the practice of emptying half-full bins, lessening traffic congestion and CO2 emissions while sustaining service regularity. Fleet managers prefer cloud dashboards that visualise predicted fill curves so that crews leave depots only when beneficial. The model scales gracefully across dense urban grids and suburban zones, proving attractive to budget-constrained public works departments. As carbon pricing gains traction, verified fuel savings also translate into tradable carbon credits, reinforcing the investment case for sensor-based optimisation.
Pay-as-you-throw programmes boost municipal ROI
Massachusetts and Maine towns applying PAYT have cut disposed tonnage by 44% and shifted collection costs from property taxes to direct user fees. Bin-mounted load cells transmit weight data that billing engines convert into household invoices, creating a transparent feedback loop that nudges residents toward recycling. Finance directors welcome the model's ability to stabilise budgets by linking service usage to cost recovery, while environmental officers highlight the social equity benefits of charging only for waste generated. The mechanism generates reliable cash flows that can be reinvested in sensor roll-outs or recycling infrastructure, reinforcing a virtuous cycle of waste minimisation and fiscal resilience within the smart waste management market.
High retrofit costs for legacy fleets
A complete sensor, telematics and hydraulic-weight-cell upgrade can reach USD 25,000 per truck, straining municipal capital limits, especially in smaller jurisdictions reliant on ageing vehicles. Fragmented cab-ling layouts and proprietary onboard computers demand custom interfaces, stretching installation timelines and inflating labour bills. Cities therefore phase deployments over replacement cycles, stalling network effects that depend on data density. Suppliers react with subscription models bundling hardware amortisation into monthly fees, yet balance-sheet restrictions keep adoption uneven, tempering growth potential within segments of the smart waste management market.
Other drivers and restraints analyzed in the detailed report include:
- Growth of smart-city budgets
- Stricter e-waste take-back mandates
- Patchy LPWAN / 5G coverage in rural routes
For complete list of drivers and restraints, kindly check the Table Of Contents.
Segment Analysis
Analytics and Reporting held 32% share of the smart waste management market in 2024 and is forecast to post a 17.21% CAGR through 2030. Cities gravitate to cloud dashboards that translate raw sensor readings into digestible KPIs such as missed pickup alerts, fuel burned per tonne and greenhouse-gas abatement. Predictive models ingest historical fill trends, weather patterns and event calendars to schedule dynamic routes days ahead, lifting truck utilisation rates and resident satisfaction simultaneously. Fleet-management modules overlay live GPS breadcrumbs and diagnostic alerts, minimising unscheduled downtime and extending asset life. Mobile workforce tools then deliver turn-by-turn updates to in-cab tablets, closing the feedback loop between analytics insights and frontline execution.
Synergies grow as separate solution pillars converge. Asset-management engines now recommend optimal bin-placement based on pedestrian footfall data, while remote monitoring flags contamination events that threaten recycling quality. AI video analytics spot illegal dumping incidents, forwarding geotagged evidence to enforcement teams. These cross-module workflows create switching costs that solidify vendor positions and expand total contract values, underpinning robust revenue momentum for the smart waste management market.
Software products captured 41% of the smart waste management market size in 2024 and are projected to accelerate at 20.11% CAGR to 2030 as municipalities embrace subscription pricing that sidesteps heavy capex. Cloud architectures deliver over-the-air feature updates and cybersecurity patches, eliminating field visits. Vendor APIs facilitate plug-and-play links with city ERPs, carbon registries and citizen-reporting apps, unlocking network effects that widen the addressable base. Hardware still underpins data capture, yet commoditised sensors fall in price each year, shifting the spending mix toward software functionality and value-added analytics.
Service revenue grows in tandem as integrators design change-management roadmaps, train crews, and monitor data-quality dashboards. Managed-service contracts bundle warranty, analytics tuning, and compliance reporting into predictable monthly fees, aligning supplier incentives with customer outcomes. This recurring-revenue profile attracts private-equity interest and fuels consolidation plays that reshape the competitive contours of the smart waste management market.
The Smart Waste Management System Market Report is Segmented by Solution (Fleet Management, Remote Monitoring, Analytics, and More), Component (Hardware, Software, and More), Waste Type (Industrial Waste, Residential Waste, and More), Application (Smart Collection, Smart Processing, and More), Deployment (Cloud-Based and On-Premises), and Geography.
Geography Analysis
North America held 38% of the smart waste management market share in 2024 on the back of mature telecom networks, early carbon-pricing schemes, and federal infrastructure grants that subsidise smart-city deployments. Bigbelly's solar compacting bins cut pickups by up to 80% in New York and Boston, validating cost savings that unlocked follow-on rollouts. Canada's offset protocol for organics diversion lets projects such as SusGlobal's Belleville facility monetise 105,000 verified credits, enhancing payback periods. Regional haulers also capitalise on the Inflation Reduction Act, which offers clean-fleet tax credits, accelerating electric-truck pilots tied to sensorised routing software.
Asia Pacific is the fastest-growing region at a 16.7% CAGR, propelled by urbanisation and national digital-infrastructure programmes. Japan's Kawagoe City deploys SmaGO bins equipped with solar panels, compressors and cellular modems that message fill status to control rooms, cutting overflow complaints at tourist sites. South Korea's tightened RoHS framework drives AI sorting investments, and China's Zero-Waste City pilots showcase measurable landfill and CO2 reductions via integrated sensor networks. Multilateral lenders provide concessional loans that bundle waste-management hardware, connectivity and analytics, lowering entry barriers for secondary-tier cities and expanding the overall smart waste management market.
Europe sustains robust adoption thanks to 20 years of circular-economy policy evolution. Basel-Convention conformity, landfill-tax escalators and aggressive recycling targets spur municipalities to track every tonne digitally. Veolia's EUR 4 billion GreenUp plan deploys advanced hazardous-waste tracking and resource-regeneration systems, signalling corporate commitment at scale veolia.com. Energy-from-waste plants integrate carbon-capture modules with real-time emissions dashboards that feed into EU sustainable-finance disclosures, showing how compliance and technology interlock. Cross-border initiatives standardise API schemas so bin-sensor data can feed national statistical agencies, further entrenching digital infrastructure across the region's smart waste management market.
The United States dominates the North American smart waste management market as the largest country segment. The nation's leadership position is supported by the extensive implementation of strategic waste management programs across major cities and municipalities. With approximately 88% share of the North American market in 2024, the United States demonstrates strong adoption of smart waste management solutions. The country's growth is driven by government initiatives promoting sustainability, the penetration of smart city waste management initiatives across highly urbanized regions, and an increasing focus on efficient waste collection and disposal practices.
Canada represents a growing market for smart waste management solutions, with a forecasted growth rate of approximately 13% from 2024 to 2029. The country's market is characterized by increasing industrialization and expansion of the residential sector, which creates substantial demand for smart waste management solutions. Canadian cities and municipalities are actively seeking innovative solutions to address waste management challenges, improve efficiency, and promote sustainability. The government's initiatives to create a clean environment and reduce waste material are driving the adoption of smart waste management systems across the country.
Europe demonstrates a strong commitment to smart waste management solutions, supported by progressive environmental policies and technological innovation across the region. The market landscape spans key countries, including Germany, the United Kingdom, France, Spain, and Italy, each contributing significantly to the regional market development. The region's growth is driven by increasing urbanization, stringent waste management regulations, and widespread adoption of smart city waste management initiatives.
Germany leads the European smart waste management market with approximately 21% share of the regional market in 2024. The country's dominance is attributed to its advanced waste management infrastructure and strong focus on technological innovation. Germany applies a five-stage waste hierarchy: prevention, reuse preparation, recycling, alternative forms of recovery, and disposal, making it one of the most advanced nations in terms of waste management technology and systems globally.
The United Kingdom exhibits the highest growth potential in the European region, with a projected growth rate of approximately 18% from 2024 to 2029. The country's rapid market expansion is driven by the increasing implementation of sensors, IoT devices, and data analytics to optimize waste collection and improve efficiency. The UK's commitment to environmental sustainability and smart city waste management initiatives has led to significant investments in smart waste management technologies, particularly in urban areas.
The Asia-Pacific region represents a dynamic market for smart waste management solutions, characterized by rapid urbanization, increasing environmental awareness, and growing government initiatives. Key markets include China, India, Australia, and Japan, each contributing uniquely to the regional market development. The region's transformation is driven by smart city waste management initiatives, rising environmental concerns, and the need for efficient waste management systems in rapidly growing urban areas.
China emerges as the largest market in the Asia-Pacific region, demonstrating strong adoption of smart waste management solutions. The country's leadership in the market is supported by extensive implementation of smart city waste management technologies and significant investments in waste management infrastructure. The Chinese State Council's initiatives for developing zero-waste cities and the integration of artificial intelligence in waste management systems showcase the country's commitment to advanced waste management solutions.
Australia represents the fastest-growing market in the Asia-Pacific region, showing remarkable progress in smart waste management adoption. The country's growth is driven by a strong focus on sustainability initiatives and environmental protection measures. The implementation of AI-powered smart waste systems and advanced waste sorting technologies demonstrates Australia's commitment to innovative waste management solutions, particularly in urban areas.
The Rest of the World region, encompassing Latin America, the Middle East, and Africa, shows increasing adoption of smart waste management solutions. The market growth in these regions is primarily driven by rapid urbanization, industrialization, and an increasing focus on sustainable waste management practices. While the market is still developing, significant investments in smart city waste management initiatives, particularly in the Middle East, are creating new opportunities for smart waste management solutions. The United Arab Emirates leads the market in this region, while Brazil shows the fastest growth potential, driven by increasing adoption of smart city technologies and government initiatives promoting sustainable waste management practices.
List of Companies Covered in this Report:
- SAP SE
- Veolia Environmental Services
- Enevo
- Waste Management Inc.
- Bigbelly Inc.
- Covanta Holding Corporation
- Evoeco
- Pepperl+Fuchs GmbH
- IBM Corporation
- BIN-e
Additional Benefits:
- The market estimate (ME) sheet in Excel format
- 3 months of analyst support
TABLE OF CONTENTS
1 INTRODUCTION
- 1.1 Study Assumptions and Market Definition
- 1.2 Scope of the Study
2 RESEARCH METHODOLOGY
3 EXECUTIVE SUMMARY
4 MARKET INSIGHTS
- 4.1 Market Overview
- 4.2 Industry Attractiveness - Porter's Five Forces Analysis
- 4.2.1 Bargaining Power of Suppliers
- 4.2.2 Bargaining Power of Buyers
- 4.2.3 Threat of New Entrants
- 4.2.4 Threat of Substitutes
- 4.2.5 Intensity of Competitive Rivalry
- 4.3 Impact of COVID-19 Aftereffects and Other Macroeconomic Factors on the Market
5 MARKET DYNAMICS
- 5.1 Market Drivers
- 5.1.1 Increasing Volumes of Waste to Boost the Market
- 5.1.2 Rising Adoption of Smart Cities to Flourish the Market
- 5.2 Market Challenges
- 5.2.1 High Costs of Implementation
6 Technology Snapshot
- 6.1 Technology Overview
- 6.2 Innovative Technologies Revolutionizing Waste Management
- 6.3 Smart Waste Management Stages - By Connectors
- 6.4 Application of Sensors in the Smart Waste Management Market
- 6.5 Smart Waste Management Stages
- 6.5.1 Smart Collection
- 6.5.2 Smart Processing
- 6.5.3 Smart Energy Recovery
- 6.5.4 Smart Disposal
7 MARKET SEGMENTATION
- 7.1 By Solution
- 7.1.1 Fleet Management
- 7.1.2 Remote Monitoring
- 7.1.3 Analytics
- 7.2 By Waste Type
- 7.2.1 Industrial Waste
- 7.2.2 Residential Waste
- 7.3 By Geography
- 7.3.1 North America
- 7.3.1.1 United States
- 7.3.1.2 Canada
- 7.3.2 Europe
- 7.3.2.1 Germany
- 7.3.2.2 United Kingdom
- 7.3.2.3 France
- 7.3.2.4 Spain
- 7.3.2.5 Italy
- 7.3.3 Asia
- 7.3.3.1 India
- 7.3.3.2 China
- 7.3.3.3 Australia
- 7.3.3.4 Japan
- 7.3.3.5 Australia and New Zealand
- 7.3.4 Latin America
- 7.3.5 Middle East and Africa
- 7.3.1 North America
8 COMPETITIVE LANDSCAPE
- 8.1 Company Profiles
- 8.1.1 SAP SE
- 8.1.2 Veolia Environmental Services
- 8.1.3 Enevo
- 8.1.4 Waste Management Inc.
- 8.1.5 Bigbelly Inc.
- 8.1.6 Covanta Holding Corporation
- 8.1.7 Evoeco
- 8.1.8 Pepperl+Fuchs GmbH
- 8.1.9 IBM Corporation
- 8.1.10 BIN-e
9 INVESTMENT ANALYSIS
10 FUTURE OF THE MARKET
 2032 年廢棄物網際網路和人工智慧廢棄物追蹤市場預測:按組件、廢棄物類型、部署、技術、最終用戶和地區進行的全球分析
 2025年智慧廢棄物管理全球市場報告
 智慧廢棄物管理市場按產品類型、廢棄物類型、製程類型、技術、最終用戶和部署模式分類 - 2025-2030 年全球預測智慧食品盒市場(按組件、產品類型、技術、應用和最終用戶分類)—2025 年至 2030 年全球預測
 全球智慧廢棄物管理市場規模(按廢棄物類型、方法、來源、區域覆蓋範圍和預測)
 智慧廢棄物管理市場規模、佔有率、趨勢及預測(按成分、廢棄物類型、方法、來源和地區),2025 年至 2033 年2032 年數位廢棄物管理解決方案市場預測:按組件、廢棄物類型、方法、技術、應用、最終用戶和地區進行的全球分析
 智慧廢棄物管理市場(全球)(2025-2029)
 區塊鏈廢棄物追蹤市場:到 2033 年的市場分析和預測 - 按類型、按產品、按服務、按技術、按組件、按應用、按流程、按部署、按最終用戶、按解決方案
 智慧廢棄物管理市場規模、佔有率、成長分析,按廢棄物類型、方法、來源、地區 - 產業預測,2024-2031