


 |
市場調查報告書
商品編碼
1851708
環境感測器:市場佔有率分析、行業趨勢、統計數據和成長預測(2025-2030 年)Environmental Sensors - Market Share Analysis, Industry Trends & Statistics, Growth Forecasts (2025 - 2030) |
||||||
※ 本網頁內容可能與最新版本有所差異。詳細情況請與我們聯繫。
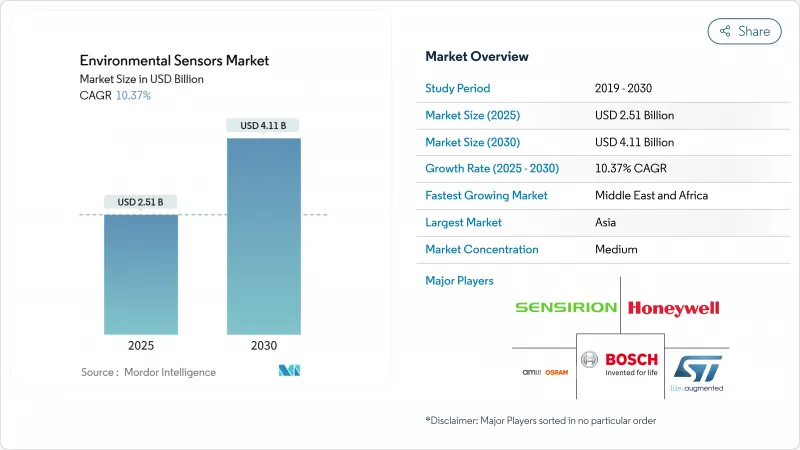
預計到 2025 年,環境感測器市場規模將達到 25.1 億美元,到 2030 年將達到 41.1 億美元,年複合成長率為 10.37%。
這一強勁的市場前景反映了嚴格的監管壓力、NB-IoT的快速部署及其在智慧城市、工業IoT和消費級穿戴裝置領域日益成長的應用。美國大型加速度計報告公司現在必須揭露範圍1和範圍2的溫室氣體排放,並需獲得第三方保證,加速了感測器在連續監測領域的應用。在歐洲,修訂後的《空氣品質指令》將於2025年3月生效,該指令要求成員國即時追蹤超細顆粒物,從而推動了對經濟高效的感測器網路的需求。亞太地區引領環境感測器市場,這主要得益於中國支持高密度城市監測的NB-IoT基礎設施;而北美則在野火探測網路和邊緣人工智慧平台方面引領著技術創新。半導體巨頭、小眾MEMS供應商和雲原生物聯網公司競相提供彈性、網路安全和自校準解決方案,市場競爭仍然激烈。
全球環境感測器市場趨勢與洞察
NB-IoT技術的日益普及推動了密集型城市感測器網路的發展(亞洲)
中國通訊業者目前營運超過9億個NB-IoT連接,並計劃在2030年將連接數擴展至19億。這種低功耗、廣域化的標準支援10年以上的電池壽命、深層室內穿透能力和授權頻譜的可靠性,使市政當局無需挖掘電纜溝即可覆蓋高層建築。從泰國到阿拉伯聯合大公國等鄰國正在採用這種模式,以加速智慧城市部署和ESG合規。
加強歐盟環境空氣品質指令 2023/2119 標準
2025年3月的指令將PM2.5年均濃度限值從25µg/m3降至10µg/m3,並強制要求監測超細顆粒物,這將迫使成員國用密集的感測器群來補充高成本的參考站。即時公共數據存取條款優先考慮能夠將測量數據流傳輸到中央控制面板的物聯網模組,從而刺激了對能夠達到±5µg/m3都市區霧霾測量精度的校準型MEMS單元的需求。
惡劣戶外環境下的校準漂移和維護成本
部署在戶外環境中的電化學感測器會因溫度波動、濕度波動以及暴露於干擾氣體而出現顯著的校準漂移,需要頻繁重新校準(有時甚至低至每三個月一次)才能保持可接受的精度。這種維護負擔會造成巨大的營運成本,在部署的第一年內就可能超過感測器的初始採購成本,尤其是在環境壓力會加速感測器劣化的惡劣氣候條件下。研究表明,超過90%的感測器在例行檢查中仍保持在校準規格範圍內,這表明目前的維護計劃過於保守,但由於違規的高昂成本,這些計劃又是必要的。
細分市場分析
固定式環境感測器在2024年將佔總收入的62%,這反映出工廠營運商需要持續證明其符合監管要求。壁掛式或管道式探頭可全天候向環境管理系統傳輸數據,供審核進行範圍1檢驗。可攜式設備雖然體積較小,但到2030年將以12.8%的複合年成長率成長,因為緊急服務部門、礦業公司和建築聯合體傾向於快速部署到瞬息萬變的工地。國防安全保障部的一項野火試點計畫表明,拖車式PM節點提供的前置作業時間比衛星影像快30分鐘,檢驗了行動網路的商業可行性。
可攜式正日益成為固定陣列的補充而非替代。例如,公用事業公司為了合規性而安裝有線二氧化硫(SO2)陣列,並在維修停機期間移除電池供電的揮發性有機化合物(VOC)偵測器。穿戴式裝置仍處於起步階段,但為消費性電子廠商(OEM)提供了一條以健康為中心的差異化途徑,可以將花粉計數和污染警報與健身儀錶板結合。在我們的預測週期內,我們預計結合永久基準和可移動叢集的混合架構將重新定義整個環境感測器市場的採購指南。
採用成熟的電化學電池和非分散紅外線(NDIR)光學技術的氣體分析儀,用於檢測工廠、隧道和鍋爐中的一氧化碳(CO)、氮氧化物(NOx)和揮發性有機化合物(VOCs),預計到2024年將佔據環境感測器市場佔有率的26%。同時,隨著公共衛生機構收緊PM2.5暴露基準值,顆粒物檢測儀器的複合年成長率(CAGR)預計將達到13.5%。受歐盟和加州指令(要求年均PM2.5濃度低於10µg/m3)的推動,PM測量儀器的環境感測器市場規模預計到2030年將達到10.1億美元。
溫度、濕度和壓力感測器仍然是應用廣泛的環境監測參數,通常與關鍵氣體或顆粒物監測功能整合在多參數模組中。 BoschSensortec的BME688整合了四個實體感測器和板載AI推理功能,可為先前購買分立元件的OEM廠商降低20%的材料成本。融合趨勢正在模糊以往的品類界限,推動採購轉向綜合性的“環境控制包”,而非單一參數的零件。
區域分析
亞太地區引領環境感測器市場,預計2024年營收將成長38%,這主要得益於中國和印度智慧大型企劃的推動,這些計畫將NB-IoT節點嵌入路燈、公車和學校等設施中。光是深圳一地就運作了超過37,000個空氣品質監測箱,並將資料連接到開放資料入口網站。強大的電子供應鏈正在降低材料成本,使得市政當局能夠以不到15,000美元的成本部署一平方公里的監測網路。日本和韓國的工廠正在部署先進的MEMS技術,而澳洲各州則在投資用於應對森林火災的PM和煙霧監測陣列。
以金額為準。由於美國證券交易委員會(SEC)的氣候資訊揭露要求以及加州、奧勒岡州和不列顛哥倫比亞省的野火應對資金,北美環境感測器市場正蓬勃發展。雲端邊緣合作關係蓬勃發展:Honeywell與亞德諾半導體公司達成的2024年協議將把建築自動化閘道器直接連接到Azure IoT中心,從而將整合時間縮短一半。根據CHIPS和《科學法案》提供的聯邦撥款將促進網路安全韌體的研發。
對PM2.5和超細顆粒物的更嚴格監管正在推動400多個城市進行感測器維修。德國正在將環境遙測數據與其工業4.0數位雙胞胎連接起來,北歐的公用事業公司則在區域供熱櫃中安裝露點陣列,以減少因冷凝造成的能源損失。在「地平線歐洲」計畫下,歐盟基金現在可以報銷高達75%的空氣品質監測網路成本,從而縮短部署前置作業時間。
中東和非洲目前僅佔個位數佔有率,但年複合成長率高達14.2%。海灣石油國家正在採用連續洩漏檢測技術發行與環境、社會和治理(ESG)掛鉤的債券,而南非採礦業正在試點使用低成本的顆粒物網,以加強職業安全審核。校準實驗室的匱乏仍然是一大障礙,但計劃於2026-2027年建成的捐助者資助的參考站將為內羅畢、阿克拉和拉各斯帶來大量訂單。
其他福利:
- Excel格式的市場預測(ME)表
- 3個月的分析師支持
目錄
第1章 引言
- 研究假設和市場定義
- 調查範圍
第2章調查方法
第3章執行摘要
第4章 市場情勢
- 市場概覽
- 市場促進因素
- NB-IoT 的普及使得密集型城市感測器網路成為可能(亞洲)
- 歐盟空氣品質指令2023/2119標準將加強
- ESG相關產業排放揭露義務(美國證券交易委員會,CSRD)
- 穿戴式裝置和聽覺裝置中多參數感測器模組的應用
- 綠色氫能和電池超級工廠的建設需要濕度/氣體感測器
- 利用分散式PM感測器的北美野火早期預警網路
- 市場限制
- 惡劣戶外環境下的校準漂移和維護成本
- 新興國家參考級校準基礎設施有限
- 雲端連接工業感測器的網路安全和智慧財產權問題
- MEMS元件的商品化導致價格下降
- 價值/供應鏈分析
- 監理與技術展望
- 波特五力分析
- 供應商的議價能力
- 消費者議價能力
- 新進入者的威脅
- 替代品的威脅
- 競爭對手之間的競爭
第5章 市場規模與成長預測
- 依產品類型
- 固定的
- 可攜式的
- 穿戴式裝置
- 透過感應類型
- 氣體
- 溫度
- 濕度
- 壓力
- 顆粒物(PM)
- 多參數模組
- 連結性別
- 有線
- 無線的
- 按最終用戶行業分類
- 產業
- 醫療保健
- 消費性電子產品
- 車
- 智慧家庭與建築
- 農業
- 其他最終用戶
- 按地區
- 北美洲
- 美國
- 加拿大
- 墨西哥
- 歐洲
- 英國
- 德國
- 法國
- 義大利
- 其他歐洲地區
- 亞太地區
- 中國
- 日本
- 印度
- 韓國
- 亞太其他地區
- 中東
- 以色列
- 沙烏地阿拉伯
- 阿拉伯聯合大公國
- 土耳其
- 其他中東地區
- 非洲
- 南非
- 埃及
- 其他非洲地區
- 南美洲
- 巴西
- 阿根廷
- 其他南美洲
- 北美洲
第6章 競爭情勢
- 市場集中度
- 策略趨勢
- 市佔率分析
- 公司簡介
- ams OSRAM AG
- Sensirion Holding AG
- Bosch Sensortec GmbH
- Honeywell International Inc.
- Texas Instruments Inc.
- Analog Devices Inc.
- STMicroelectronics NV
- NXP Semiconductors NV
- TDK Corporation(InvenSense)
- Omron Corporation
- Sensata Technologies Inc.
- AlphaSense Inc.
- Figaro Engineering Inc.
- Banner Engineering Corp.
- Renesas Electronics Corp.
- Teledyne FLIR LLC
- Hanwei Electronics Group Corp.
- Powelectrics Ltd.
- Eurotech SpA
- Omega Engineering Inc.
- Nesa Srl
- Eko Instruments BV
第7章 市場機會與未來展望
The environmental sensors market was valued at USD 2.51 billion in 2025 and is forecast to grow at a 10.37% CAGR, reaching USD 4.11 billion by 2030.
This robust outlook reflects intense regulatory pressure, rapid NB-IoT roll-outs, and widening adoption across smart cities, industrial IoT, and consumer wearables. Large accelerated filers in the United States must now disclose Scope 1 and Scope 2 greenhouse-gas emissions with third-party assurance, prompting accelerated sensor deployment for continuous monitoring. In Europe, the revised Ambient Air Quality Directive effective March 2025 forces member states to track ultrafine particles in real time, expanding demand for cost-effective sensor networks. Asia-Pacific leads the environmental sensors market thanks to Chinese NB-IoT infrastructure that supports high-density urban monitoring, while North America drives innovation in wildfire-detection networks and edge-AI platforms. Competitive intensity remains high as semiconductor majors, niche MEMS suppliers, and cloud-native IoT firms race to deliver resilient, cyber-secure, and self-calibrating solutions.
Global Environmental Sensors Market Trends and Insights
Increased NB-IoT Deployments Enabling Dense Urban Sensor Networks (Asia)
Chinese operators now run more than 900 million NB-IoT connections, and expansion plans aim for 1.9 billion by 2030, giving cities like Shenzhen the backbone for block-level air-quality mapping. The low-power wide-area standard supports decade-long battery life, deep-indoor penetration, and licensed-spectrum reliability, letting municipalities blanket high-rise districts without trenching cables. Neighboring economies from Thailand to the UAE mirror this model to accelerate smart-city roll-outs and ESG compliance.
Tightening EU Ambient Air-Quality Directive 2023/2119 Standards
The March 2025 directive slices the annual PM2.5 limit from 25 µg/m3 to 10 µg/m3 and mandates ultrafine particle tracking, forcing member states to supplement costly reference stations with dense sensor clusters. Real-time public-data access clauses privilege IoT-ready modules that stream measurements to central dashboards, spurring demand for calibrated MEMS units capable of +-5 µg/m3 accuracy in urban smog.
Calibration Drift & Maintenance Costs in Harsh Outdoor Environments
Electrochemical sensors deployed in outdoor environments experience significant calibration drift due to temperature fluctuations, humidity variations, and exposure to interfering gases, requiring recalibration intervals as frequent as every 3 months to maintain acceptable accuracy. This maintenance burden creates substantial operational costs that can exceed initial sensor procurement costs within the first year of deployment, particularly in harsh climates where environmental stressors accelerate sensor degradation. Research indicates that over 90% of sensors remain within calibration specifications during routine checks, suggesting that current maintenance schedules are overly conservative but necessary due to the high cost of compliance failures.
Other drivers and restraints analyzed in the detailed report include:
- ESG-Linked Industrial Emissions Disclosure Mandates (SEC, CSRD)
- Adoption of Multi-parameter Sensor Modules in Wearables & Hearables
- Limited Reference-Grade Calibration Infrastructure in Emerging Economies
For complete list of drivers and restraints, kindly check the Table Of Contents.
Segment Analysis
Fixed installations dominated the environmental sensors market size with 62% revenue in 2024, reflecting plant operators' need for uninterrupted proof of regulatory conformity. These wall-mounted or duct-inserted probes feed 24/7 data to environmental management systems that auditors rely on for Scope 1 verification. Portable devices, although smaller in volume, are pacing a 12.8% CAGR through 2030 as first-responders, mining firms, and construction consortia favor rapid deployment along shifting work sites. The Department of Homeland Security's wildfire pilot showed that trailer-mounted PM nodes delivered 30-minute lead times over satellite imagery, validating the business case for mobile grids.
Portables increasingly complement-not replace-fixed arrays. Utilities, for instance, install hard-wired SO2 stacks for compliance, then wheel battery-powered VOC sniffers during maintenance outages. Wearable units remain nascent but give consumer OEMs a route to health-centric differentiation, bundling pollen counts or pollution alerts into fitness dashboards. Over the forecast cycle, hybrid architectures blending permanent baselines with redeployable clusters will redefine procurement guidelines across the environmental sensors market.
Gas analyzers captured 26% of environmental sensors market share in 2024 thanks to mature electrochemical cells and NDIR optics that detect CO, NOx, and volatile organic compounds in factories, tunnels, and boilers. Particulate-matter devices, however, are charting a 13.5% CAGR as public-health agencies tighten PM2.5 exposure thresholds. Environmental sensors market size for PM instruments is forecast to reach USD 1.01 billion by 2030, buoyed by EU and California mandates demanding 10 µg/m3 annual averages.
Temperature, humidity, and pressure chips remain ubiquitous housekeeping parameters, often bundled with primary gas or PM functions inside multi-parameter modules. Bosch Sensortec's BME688 unites four physical sensors plus on-board AI inference, slicing bill-of-materials cost by 20% for OEMs that previously bought discrete components. Convergence blurs historical category lines, steering purchasing toward holistic "environment packs" rather than single-parameter parts.
The Environmental Sensors Market Report is Segmented by Product Type (Fixed, Portable, Wearable), Sensing Type (Gas, Temperature, Humidity, Pressure, Particulate Matter (PM), Multi-Parameter Modules), Connectivity (Wired, Wireless), End-User Industry (Industrial, Medical and Healthcare, Consumer Electronics, Automotive), and Geography. The Market Forecasts are Provided in Terms of Value (USD).
Geography Analysis
Asia-Pacific led the environmental sensors market with 38% revenue in 2024, powered by smart-city mega-projects in China and India that embed NB-IoT nodes in streetlights, buses, and schools. Shenzhen alone operates more than 37,000 air-quality boxes feeding open data portals. Strong electronics supply chains lower bill-of-materials, letting municipalities deploy square-kilometer grids for less than USD 15,000. Japanese and South Korean fabs inject advanced MEMS capacity, while Australian states invest in PM-and-smoke arrays for bushfire response.
North America ranks second by value. The environmental sensors market here gains momentum from SEC climate disclosure obligations and wildfire-defense funding across California, Oregon, and British Columbia. Cloud-edge alliances flourish: Honeywell's 2024 pact with Analog Devices links building-automation gateways directly to Azure IoT hubs, cutting integration times by half. Federal grants under the CHIPS and Science Act funnel R&D toward cyber-resilient sensor firmware.
Europe remains pivotal; tightened PM2.5 and ultrafine norms drive sensor retrofits across 400+ cities. Germany ties environmental telemetry to Industry 4.0 digital twins, while Nordic utilities install dew-point arrays inside district-heating vaults to manage condensation energy losses. Implementation lead times shorten because EU funds now reimburse up to 75% of air-quality network costs under Horizon Europe.
The Middle East and Africa presently represent a single-digit share but exhibit 14.2% CAGR. Gulf petro-states adopt continuous-leak detection for ESG-linked bond issuance, and South Africa's mining sector pilots low-cost PM nets to bolster labor-safety audits. Scarce calibration labs remain a hurdle, but donor-funded reference stations scheduled for 2026-2027 will unlock volume orders across Nairobi, Accra, and Lagos.
- ams OSRAM AG
- Sensirion Holding AG
- Bosch Sensortec GmbH
- Honeywell International Inc.
- Texas Instruments Inc.
- Analog Devices Inc.
- STMicroelectronics N.V.
- NXP Semiconductors N.V.
- TDK Corporation (InvenSense)
- Omron Corporation
- Sensata Technologies Inc.
- AlphaSense Inc.
- Figaro Engineering Inc.
- Banner Engineering Corp.
- Renesas Electronics Corp.
- Teledyne FLIR LLC
- Hanwei Electronics Group Corp.
- Powelectrics Ltd.
- Eurotech S.p.A.
- Omega Engineering Inc.
- Nesa Srl
- Eko Instruments B.V.
Additional Benefits:
- The market estimate (ME) sheet in Excel format
- 3 months of analyst support
TABLE OF CONTENTS
1 INTRODUCTION
- 1.1 Study Assumptions and Market Definition
- 1.2 Scope of the Study
2 RESEARCH METHODOLOGY
3 EXECUTIVE SUMMARY
4 MARKET LANDSCAPE
- 4.1 Market Overview
- 4.2 Market Drivers
- 4.2.1 Increased NB-IoT Deployments Enabling Dense Urban Sensor Networks (Asia)
- 4.2.2 Tightening EU Ambient Air-Quality Directive 2023/2119 Standards
- 4.2.3 ESG-Linked Industrial Emissions Disclosure Mandates (SEC, CSRD)
- 4.2.4 Adoption of Multi-parameter Sensor Modules in Wearables and Hearables
- 4.2.5 Green-Hydrogen and Battery Gigafactory Build-outs Requiring Humidity/Gas Sensors
- 4.2.6 Wild-fire Early-Warning Networks in North America Using Distributed PM Sensors
- 4.3 Market Restraints
- 4.3.1 Calibration Drift and Maintenance Costs in Harsh Outdoor Environments
- 4.3.2 Limited Reference-Grade Calibration Infrastructure in Emerging Economies
- 4.3.3 Cyber-security and IP Concerns Around Cloud-Connected Industrial Sensors
- 4.3.4 Price Erosion from Commoditization of MEMS Components
- 4.4 Value / Supply-Chain Analysis
- 4.5 Regulatory and Technological Outlook
- 4.6 Porter's Five Forces Analysis
- 4.6.1 Bargaining Power of Suppliers
- 4.6.2 Bargaining Power of Consumers
- 4.6.3 Threat of New Entrants
- 4.6.4 Threat of Substitute Products
- 4.6.5 Intensity of Competitive Rivalry
5 MARKET SIZE AND GROWTH FORECASTS (VALUE)
- 5.1 By Product Type
- 5.1.1 Fixed
- 5.1.2 Portable
- 5.1.3 Wearable
- 5.2 By Sensing Type
- 5.2.1 Gas
- 5.2.2 Temperature
- 5.2.3 Humidity
- 5.2.4 Pressure
- 5.2.5 Particulate Matter (PM)
- 5.2.6 Multi-parameter Modules
- 5.3 By Connectivity
- 5.3.1 Wired
- 5.3.2 Wireless
- 5.4 By End-User Industry
- 5.4.1 Industrial
- 5.4.2 Medical and Healthcare
- 5.4.3 Consumer Electronics
- 5.4.4 Automotive
- 5.4.5 Smart Homes and Buildings
- 5.4.6 Agriculture
- 5.4.7 Other End-Users
- 5.5 By Geography
- 5.5.1 North America
- 5.5.1.1 United States
- 5.5.1.2 Canada
- 5.5.1.3 Mexico
- 5.5.2 Europe
- 5.5.2.1 United Kingdom
- 5.5.2.2 Germany
- 5.5.2.3 France
- 5.5.2.4 Italy
- 5.5.2.5 Rest of Europe
- 5.5.3 Asia-Pacific
- 5.5.3.1 China
- 5.5.3.2 Japan
- 5.5.3.3 India
- 5.5.3.4 South Korea
- 5.5.3.5 Rest of Asia-Pacific
- 5.5.4 Middle East
- 5.5.4.1 Israel
- 5.5.4.2 Saudi Arabia
- 5.5.4.3 United Arab Emirates
- 5.5.4.4 Turkey
- 5.5.4.5 Rest of Middle East
- 5.5.5 Africa
- 5.5.5.1 South Africa
- 5.5.5.2 Egypt
- 5.5.5.3 Rest of Africa
- 5.5.6 South America
- 5.5.6.1 Brazil
- 5.5.6.2 Argentina
- 5.5.6.3 Rest of South America
- 5.5.1 North America
6 COMPETITIVE LANDSCAPE
- 6.1 Market Concentration
- 6.2 Strategic Moves
- 6.3 Market Share Analysis
- 6.4 Company Profiles (includes Global-level Overview, Market-level Overview, Core Segments, Financials as available, Strategic Information, Market Rank/Share, Products and Services, Recent Developments)
- 6.4.1 ams OSRAM AG
- 6.4.2 Sensirion Holding AG
- 6.4.3 Bosch Sensortec GmbH
- 6.4.4 Honeywell International Inc.
- 6.4.5 Texas Instruments Inc.
- 6.4.6 Analog Devices Inc.
- 6.4.7 STMicroelectronics N.V.
- 6.4.8 NXP Semiconductors N.V.
- 6.4.9 TDK Corporation (InvenSense)
- 6.4.10 Omron Corporation
- 6.4.11 Sensata Technologies Inc.
- 6.4.12 AlphaSense Inc.
- 6.4.13 Figaro Engineering Inc.
- 6.4.14 Banner Engineering Corp.
- 6.4.15 Renesas Electronics Corp.
- 6.4.16 Teledyne FLIR LLC
- 6.4.17 Hanwei Electronics Group Corp.
- 6.4.18 Powelectrics Ltd.
- 6.4.19 Eurotech S.p.A.
- 6.4.20 Omega Engineering Inc.
- 6.4.21 Nesa Srl
- 6.4.22 Eko Instruments B.V.
7 MARKET OPPORTUNITIES AND FUTURE OUTLOOK
- 7.1 White-space and Unmet-Need Assessment
 工業IoT感測器和邊緣電子市場預測至2034年—按產品、連接技術、部署模式、最終用戶和地區分類的全球分析智慧工業感測器市場預測至2034年—按感測器類型、組件、技術、應用、最終用戶和地區分類的全球分析
 全球電氣感測器市場規模、佔有率、趨勢和成長分析報告(2026-2034)
 環境感測器市場:類型、功能、連接方式、部署方法、應用和最終用途 - 全球市場預測 2026-2032
 2026年全球氣球環境感測器和顯示器市場報告工業IoT感測器市場預測至2034年:按感測器類型、連接方式、部署模式、應用、最終用戶和地區分類的全球分析2026年全球環境感測器市場報告
 太陽能感測器市場規模、佔有率和成長分析:按組件類型、感測器類型、技術、終端用戶產業、地區分類 - 2026-2033 年產業預測
 環境感測器市場分析及預測(至2035年):依類型、產品類型、技術、組件、應用、最終用戶、功能、安裝類型、設備及解決方案分類全球儲能安全與監控系統市場:預測(至2034年)-按電池類型、技術、應用和地區分類的分析