


 |
市場調查報告書
商品編碼
1851660
文件完整性監控:市場佔有率分析、產業趨勢、統計數據和成長預測(2025-2030 年)File Integrity Monitoring - Market Share Analysis, Industry Trends & Statistics, Growth Forecasts (2025 - 2030) |
||||||
※ 本網頁內容可能與最新版本有所差異。詳細情況請與我們聯繫。
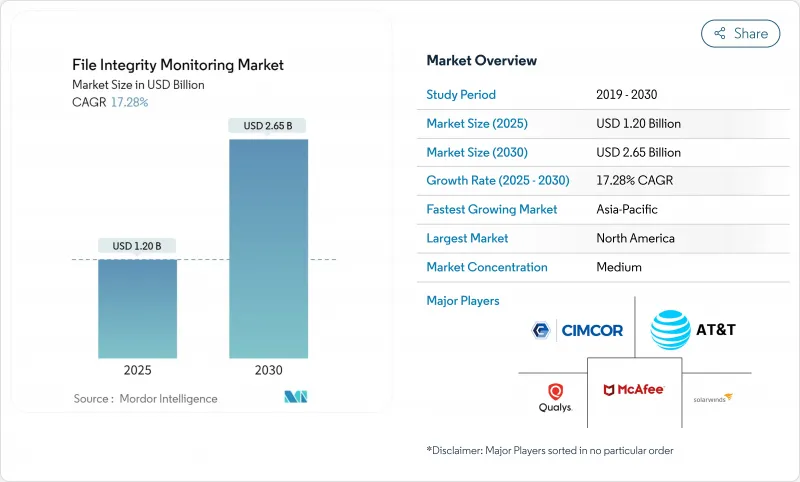
文件完整性監控市場預計到 2025 年將達到 12 億美元,到 2030 年將達到 26.5 億美元,複合年成長率高達 17.28%。
全球網路安全法規日益嚴格、雲端工作負載快速擴張以及人工智慧主導的安全分析能夠有效減少警報疲勞,這些因素共同推動了雲端原生監控平台的普及。僅依靠邊界控制已不足以抵禦橫向攻擊和勒索軟體,因此企業將即時變更偵測視為首要任務。此外,全球向零信任框架的轉變也推動了這項需求,零信任框架將文件完整性監控視為最小權限原則的基礎。各行各業不斷提高的網路保險要求以及董事會對營運彈性的嚴格審查,進一步推動了現代雲端原生監控平台的普及。
全球文件完整性監控市場趨勢與洞察
強制性監理合規
2025年5月,紐約州金融服務部第500部分修正案將要求金融機構實施特權存取監控和多因素身分驗證,文件完整性系統對於審核追蹤證據至關重要。聯邦能源監管委員會核准了北美電力可靠性公司(NERC)的CIP-015-1提案,該提案將內部監控範圍擴大到電力系統的操作技術。美國證券交易委員會(SEC)的事件揭露規則要求上市公司在四個工作天內報告重大網路安全事件,並要求即時偵測變更。支付公司也將被要求在2025年3月前達到支付卡產業資料安全標準(PCI DSS)4.0的日誌記錄和監控標準,從而將文件完整性管理確立為核心基礎架構。
資料外洩事件的興起與複雜性
預計到2024年,全球資料外洩的平均成本將上升至488萬美元,並在2025年達到500萬美元,其中醫療保健領域的資料外洩事件成本將高達977萬美元。憑證濫用仍然是主要的攻擊途徑,且往往隱藏在公開資訊中,這凸顯了細粒度文件層級監控的重要性。零售和飯店業者報告稱,39%的資料外洩事件源自第三方供應商,82%與人為錯誤有關,這迫切需要提高供應鏈的透明度。在安全營運中採用人工智慧和自動化技術的公司,平均每次資料外洩事件可節省222萬美元,這表明投資於機器學習主導的文件完整性監控(FIM)系統,以過濾干擾資訊並加快響應速度,具有重要價值。
安裝和維護成本高昂
新興市場的中小型企業每年在安全方面的投入通常不到 50 萬美元,這使得它們難以證明部署企業級 FIM 的合理性,儘管威脅日益成長。在遷移過程中同時運作舊有系統系統和現代系統會使成本翻倍,而技能短缺則阻礙了高效率實施。歐洲企業將 9% 的 IT 預算用於安全,但 89% 的企業表示需要更多人員才能滿足 NIS 2 的要求,凸顯了成本驅動的實施障礙。
細分市場分析
大型企業將佔2024年總收入的四分之三以上,這表明監管審查和複雜的混合環境正在推動大規模採用。這些公司經營分散式資料中心和多重雲端,需要偵測數千個終端的持續變化。財務狀況的改善也使它們能夠投資於人工智慧驅動的分析,以降低誤報率並加快回應速度。同時,中小企業將錄得17.40%的複合年成長率,這是最快的成長,這主要得益於訂閱式平台能夠縮短部署時間並外包維護工作。亞太地區的政府津貼正在降低前期成本,而網路保險公司也越來越要求在保單簽發時進行文件完整性管理。
嚮導主導設定介面、託管服務和基於使用量的定價模式避免了巨額資本支出,為中小企業開闢了新的商機。然而,預算和人才缺口依然存在。許多中小企業仍然沒有專門的安全人員,因此他們依賴服務提供者的專業知識進行調優和事件處理。為了應對這項挑戰,供應商正在透過規則集、自動化基準和人工智慧引導的調查工作流程來降低技能要求,同時確保獲得可用於審核的證據。
到 2024 年,雲端服務將佔總收入的 69.20%,以 18.90% 的複合年成長率引領成長,這反映出企業正在廣泛地向 SaaS 和基礎設施即代碼 (IaC) 轉型。現代平台支援彈性擴充性和 API 整合,使安全團隊能夠從超大規模提供者處獲取原生遠端檢測,並在無需代理的情況下進行多層完整性評估。統一的儀表板簡化了 PCI、GDPR 和 HIPAA 等合規性框架之間的對應。
對於必須維護資料主權和網路分段的高度監管機構而言,本地部署工具同樣適用。混合部署透過將本機日誌匯入雲端分析引擎來滿足這些需求。例如,OkCupid 遷移到 AWS 時,利用 Terraform 建置了一個雲端原生檔案完整性管理 (FIM) 管道,所需的自訂程式碼極少,最終成本低於商業產品。雲端安全態勢管理和文件完整性功能的整合正在模糊產品邊界,進一步加速向 SaaS 模式的轉型。
文件完整性監控市場按組織規模(中小企業、大型企業)、部署類型(本地部署、雲端部署)、部署模型(基於代理商、無代理商/雲端原生)、最終用戶產業(零售、銀行、金融服務和保險、飯店、醫療保健、政府等)以及地區進行細分。市場預測以美元計價。
區域分析
北美地區預計到2024年將貢獻28.9%的收入,這主要得益於成熟的網路安全法規以及財富1000強企業在主導的大量投入。美國持續維持領先地位,佔全球網路安全預算的40%以上,金融機構更是將兩位數的IT預算用於網路安全防護。加拿大推動資料外洩通知要求的統一化以及墨西哥提高基本安全義務的金融科技法案,都進一步提振了該地區的需求。
亞太地區是成長最快的地區,複合年成長率高達17.2%,這得益於各國政府推動服務數位化和投資主權雲。日本首個專注於網路安全的投資基金以及S&J的Cyleague HD等夥伴關係,拓展了託管檢測能力,凸顯了成熟的買方市場。中國的數據本地化規範促使國內供應商為關鍵產業建立合規的金融資訊管理系統(FIM)。以新加坡為首的東協金融中心正在採用先進的監控技術,以支持數位銀行的發展。
其他福利:
- Excel格式的市場預測(ME)表
- 3個月的分析師支持
目錄
第1章 引言
- 研究假設和市場定義
- 調查範圍
第2章調查方法
第3章執行摘要
第4章 市場情勢
- 市場概覽
- 市場促進因素
- 監理合規義務
- 資料外洩事件的興起與複雜性
- 不斷成長的雲端工作負載需要雲端原生 FIM。
- 中小企業採用經濟實惠的基於 SaaS 的 FIM 解決方案
- DevSecOps 管線整合以實現程式碼完整性
- 利用人工智慧進行降噪以提高投資報酬率
- 市場限制
- 安裝和維護成本高昂
- 作戰警報疲勞和技能短缺
- 容器和微服務的盲點
- 遷移到不可變基礎設施可以減少對檔案級監控的需求。
- 供應鏈分析
- 監管環境
- 技術展望
- 波特五力模型
- 新進入者的威脅
- 買方的議價能力
- 供應商的議價能力
- 替代品的威脅
- 競爭對手之間的競爭
- 評估市場的宏觀經濟因素
第5章 市場規模與成長預測
- 按組織規模
- 小型企業
- 主要企業
- 依部署類型
- 本地部署
- 雲
- 透過安裝模式
- 基於代理的
- 無代理/雲端原生
- 按最終用戶行業分類
- 零售
- BFSI
- 飯店業
- 衛生保健
- 政府機構
- 娛樂與媒體
- 其他行業
- 按地區
- 北美洲
- 美國
- 加拿大
- 墨西哥
- 南美洲
- 巴西
- 阿根廷
- 其他南美洲
- 歐洲
- 德國
- 英國
- 法國
- 荷蘭
- 其他歐洲地區
- 亞太地區
- 中國
- 日本
- 印度
- 韓國
- 澳洲和紐西蘭
- 亞太其他地區
- 中東和非洲
- 中東
- 阿拉伯聯合大公國
- 沙烏地阿拉伯
- 土耳其
- 其他中東地區
- 非洲
- 南非
- 奈及利亞
- 其他非洲地區
- 北美洲
第6章 競爭情勢
- 市場集中度
- 策略趨勢
- 市佔率分析
- 公司簡介
- McAfee
- Cimcor
- Qualys
- ATandT
- SolarWinds
- LogRhythm
- New Net Technologies
- Trend Micro
- Trustwave
- Ionx Solutions
- Splunk
- Software Diversified Services
- IBM
- Securonix
- Bitdefender
- Tripwire
- Rapid7
- Wazuh
- ManageEngine(Zoho)
- Tanium
- Netwrix
- Cisco Systems
第7章 市場機會與未來展望
The file integrity monitoring market stands at USD 1.20 billion in 2025 and is forecast to reach USD 2.65 billion by 2030, registering a robust 17.28% CAGR.
Momentum stems from tighter global cybersecurity regulations, rapid cloud workload expansion and the convergence of AI-driven security analytics that reduce alert fatigue. Enterprises are prioritizing real-time change detection because perimeter-centric controls no longer suffice against lateral attacks and ransomware. Demand also benefits from a global pivot toward zero-trust frameworks that regard file integrity monitoring as foundational for least-privilege enforcement. Across industries, rising cyber-insurance prerequisites and board-level scrutiny of operational resilience further propel the adoption of modern, cloud-native monitoring platforms.
Global File Integrity Monitoring Market Trends and Insights
Regulatory Compliance Mandates
Financial institutions face the May 2025 New York DFS Part 500 amendment that requires privileged-access oversight and multi-factor authentication, making file integrity systems critical for audit-trail evidence. The Federal Energy Regulatory Commission approved NERC CIP-015-1, extending internal monitoring to operational technology in bulk electric systems. Updated HIPAA rules add encryption and multi-factor authentication for electronic protected health information, strengthening demand for integrity monitoring in healthcare.SEC incident-disclosure rules compel listed companies to report material cyber events within four business days, driving real-time change detection requirements. Payment firms must also satisfy PCI DSS 4.0 logging and monitoring criteria by March 2025, positioning file integrity controls as core infrastructure.
Rising Data-Breach Volume and Sophistication
Average global breach costs climbed to USD 4.88 million in 2024 and are set to hit USD 5.00 million in 2025, with healthcare incidents peaking at USD 9.77 million. Credential abuse remains the dominant attack vector, often obscured in public disclosures, underscoring the value of granular file-level monitoring. Retail and hospitality operators report 39% of incidents emanating from third-party vendors, and 82% link to human error, raising urgency for supply-chain visibility. Enterprises implementing AI and automation within security operations saved USD 2.22 million per breach on average, validating investment in machine-learning-driven FIM that filters noise and accelerates response.
High Implementation and Maintenance Costs
SMEs in emerging markets often allocate under USD 500,000 a year to security, making enterprise-grade FIM difficult to justify despite rising threats. Parallel operation of legacy and modern systems during migrations doubles expenses, while skill shortages hamper efficient deployment. European firms devote 9% of IT budgets to security, yet 89% say they need more staff to meet NIS 2 mandates, highlighting cost-driven adoption barriers.
Other drivers and restraints analyzed in the detailed report include:
- Cloud Workload Expansion Needs Cloud-Native FIM
- AI-Driven Noise-Reduction Boosting ROI
- Container and Micro-Services Blind-Spots
For complete list of drivers and restraints, kindly check the Table Of Contents.
Segment Analysis
Large enterprises generated over three-quarters of 2024 revenue, underlining how regulatory scrutiny and complex hybrid environments drive sizeable deployments. These organizations run distributed data centers and multicloud estates that require continuous change detection across thousands of endpoints. Financial muscle also allows investment in AI-powered analytics that shrink false-positive rates and accelerate response. Meanwhile, SMEs post the fastest 17.40% CAGR, powered by subscription-based platforms that compress onboarding time and outsource upkeep. Government grants in Asia Pacific lower the initial outlay, while cyber-insurance carriers increasingly stipulate file integrity controls for policy issuance.
The SME opportunity is being unlocked by wizard-driven setup interfaces, managed services and usage-based pricing that sidestep heavy capital expense. Yet budget and talent gaps persist; many small firms still operate without dedicated security staff and therefore rely on provider expertise for tuning and incident handling. Vendors respond with curated rule sets, automated baselining and AI-guided investigation workflows that compress skill requirements while maintaining audit-ready evidence.
Cloud offerings held 69.20% revenue in 2024 and lead growth at an 18.90% CAGR, reflecting the broader enterprise refactoring toward SaaS and infrastructure-as-code. Modern platforms deliver elastic scale and API integration, letting security teams inherit native telemetry from hyperscale providers and layer integrity assessments without agent sprawl. Unified dashboards simplify compliance mapping across PCI, GDPR and HIPAA frameworks.
On-premises tools remain relevant for highly regulated institutions that must maintain data sovereignty or segmented networks. Hybrid deployments bridge those demands by feeding on-premises logs into cloud-hosted analytics engines. As an illustration, OkCupid's migration to AWS leveraged Terraform to spin up a cloud-native FIM pipeline with minimal custom code and lower total cost than commercial alternatives. The convergence of cloud security posture management with file integrity functionality is blurring product boundaries and further accelerating migration to SaaS.
File Integrity Monitoring Market is Segmented by Organization Size (Small and Medium Enterprises, Large Enterprises), Deployment Type (On-Premise, Cloud), Installation Mode (Agent-Based, Agentless/Cloud Native), End-User Industry (Retail, BFSI, Hospitality, Healthcare, Government, and More), and Geography. The Market Forecasts are Provided in Terms of Value (USD).
Geography Analysis
North America generated 28.9% of 2024 revenue on the back of mature cyber regulations and heavy security spending by Fortune 1000 enterprises. The United States channels more than 40% of global cybersecurity budgets, and financial institutions carve out double-digit IT allocations for protection, ensuring continued leadership. Canada promotes harmonized breach-notification requirements, and Mexico's fintech law raises baseline security obligations, reinforcing regional demand.
Asia Pacific is the fastest-growing territory at 17.2% CAGR as governments digitize services and invest in sovereign cloud. Japan's first cybersecurity-focused investment fund and partnerships such as S&J with Cyleague HD expand managed detection capacity, highlighting a sophisticated buyer market. China's data-localization norms spur domestic vendors to build compliance-ready FIM for critical industries. ASEAN's finance hubs, led by Singapore, adopt advanced monitoring to support digital banking growth.
- McAfee
- Cimcor
- Qualys
- ATandT
- SolarWinds
- LogRhythm
- New Net Technologies
- Trend Micro
- Trustwave
- Ionx Solutions
- Splunk
- Software Diversified Services
- IBM
- Securonix
- Bitdefender
- Tripwire
- Rapid7
- Wazuh
- ManageEngine (Zoho)
- Tanium
- Netwrix
- Cisco Systems
Additional Benefits:
- The market estimate (ME) sheet in Excel format
- 3 months of analyst support
TABLE OF CONTENTS
1 INTRODUCTION
- 1.1 Study Assumptions and Market Definition
- 1.2 Scope of the Study
2 RESEARCH METHODOLOGY
3 EXECUTIVE SUMMARY
4 MARKET LANDSCAPE
- 4.1 Market Overview
- 4.2 Market Drivers
- 4.2.1 Regulatory compliance mandates
- 4.2.2 Rising data-breach volume and sophistication
- 4.2.3 Cloud workload expansion needs cloud-native FIM
- 4.2.4 SME adoption of affordable SaaS FIM
- 4.2.5 DevSecOps pipeline integration for code integrity
- 4.2.6 AI-driven noise-reduction boosting ROI
- 4.3 Market Restraints
- 4.3.1 High implementation and maintenance costs
- 4.3.2 Operational alert fatigue and skill shortage
- 4.3.3 Container and micro-services blind-spots
- 4.3.4 Shift to immutable infrastructure lowering need for file-level monitoring
- 4.4 Supply-Chain Analysis
- 4.5 Regulatory Landscape
- 4.6 Technological Outlook
- 4.7 Porter's Five Forces
- 4.7.1 Threat of New Entrants
- 4.7.2 Bargaining Power of Buyers
- 4.7.3 Bargaining Power of Suppliers
- 4.7.4 Threat of Substitutes
- 4.7.5 Intensity of Competitive Rivalry
- 4.8 Assesment of Macroeconomic Factors on the Market
5 MARKET SIZE AND GROWTH FORECASTS (VALUE)
- 5.1 By Organization Size
- 5.1.1 Small and Medium Enterprises
- 5.1.2 Large Enterprises
- 5.2 By Deployment Type
- 5.2.1 On-Premise
- 5.2.2 Cloud
- 5.3 By Installation Mode
- 5.3.1 Agent-Based
- 5.3.2 Agentless / Cloud Native
- 5.4 By End-user Industry
- 5.4.1 Retail
- 5.4.2 BFSI
- 5.4.3 Hospitality
- 5.4.4 Healthcare
- 5.4.5 Government
- 5.4.6 Entertainment and Media
- 5.4.7 Other Industries
- 5.5 By Geography
- 5.5.1 North America
- 5.5.1.1 United States
- 5.5.1.2 Canada
- 5.5.1.3 Mexico
- 5.5.2 South America
- 5.5.2.1 Brazil
- 5.5.2.2 Argentina
- 5.5.2.3 Rest of South America
- 5.5.3 Europe
- 5.5.3.1 Germany
- 5.5.3.2 United Kingdom
- 5.5.3.3 France
- 5.5.3.4 Netherlands
- 5.5.3.5 Rest of Europe
- 5.5.4 Asia-Pacific
- 5.5.4.1 China
- 5.5.4.2 Japan
- 5.5.4.3 India
- 5.5.4.4 South Korea
- 5.5.4.5 Australia and New Zealand
- 5.5.4.6 Rest of Asia-Pacific
- 5.5.5 Middle East and Africa
- 5.5.5.1 Middle East
- 5.5.5.1.1 United Arab Emirates
- 5.5.5.1.2 Saudi Arabia
- 5.5.5.1.3 Turkey
- 5.5.5.1.4 Rest of Middle East
- 5.5.5.2 Africa
- 5.5.5.2.1 South Africa
- 5.5.5.2.2 Nigeria
- 5.5.5.2.3 Rest of Africa
- 5.5.1 North America
6 COMPETITIVE LANDSCAPE
- 6.1 Market Concentration
- 6.2 Strategic Moves
- 6.3 Market Share Analysis
- 6.4 Company Profiles (includes Global level Overview, Market level overview, Core Segments, Financials as available, Strategic Information, Market Rank/Share for key companies, Products and Services, and Recent Developments)
- 6.4.1 McAfee
- 6.4.2 Cimcor
- 6.4.3 Qualys
- 6.4.4 ATandT
- 6.4.5 SolarWinds
- 6.4.6 LogRhythm
- 6.4.7 New Net Technologies
- 6.4.8 Trend Micro
- 6.4.9 Trustwave
- 6.4.10 Ionx Solutions
- 6.4.11 Splunk
- 6.4.12 Software Diversified Services
- 6.4.13 IBM
- 6.4.14 Securonix
- 6.4.15 Bitdefender
- 6.4.16 Tripwire
- 6.4.17 Rapid7
- 6.4.18 Wazuh
- 6.4.19 ManageEngine (Zoho)
- 6.4.20 Tanium
- 6.4.21 Netwrix
- 6.4.22 Cisco Systems
7 MARKET OPPORTUNITIES AND FUTURE OUTLOOK
- 7.1 White-space and Unmet-need Assessment
 文件完整性監控市場:按部署類型、元件、用例、組織規模和最終用戶產業分類-2026-2032年全球市場預測
 2026年全球文件完整性監控市場報告
 文件完整性監控市場分析及預測(至 2035 年):按類型、產品類型、服務、技術、組件、應用、部署類型、最終用戶、功能和解決方案分類
 全球文件完整性監控市場規模、佔有率、趨勢和成長分析報告(2026-2034)
 文件完整性監控市場規模、佔有率和成長分析(按組件、部署模式、部署類型、組織規模和地區分類)-2026-2033年產業預測
 文件調整性監視(FIM)的全球市場的評估:各零件,安裝方式,各部署類型,不同企業規模,各最終用途產業,各地區,機會,預測(2018年~2032年)
 文件完整性監控市場機會、成長動力、產業趨勢分析與預測 2025 - 2034
 文件調整性監視(FIM)的全球市場:產業分析,規模,佔有率,成長,趨勢,預測(2024年~2031年)