


 |
市場調查報告書
商品編碼
1851651
Edge Analytics:市場佔有率分析、產業趨勢、統計數據和成長預測(2025-2030 年)Edge Analytics - Market Share Analysis, Industry Trends & Statistics, Growth Forecasts (2025 - 2030) |
||||||
※ 本網頁內容可能與最新版本有所差異。詳細情況請與我們聯繫。
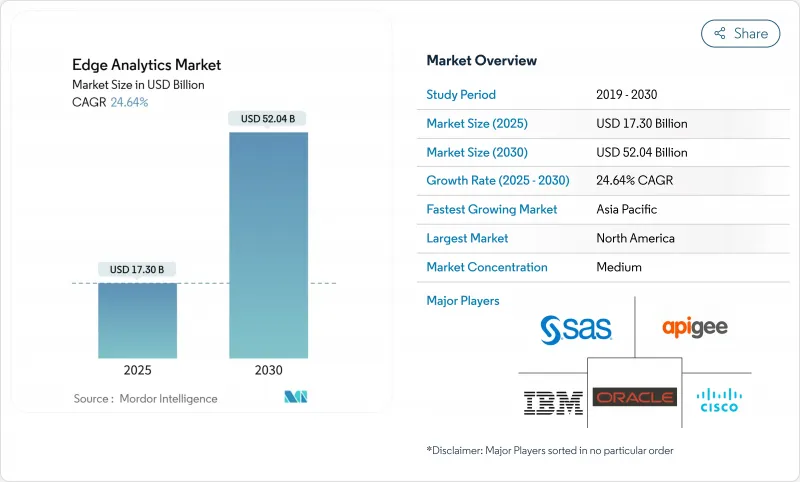
預計到 2025 年,邊緣分析市場規模將達到 173 億美元,到 2030 年將達到 520.4 億美元,複合年成長率為 24.64%。
物聯網終端的快速擴張、5G網路覆蓋範圍的擴大(支援低延遲資料路徑)以及人工智慧晶片技術的持續進步(將推理引擎部署在網路邊緣)共同推動了邊緣分析市場的成長。供應商正優先考慮堅固耐用的微型資料中心、液冷設計以及聯邦學習框架,這些框架能夠在訓練全局模型的同時,將敏感資料保留在本地。企業也在整合雲端原生編配工具,以標準化跨數千個邊緣節點的應用傳輸,從而縮短引進週期並提高投資報酬率。此外,監管機構推動資料主權架構的措施也對邊緣分析市場產生了影響,尤其是在醫療保健和金融領域,這些領域必須兼顧即時決策支援和嚴格的隱私保護要求。
全球邊緣分析市場趨勢與洞察
物聯網終端的激增
全球設備每天產生 3.2877 億 TB 的數據,迫使分析工作轉向本地處理,以節省頻寬並提供即時洞察。工業工廠目前透過數百萬個感測器傳輸振動和溫度指標,而運行最佳化模型的邊緣加速器能夠以低於 10 毫秒的延遲處理這些海量數據。隨著預測性維護檢查的應用範圍從重型機械擴展到醫療穿戴式設備,邊緣分析市場正在擴大其營運規模,並成為企業數據策略中不可或缺的一部分。
對超低延遲分析的需求
自主機器人、遠端手術設備和防碰撞系統需要在 5 毫秒內做出決策。邊緣分析技術可以消除 50-150 毫秒的往返時間,從而降低關鍵任務故障的風險。將缺陷檢測演算法從區域資料中心遷移到本地節點的製造商報告稱,產量比率提高了兩位數,這進一步證明了分散式智慧的商業價值。
持續的資料安全和主權風險
每個邊緣閘道器都存在攻擊面,攻擊者可以透過實體存取或未修補的韌體來利用這些攻擊。醫療服務提供者還需要遵守基於位置的資料居住要求,這推動了可信任執行環境和零信任疊加層的採用,從而實現端對端流量加密。
細分市場分析
預測引擎是邊緣分析市場中成長最快的層,年複合成長率高達 25%。此層在基礎說明可視性的基礎上增加了決策自動化功能,能夠在檢測到異常情況後推薦最佳應對措施。儘管到 2024 年,說明模組仍將佔總收入的 39%,但用戶需求顯然正在轉向能夠驅動產出並最大限度降低風險的更高階洞察。邊緣設備現在搭載了緊湊型強化學習代理,可以即時最佳化機器人分體,這表明這種轉變已獲得商業性認可。
預測演算法不斷彌合當今儀錶板與完全自動化之間的差距。透過關聯溫度高峰或交通高峰,可以預測維護窗口和庫存需求。診斷分析雖然規模較小,但能夠揭示根本原因,從而防止問題再次發生。將這些技術堆疊結合起來,供應商可以打包分層服務:以解釋性儀錶板作為入門級功能,並為高級用戶添加指導性附加元件。因此,邊緣分析產業正朝著基於結果的合約模式不斷成熟。
到2024年,本地部署節點將佔邊緣分析市場規模的56%。對於資料敏感型產業而言,本地部署節點仍然是首選,因為這些產業無法匯出個人識別資訊或國家安全資訊。例如,醫院網路會在內部管理影像伺服器,以便放射科醫生無需外部連結即可存取掃描影像。然而,隨著服務供應商推出符合居住規定的區域,雲端管理邊緣運算正在快速擴張,預計到2030年將以27.5%的複合年成長率成長。
從長遠來看,混合拓樸結構正逐漸成為主流。敏感工作負載在本地執行推理,而批量趨勢分析則在集中式雲端夜間運行。中央主機推送容器更新、協調策略並收集匯總資訊以經營團隊儀表板,從而在不犧牲敏捷性的前提下實現控制。減少基礎設施重複建設並將運算資源靠近資料來源,既符合預算目標,也符合合規性要求。
邊緣分析市場報告按部署類型(本地部署、雲端部署)、組件(解決方案、服務)、技術(說明分析、診斷性分析、預測性分析、規範性分析)、最終用戶行業(銀行、金融服務和保險、IT 和通訊、製造業、醫療保健、零售業、其他)和地區對行業進行分類。
區域分析
北美地區將繼續保持領先地位,2024 年將佔全球營收的 43%,這主要得益於其成熟的超大規模資料中心佈局和早期 5G商業化戰略。通訊業者正在將網路覆蓋範圍擴展到二線都會區,使零售商能夠將微型資料中心部署在更靠近郊區門市的位置。政府激勵措施鼓勵製造商採用智慧工廠計劃,並在生產線邊緣整合人工智慧主導的製程控制。隱私保護法規仍然對創新持開放態度,前提是加密和審核追蹤符合行業標準。政策的明確性正在縮短採購週期,從而支撐醫療保健、零售和能源產業的穩定需求。
亞太地區是成長最快的地區,預計2025年至2030年將以27%的複合年成長率成長。中國正在擴大區域邊緣設施的規模,以整合來自智慧交通號誌和工業機器人的感測器數據。日本汽車巨頭正在部署預測性品質控制流程以降低返工成本,而印度行動電話營運商則正在利用新的頻譜資源,為物流園區推出私人5G網路。跨境資料流動的監管立場各不相同,跨國公司正轉向在地化部署,通常使用開放原始碼技術堆疊以避免廠商鎖定。對國內半導體晶圓廠的投資進一步支持了區域自主供應鏈的建設,並增強了邊緣計劃的韌性。
在GDPR和提案的人工智慧責任法的引導下,歐洲正穩步推進人工智慧技術的應用。德國率先開展工業4.0計劃,透過OPC UA閘道器和容器化推理維修傳統工廠,力求在創新與風險管治之間取得平衡。法國主導智慧交通試點項目,並利用路邊設備的即時視訊分析技術提升公共反應速度。北歐業者優先考慮環保的氫動力邊緣站點,以符合ESG(環境、社會和治理)指令。標準化組織正在合作制定安全啟動、遠端認證和資料交換框架,從而促進互通性,這將惠及更廣泛的邊緣分析市場。
其他福利:
- Excel格式的市場預測(ME)表
- 3個月的分析師支持
目錄
第1章 引言
- 研究假設和市場定義
- 調查範圍
第2章調查方法
第3章執行摘要
第4章 市場情勢
- 市場概覽
- 市場促進因素
- 物聯網終端的激增
- 對超低延遲分析的需求
- 快速部署 5G 可解鎖邊緣應用程式場景
- 雲端原生工具鏈簡化邊緣部署
- 設備端協作學習增強資料隱私
- 用於高熱密度人工智慧的液冷微型資料中心
- 市場限制
- 持續的資料安全和主權風險
- 與棕地技術系統整合的複雜性
- 微機器學習/邊緣人工智慧工程人才短缺
- 分散式運算節點中基於ESG主導的功率限制
- 關鍵法規結構評估
- 價值鏈分析
- 技術展望
- 波特五力模型
- 供應商的議價能力
- 買方的議價能力
- 新進入者的威脅
- 替代品的威脅
- 競爭對手之間的競爭
- 關鍵相關人員影響評估
- 主要用例和案例研究
- 宏觀經濟因素對市場的影響
- 投資分析
第5章 市場區隔
- 依部署類型
- 本地部署
- 雲
- 按組件
- 解決方案
- 服務
- 按最終用戶行業分類
- BFSI
- 資訊科技/通訊
- 製造業
- 衛生保健
- 零售
- 其他
- 透過技術
- 說明分析
- 診斷分析
- 預測分析
- 指示性分析
- 按地區
- 北美洲
- 美國
- 加拿大
- 墨西哥
- 南美洲
- 巴西
- 阿根廷
- 其他南美洲
- 歐洲
- 英國
- 德國
- 法國
- 義大利
- 西班牙
- 北歐國家
- 其他歐洲地區
- 中東和非洲
- 中東
- 沙烏地阿拉伯
- 阿拉伯聯合大公國
- 土耳其
- 其他中東地區
- 非洲
- 南非
- 埃及
- 奈及利亞
- 其他非洲地區
- 亞太地區
- 中國
- 印度
- 日本
- 韓國
- ASEAN
- 澳洲
- 紐西蘭
- 亞太其他地區
- 北美洲
第6章 競爭情勢
- 市場集中度
- 策略趨勢
- 市佔率分析
- 公司簡介
- Cisco Systems Inc.
- IBM Corporation
- Microsoft Corporation
- Apigee Corporation
- Dell Technologies Inc.
- Intel Corporation
- Oracle Corporation
- SAS Institute Inc.
- Amazon Web Services Inc.
- Google Cloud Platform
- Hewlett Packard Enterprise
- Schneider Electric SE
- Huawei Technologies Co.
- SAP SE
- Siemens AG
- GE Digital
- Foghorn Systems
- Edge Impulse Inc.
- Greenwave Systems
- Predixion Software
- AGT International Inc.
第7章 市場機會與未來展望
The edge analytics market size stands at USD 17.30 billion in 2025 and is on track to reach USD 52.04 billion by 2030, reflecting a 24.64% CAGR.
Growth is propelled by the rapid expansion of IoT end-points, wider 5G coverage that supports low-latency data paths, and ongoing advances in AI-enabled silicon that places inference engines at the network edge. Vendors are prioritizing ruggedized micro-data centers, liquid-cooling designs, and federated learning frameworks that keep sensitive data local while still training global models. Enterprises are also integrating cloud-native orchestration tools to standardize application delivery across thousands of edge nodes, thereby compressing deployment cycles and raising ROI expectations. The edge analytics market is further influenced by regulatory drives toward data-sovereign architectures, especially in healthcare and finance where real-time decision support must coexist with strict privacy mandates.
Global Edge Analytics Market Trends and Insights
Proliferation of IoT end-points
The global device base is generating 328.77 million TB of data every day, forcing analytics to migrate toward local processing so that bandwidth is conserved and insights arrive in real time. Industrial plants now stream vibration and temperature metrics from millions of sensors, and edge accelerators running optimized models handle this influx with sub-10 ms latency. As predictive maintenance checks extend from heavy machinery to medical wearables, the edge analytics market gains a larger operational footprint and becomes an indispensable layer in enterprise data strategy.
Demand for ultra-low-latency analytics
Autonomous robots, tele-surgery rigs, and collision-avoidance systems need decisions within 5 ms, a target unattainable when packets traverse distant clouds. Edge analytics eliminates the 50-150 ms round-trip and lowers the risk of mission-critical failures. Manufacturers that moved defect-detection algorithms from regional data centers to on-site nodes report double-digit yield improvements, reinforcing the business case for distributed intelligence.
Persistent data-security & sovereignty risks
Each edge gateway introduces an attack surface that adversaries can exploit through physical access or unpatched firmware. Finance and healthcare operators must also align with location-based data residency mandates, prompting adoption of trusted execution environments and zero-trust overlays that encrypt traffic end-to-end.
Other drivers and restraints analyzed in the detailed report include:
- Rapid 5G roll-out unlocking edge use-cases
- Cloud-native toolchains simplifying edge deployments
- Integration complexity with brownfield OT systems
For complete list of drivers and restraints, kindly check the Table Of Contents.
Segment Analysis
Prescriptive engines are the fastest-advancing layer in the edge analytics market, growing at a 25% CAGR. They add decision automation to basic descriptive visibility, recommending the next best action once anomalies are detected. In 2024, descriptive modules still held 39% of revenue, but user demand has clearly pivoted toward higher-order insights that lift output and minimize risk. Edge devices now host compact reinforcement-learning agents that optimize robotics pathing on the fly, illustrating the commercial pull behind the transition.
Predictive algorithms remain a bridge between current dashboards and full automation. They enable forecast maintenance windows and inventory needs by correlating temperature spikes or traffic surges. Diagnostic analytics, though smaller, supplies root-cause clarity that prevents recurrence. Together these stacks help vendors package tiered offerings, embedding descriptive dashboards as entry points and layering prescriptive add-ons for premium subscribers. In turn, the edge analytics industry continues to mature toward outcome-based contracting.
On-premises nodes accounted for 56% of the edge analytics market size in 2024. They remain the first choice for data-sensitive sectors that cannot export personally identifiable or national-security information. Hospital networks, for instance, maintain imaging servers in-house so radiologists access scans without traversing external links. However, cloud-managed edges are scaling quicker, charting a 27.5% CAGR to 2030 as providers launch regional zones that meet residency rules.
Hybrid topology is emerging as the long-term norm. Sensitive workloads infer locally while batch trend analytics run in centralized clouds overnight. Central consoles push container updates, harmonize policy, and collect aggregated insights for executive dashboards, thereby delivering control without sacrificing agility. The arrangement reduces infrastructure duplication and keeps compute near data origin, aligning with both budget and compliance targets.
The Edge Analytics Market Report Segments the Industry Into by Deployment Type (On-Premises, and Cloud), Component (Solutions, and Services), Technology (Descriptive Analytics, Diagnostic Analytics, Predictive Analytics, and Prescriptive Analytics), End User Industry (BFSI, IT and Telecommunication, Manufacturing, Healthcare, Retail, and Others), and Geography.
Geography Analysis
North America retained leadership with 43% revenue in 2024 thanks to a mature hyperscale data-center footprint and early 5G monetization strategies. Telcos widened coverage to secondary metros, letting retailers place micro-data centers closer to suburban stores. Government incentives encouraged manufacturers to adopt smart-factory programs, embedding AI-driven process control at the line edge. Privacy rulings remain receptive to innovation provided encryption and audit trails meet industry norms. Policy clarity shortens procurement cycles and underpins steady demand across healthcare, retail, and energy domains.
Asia Pacific is the fastest-growing territory, forecast to log a 27% CAGR during 2025-2030. China scales provincial edge facilities that ingest sensor feeds from smart traffic lights and industrial robotics. Japan's automotive majors deploy predictive quality loops that slice rework costs, while India's mobile operators leverage new spectrum to launch private 5G campuses for logistics parks. Diverse regulatory positions on cross-border data flows push multinationals toward localized deployments, often using open-source stacks to avoid vendor lock-in. Investments in domestic semiconductor fabs further support a self-sustaining regional supply chain and embed resilience into edge projects.
Europe shows robust but measured uptake, guided by GDPR and proposed AI liability laws. Germany pioneers Industrie 4.0 projects that retrofit heritage plants with OPC UA gateways and containerized inference, balancing innovation with risk governance. France leads smart-transport pilots where real-time video analytics on roadside units improve public-safety response times. Nordic operators prioritize green hydrogen-powered edge sites to respect ESG mandates. Standard-setting bodies collaborate on secure boot, remote attestation, and data-exchange frameworks, fostering an interoperability ethos that benefits the wider edge analytics market.
- Cisco Systems Inc.
- IBM Corporation
- Microsoft Corporation
- Apigee Corporation
- Dell Technologies Inc.
- Intel Corporation
- Oracle Corporation
- SAS Institute Inc.
- Amazon Web Services Inc.
- Google Cloud Platform
- Hewlett Packard Enterprise
- Schneider Electric SE
- Huawei Technologies Co.
- SAP SE
- Siemens AG
- GE Digital
- Foghorn Systems
- Edge Impulse Inc.
- Greenwave Systems
- Predixion Software
- AGT International Inc.
Additional Benefits:
- The market estimate (ME) sheet in Excel format
- 3 months of analyst support
TABLE OF CONTENTS
1 INTRODUCTION
- 1.1 Study Assumptions and Market Definition
- 1.2 Scope of the Study
2 RESEARCH METHODOLOGY
3 EXECUTIVE SUMMARY
4 MARKET LANDSCAPE
- 4.1 Market Overview
- 4.2 Market Drivers
- 4.2.1 Proliferation of IoT end-points
- 4.2.2 Demand for ultra-low-latency analytics
- 4.2.3 Rapid 5G roll-out unlocking edge use-cases
- 4.2.4 Cloud-native toolchains simplifying edge deployments
- 4.2.5 On-device federated learning enhancing data privacy
- 4.2.6 Liquid-cooling micro-data-centres enabling thermal-dense AI
- 4.3 Market Restraints
- 4.3.1 Persistent data-security & sovereignty risks
- 4.3.2 Integration complexity with brownfield OT systems
- 4.3.3 Scarcity of tiny-ML / edge-AI engineering talent
- 4.3.4 ESG-driven power-cap caps on distributed compute nodes
- 4.4 Evaluation of Critical Regulatory Framework
- 4.5 Value Chain Analysis
- 4.6 Technological Outlook
- 4.7 Porter's Five Forces
- 4.7.1 Bargaining Power of Suppliers
- 4.7.2 Bargaining Power of Buyers
- 4.7.3 Threat of New Entrants
- 4.7.4 Threat of Substitutes
- 4.7.5 Competitive Rivalry
- 4.8 Impact Assessment of Key Stakeholders
- 4.9 Key Use Cases and Case Studies
- 4.10 Impact on Macroeconomic Factors of the Market
- 4.11 Investment Analysis
5 MARKET SEGMENTATION
- 5.1 By Deployment Type
- 5.1.1 On-Premises
- 5.1.2 Cloud
- 5.2 By Component
- 5.2.1 Solutions
- 5.2.2 Services
- 5.3 By End-User Industry
- 5.3.1 BFSI
- 5.3.2 IT & Telecommunication
- 5.3.3 Manufacturing
- 5.3.4 Healthcare
- 5.3.5 Retail
- 5.3.6 Others
- 5.4 By Technology
- 5.4.1 Descriptive Analytics
- 5.4.2 Diagnostic Analytics
- 5.4.3 Predictive Analytics
- 5.4.4 Prescriptive Analytics
- 5.5 By Geography
- 5.5.1 North America
- 5.5.1.1 United States
- 5.5.1.2 Canada
- 5.5.1.3 Mexico
- 5.5.2 South America
- 5.5.2.1 Brazil
- 5.5.2.2 Argentina
- 5.5.2.3 Rest of South America
- 5.5.3 Europe
- 5.5.3.1 United Kingdom
- 5.5.3.2 Germany
- 5.5.3.3 France
- 5.5.3.4 Italy
- 5.5.3.5 Spain
- 5.5.3.6 Nordics
- 5.5.3.7 Rest of Europe
- 5.5.4 Middle East and Africa
- 5.5.4.1 Middle East
- 5.5.4.1.1 Saudi Arabia
- 5.5.4.1.2 United Arab Emirates
- 5.5.4.1.3 Turkey
- 5.5.4.1.4 Rest of Middle East
- 5.5.4.2 Africa
- 5.5.4.2.1 South Africa
- 5.5.4.2.2 Egypt
- 5.5.4.2.3 Nigeria
- 5.5.4.2.4 Rest of Africa
- 5.5.5 Asia-Pacific
- 5.5.5.1 China
- 5.5.5.2 India
- 5.5.5.3 Japan
- 5.5.5.4 South Korea
- 5.5.5.5 ASEAN
- 5.5.5.6 Australia
- 5.5.5.7 New Zealand
- 5.5.5.8 Rest of Asia-Pacific
- 5.5.1 North America
6 COMPETITIVE LANDSCAPE
- 6.1 Market Concentration
- 6.2 Strategic Moves
- 6.3 Market Share Analysis
- 6.4 Company Profiles (includes Global level Overview, Market level overview, Core Segments, Financials as available, Strategic Information, Market Rank/Share for key companies, Products and Services, and Recent Developments)
- 6.4.1 Cisco Systems Inc.
- 6.4.2 IBM Corporation
- 6.4.3 Microsoft Corporation
- 6.4.4 Apigee Corporation
- 6.4.5 Dell Technologies Inc.
- 6.4.6 Intel Corporation
- 6.4.7 Oracle Corporation
- 6.4.8 SAS Institute Inc.
- 6.4.9 Amazon Web Services Inc.
- 6.4.10 Google Cloud Platform
- 6.4.11 Hewlett Packard Enterprise
- 6.4.12 Schneider Electric SE
- 6.4.13 Huawei Technologies Co.
- 6.4.14 SAP SE
- 6.4.15 Siemens AG
- 6.4.16 GE Digital
- 6.4.17 Foghorn Systems
- 6.4.18 Edge Impulse Inc.
- 6.4.19 Greenwave Systems
- 6.4.20 Predixion Software
- 6.4.21 AGT International Inc.
7 MARKET OPPORTUNITIES AND FUTURE OUTLOOK
- 7.1 White-space and Unmet-need Assessment
 邊緣分析市場:按組件、部署類型、應用程式和最終用戶分類-2026-2032年全球市場預測
 邊緣分析市場 - 2026-2031 年預測
 邊緣分析市場,全球預測至 2032 年:按組件、部署模式、組織規模、應用、最終用戶和地區分類
 邊緣分析市場規模、佔有率和成長分析(按類型、組件、部署類型、應用、最終用途和地區分類)-2026-2033年產業預測
 邊緣分析市場規模、佔有率、趨勢分析報告:按類型、組件、部署模型、應用、產業、地區、細分預測,2025-2030 年全球 SQL記憶體內市場規模(按類型、應用、地區、範圍和預測)
 全球邊緣分析市場,2024-2028