


 |
市場調查報告書
商品編碼
1851650
資料湖:市場佔有率分析、行業趨勢、統計數據和成長預測(2025-2030 年)Data Lake - Market Share Analysis, Industry Trends & Statistics, Growth Forecasts (2025 - 2030) |
||||||
※ 本網頁內容可能與最新版本有所差異。詳細情況請與我們聯繫。
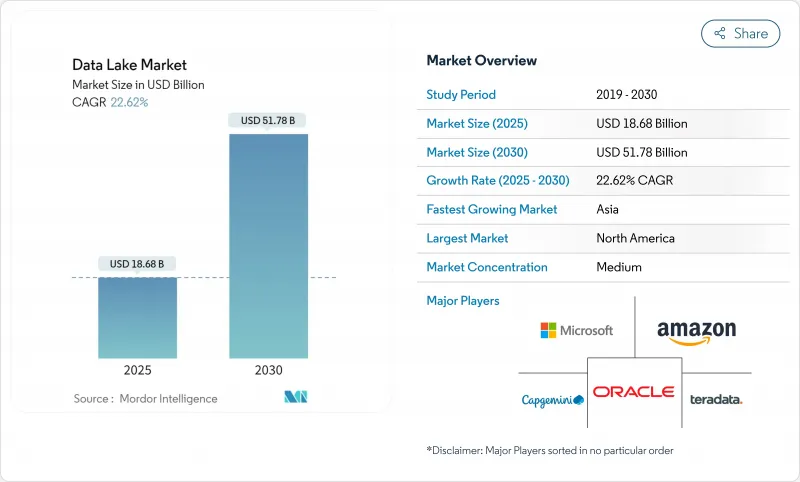
預計到 2025 年,數據湖市場規模將達到 186.8 億美元,到 2030 年將達到 517.8 億美元,複合年成長率為 22.62%。
成長的驅動力來自生成式人工智慧管道產生的非結構化資料量呈指數級成長、監管機構不斷擴大的記錄保存要求,以及向湖倉式架構的轉變——這種架構將湖倉和倉庫的資源整合到單一層級。財富 500 強企業在採用湖倉式架構後,整體成本降低了 35% 至 40%,而即時 ESG 和風險壓力工作負載的應用情境正在擴展到工業和金融領域。無伺服器開放表格式如今已成為多重雲端可攜性策略的基礎,而自動化管治層正在湧現,旨在避免「資料沼澤」的陷阱,同時又不阻礙創新。
全球數據湖市場趨勢與洞察
GenAI工作負載驅動下非結構化和多模態資料的爆炸性成長
生成式人工智慧應用會產生大量的圖像、音訊和文字數據,這些數據需要基於讀取模式的儲存。企業預計,到 2025 年,全球 175 Zetta位元組資料空間中將有 30% 需要即時處理,而這種需求並不適合傳統的靜態資料倉儲。谷歌雲端的 Lakehouse 藍圖展示了原生格式儲存與向量索引結合如何加速底層模型的微調,同時降低儲存成本。企業若延遲採用這項技術,可能面臨創新週期延長和人工智慧工作負載單位成本上升的風險。
歐洲資料居住要求加速了雲端基礎湖的普及應用
歐盟的資料管治和資料法律正迫使企業將敏感工作負載在地化。超大規模雲端服務供應商正在積極回應:AWS 已投資 78 億歐元,提供內建資料位置控制功能的獨立雲端區域。企業目前正在部署區域分段的資料湖,以滿足駐留規則,同時透過聯合引擎保持查詢。
元資料漂移會造成「資料沼澤」。
當資料攝取速度超過目錄更新速度時,資料湖就會變成搜尋的儲存庫。到 2025 年,全球數據量將達到 163 Zetta位元組,這將增加數據孤立且缺乏上下文資訊的風險。企業正在透過採用 Unity Catalog 等自動化血緣追蹤工具來應對這項挑戰。如果沒有類似的控制措施,管治成本可能會抵銷湖屋整合帶來的預期節省。
細分市場分析
到2024年,解決方案將佔資料湖市場收入的70%,屆時資料湖市場規模將達到130.8億美元。企業採用標準化的儲存引擎、查詢加速器和管治套件是人工智慧環境的基石,這推動了解決方案的主導地位。隨著工作負載的不斷演變,供應商正在將成本最佳化儀表板、自動分層儲存和原生OpenTable支援等功能捆綁在一起,以保持競爭力。
到2030年,服務子細分市場將以25.8%的複合年成長率成長,反映出市場對遷移藍圖、效能調優和全天候維運服務的需求。由於能夠重構傳統Hadoop平台的人才短缺,許多企業正在與承諾提供可預測服務等級協議(SLA)的專家簽訂合約。由於人才市場緊張,專業服務預訂量將繼續以高於整體資料湖市場成長的速度成長。
到 2024 年,雲端部署將佔據資料湖市場 65% 的佔有率,因為企業需要即時擴展性和整合安全性。 Amazon S3 等彈性物件儲存透過實現生命週期自動化和冷資料自動分層到低成本層,降低了資本支出。分析引擎可以按需啟動,從而使運算成本與計劃進度保持一致。
到 2030 年,混合雲和多重雲端配置的複合年成長率將達到 24%。 OpenTable 格式允許使用單一元元資料定義來覆寫本機和公共雲端儲存桶,從而減少了資料複製的需求。區域合規性法規進一步推動了混合雲策略的發展,使企業能夠在主權區域內鎖定受監管的工作負載,同時透過跨雲架構進行查詢。因此,混合環境資料湖的市場規模正隨著主權雲的推出而同步查詢。
區域分析
北美地區將佔2024年總收入的38%,並在架構成熟度方面持續保持領先地位。金融機構正在延長時間序列資料的保留期限,以適應不斷演進的壓力測試範本;醫院網路正在建立多模態病患圖譜,以支援人工智慧主導的診斷。創業投資也鼓勵成立專注於管治的Start-Ups,從而確保生態系統的蓬勃發展。
亞太地區是成長最快的區域,預計到2030年將維持24.1%的複合年成長率。日本、印度和新加坡等國政府正在資助主權雲端計劃,這刺激了對符合區域標準的雲湖的需求。中國電信業者正在分析大量的5G日誌以進行容量規劃,而印尼的金融科技公司正在共用詐騙情報湖以遏制網路犯罪。像日本Wasabi這樣的供應商已經設立了亞太總部,旨在抓住預計36%的IaaS成長機會。
在歐洲嚴格的資料主權指令下,資料安全技術的採用速度加快。歐洲資料策略鼓勵對本地託管進行投資;AWS 將於 2025 年底前在勃蘭登堡開設區域以滿足居住要求;製造商即時儲存範圍 3 的排放以用於 CSRD 報告;銀行在符合審核要求的「湖」式資料中心中改進巴塞爾協議 III 的計算。歐洲銀行管理局 2025 年的壓力測試範本進一步強化了「湖」式資料中心必須滿足的技術要求。
其他福利:
- Excel格式的市場預測(ME)表
- 3個月的分析師支持
目錄
第1章 引言
- 研究假設和市場定義
- 調查範圍
第2章調查方法
第3章執行摘要
第4章 市場情勢
- 市場概覽
- 市場促進因素
- GenAI工作負載驅動下非結構化和多模態資料的爆炸性成長
- 歐洲的資料駐留強制規定加速了雲端基礎湖的普及應用
- Lakehouse 融合方案為財富 500 強企業降低 35-40% 的總擁有成本
- 用於多重雲端移植的無伺服器表格形式
- 各產業即時ESG範圍3資料擷取要求
- 金融服務監管壓力測試要求保留長達十年的逐筆交易資料保存
- 市場限制
- 元資料漂移會造成“資料沼澤”,並增加管治成本。
- 新興地區湖泊工程師短缺
- 對延遲敏感的工作負載仍然更傾向於使用資料倉儲而不是資料湖。
- 不透明的基於消費量的雲端定價模式使預算預測變得複雜。
- 技術展望
- 波特五力模型
- 供應商的議價能力
- 買方的議價能力
- 新進入者的威脅
- 替代品的威脅
- 競爭對手之間的競爭
第5章 市場規模與成長預測
- 報價
- 解決方案
- 資料發現與目錄
- 資料整合和 ETL/ELT
- 分析和視覺化工具
- 管治與安全平台
- 服務
- 專業服務(諮詢、整合)
- 託管服務
- 解決方案
- 透過部署
- 雲
- 公共雲端
- 私有雲端
- 混合/多重雲端
- 本地部署
- 雲
- 按組織規模
- 主要企業
- 中小企業
- 按業務職能
- 營運和供應鏈
- 金融與風險
- 銷售與行銷
- 人力資源
- 按行業
- 資訊科技和電信
- BFSI
- 醫療保健和生命科學
- 零售與電子商務
- 製造業和工業
- 媒體與娛樂
- 政府/公共部門
- 能源與公共產業
- 其他(教育、酒店管理)
- 按地區
- 北美洲
- 美國
- 加拿大
- 墨西哥
- 南美洲
- 巴西
- 阿根廷
- 智利
- 秘魯
- 其他南美洲
- 歐洲
- 德國
- 英國
- 法國
- 義大利
- 西班牙
- 其他歐洲地區
- 亞太地區
- 中國
- 日本
- 印度
- 澳洲
- 紐西蘭
- 亞太其他地區
- 中東
- 阿拉伯聯合大公國
- 沙烏地阿拉伯
- 土耳其
- 其他中東地區
- 非洲
- 南非
- 其他非洲地區
- 北美洲
第6章 競爭情勢
- Strategic Developments
- Vendor Positioning Analysis
- 公司簡介
- Amazon Web Services(AWS)
- Microsoft Corporation
- Google LLC
- IBM Corporation
- Oracle Corporation
- Snowflake Inc.
- SAP SE
- Cloudera Inc.
- Teradata Corporation
- Informatica Inc.
- Databricks Inc.
- Hitachi Vantara LLC
- Dell Technologies Inc.
- Atos SE
- SAS Institute Inc.
- Zaloni Inc.
- Dremio Corporation
- Qubole Inc.
- Talend SA
- HPE(Ezmeral)
第7章 市場機會與未來展望
The data lakes market is valued at USD 18.68 billion in 2025 and is on track to reach USD 51.78 billion by 2030, registering a 22.62% CAGR.
Growth stems from surging unstructured data volumes generated by generative-AI pipelines, expanding regulatory record-keeping mandates, and the shift toward lakehouse architectures that collapse lake and warehouse footprints into a single tier. Fortune 500 firms report 35-40% total-cost savings after embracing lakehouses, while real-time ESG and risk-stress workloads are extending use cases into industrial and financial domains. Serverless open-table formats now anchor multi-cloud portability strategies, and automated governance layers are emerging to prevent "swamp" pitfalls without throttling innovation.
Global Data Lake Market Trends and Insights
Explosion of unstructured and multimodal data from GenAI workloads
Generative-AI applications create vast image, audio, and text payloads that demand schema-on-read storage. Enterprises expect 30% of the global 175 zettabyte data sphere to require real-time processing by 2025, a profile unsuited to rigid warehouses. Data lakes therefore become the default landing zone for multi-modal corpora used in prompt-engineering loops.Google Cloud's lakehouse blueprint shows how native-format storage paired with vector indexing accelerates foundation-model fine-tuning while lowering storage bills. Firms delaying adoption risk slower innovation cycles and higher unit-costs on AI workloads.
Data-residency mandates in Europe accelerating cloud-based lake adoption
The EU Data Governance Act and Data Act compel organizations to localize sensitive workloads. Hyperscalers are responding: AWS is investing EUR 7.8 billion in a sovereign-cloud region that ships with embedded data-location controls. Enterprises now deploy region-segmented data lakes that meet residency rules yet remain queryable through federated engines, sparking demand for lineage-rich metadata catalogs capable of surfacing cross-border data usage in audit reports.
Metadata drift creating "data swamps"
When ingestion outpaces catalog updates, data lakes devolve into unsearchable repositories. By 2025, global data volume will reach 163 zettabytes, heightening the risk of siloed files with missing context. Enterprises are responding by adopting automated lineage trackers such as Unity Catalog, which logs every read-write and flags orphaned assets. Without similar controls, governance overhead can erase savings projected from lakehouse consolidation.
Other drivers and restraints analyzed in the detailed report include:
- Lakehouse convergence delivering 35-40% TCO savings
- Serverless table formats unlocking multi-cloud portability
- Skilled lake-engineering talent shortfall in emerging regions
For complete list of drivers and restraints, kindly check the Table Of Contents.
Segment Analysis
Solutions generated 70% of data lakes market revenue in 2024, equating to a data lakes market size of USD 13.08 billion. The dominance comes from enterprises standardizing on storage engines, query accelerators, and governance suites that form the backbone of AI-ready environments. Vendors bundle cost-optimizer dashboards, automated tiering, and native open-table support, maintaining relevance as workloads evolve.
The services sub-segment is racing ahead at a 25.8% CAGR to 2030, reflecting demand for migration blueprints, performance tuning, and 24X7 managed operations. Many firms lack staff who can re-platform legacy Hadoop estates, so they contract specialists that promise predictable SLA outcomes. The tight talent market ensures professional-services bookings will keep growing faster than the overall data lakes market
Cloud deployments captured 65% of the data lakes market share in 2024 as organizations sought instant scalability and integrated security. Elastic object stores like Amazon S3 eliminate CapEx while delivering lifecycle automation that auto-tiers cold data to low-cost classes. Analytics engines then spin up on demand, keeping compute spend aligned with project tempo.
Hybrid and multi-cloud configurations are expanding at 24% CAGR to 2030. Open-table formats let one metadata definition span on-prem and public-cloud buckets, slashing replication needs. Regional compliance rules further fuel hybrid strategies, as firms pin regulated workloads in sovereign regions yet still query them through cross-cloud fabrics. As a result, the data lakes market size for hybrid environments is rising in lockstep with sovereign-cloud launches.
The Data Lakes Market Report is Segmented by Offering (Solutions, and Services), Deployment (Cloud, and Hybrid/Multi-Cloud), Organization Size (Large Enterprises, and SMEs), Business Function (Operations and Supply-Chain, Finance and Risk, and More), End-User Vertical (IT and Telecom, Healthcare and Life Sciences, and More), and Geography (North America, Asia, and More). The Market Forecasts are Provided in Terms of Value (USD).
Geography Analysis
North America generated 38% of 2024 revenue and continues to set benchmarks in architecture maturity. Financial institutions lengthen time-series retention to meet evolving stress-test templates, while hospital networks build multimodal patient graphs that underpin AI-driven diagnostics. Venture capital also fuels governance-start-up formation, ensuring a vibrant ecosystem.
Asia-Pacific is the fastest-expanding region, clocking a 24.1% CAGR through 2030. Governments in Japan, India, and Singapore sponsor sovereign-cloud projects, spurring demand for region-compliant lake zones. Telcos in China analyze massive 5G logs for capacity planning, whereas Indonesian fintechs share fraud-intelligence lakes to curb cybercrime. Vendors establishing APAC headquarters, such as Wasabi in Japan, aim to catch the projected 36% IaaS upturn.
Europe accelerates adoption under strict data-sovereignty mandates. The European Strategy for Data drives investment in local hosting, and AWS will open a Brandenburg region by late 2025 to satisfy residency rules. Manufacturers store real-time Scope-3 emissions for CSRD reporting, and banks refine Basel III calculations inside audit-ready lakes. The European Banking Authority's 2025 stress-test templates reinforce technical requirements that lakehouses fulfill.
- Amazon Web Services (AWS)
- Microsoft Corporation
- Google LLC
- IBM Corporation
- Oracle Corporation
- Snowflake Inc.
- SAP SE
- Cloudera Inc.
- Teradata Corporation
- Informatica Inc.
- Databricks Inc.
- Hitachi Vantara LLC
- Dell Technologies Inc.
- Atos SE
- SAS Institute Inc.
- Zaloni Inc.
- Dremio Corporation
- Qubole Inc.
- Talend SA
- HPE (Ezmeral)
Additional Benefits:
- The market estimate (ME) sheet in Excel format
- 3 months of analyst support
TABLE OF CONTENTS
1 Introduction
- 1.1 Study Assumptions and Market Definition
- 1.2 Scope of the Study
2 Research Methodology
3 Executive Summary
4 Market Landscape
- 4.1 Market Overview
- 4.2 Market Drivers
- 4.2.1 Explosion of Unstructured and Multimodal Data from GenAI Workloads
- 4.2.2 Data-Residency Mandates in Europe Accelerating Cloud-based Lake Adoption
- 4.2.3 Lakehouse Convergence Driving 35-40% TCO Savings for Fortune-500 Firms
- 4.2.4 Serverless Table Formats Unlocking Multi-Cloud Portability
- 4.2.5 Real-Time ESG Scope-3 Data Capture Requirements in Industrial Sector
- 4.2.6 Regulatory Stress-Testing in Financial Services Demanding Decade-Scale Tick Data Retention
- 4.3 Market Restraints
- 4.3.1 Metadata Drift Creating "Data Swamps" and Raising Governance Cost
- 4.3.2 Skilled Lake Engineering Talent Shortfall in Emerging Regions
- 4.3.3 Latency-Sensitive Workloads Still Favoring Warehouses over Lakes
- 4.3.4 Opaque Consumption-Based Cloud Pricing Complicating Budget Forecasts
- 4.4 Technological Outlook
- 4.5 Porter's Five Forces
- 4.5.1 Bargaining Power of Suppliers
- 4.5.2 Bargaining Power of Buyers
- 4.5.3 Threat of New Entrants
- 4.5.4 Threat of Substitutes
- 4.5.5 Intensity of Competitive Rivalry
5 Market Size and Growth Forecasts (Value)
- 5.1 By Offering
- 5.1.1 Solutions
- 5.1.1.1 Data Discovery and Cataloging
- 5.1.1.2 Data Integration and ETL/ELT
- 5.1.1.3 Analytics and Visualization Tools
- 5.1.1.4 Governance and Security Platforms
- 5.1.2 Services
- 5.1.2.1 Professional Services (Consulting, Integration)
- 5.1.2.2 Managed Services
- 5.1.1 Solutions
- 5.2 By Deployment
- 5.2.1 Cloud
- 5.2.1.1 Public Cloud
- 5.2.1.2 Private Cloud
- 5.2.1.3 Hybrid/Multi-Cloud
- 5.2.2 On-Premise
- 5.2.1 Cloud
- 5.3 By Organization Size
- 5.3.1 Large Enterprises
- 5.3.2 Small and Mid-Size Enterprises (SMEs)
- 5.4 By Business Function
- 5.4.1 Operations and Supply-Chain
- 5.4.2 Finance and Risk
- 5.4.3 Sales and Marketing
- 5.4.4 Human Resources
- 5.5 By End-User Vertical
- 5.5.1 IT and Telecom
- 5.5.2 BFSI
- 5.5.3 Healthcare and Life Sciences
- 5.5.4 Retail and E-commerce
- 5.5.5 Manufacturing and Industrial
- 5.5.6 Media and Entertainment
- 5.5.7 Government and Public Sector
- 5.5.8 Energy and Utilities
- 5.5.9 Others (Education, Hospitality)
- 5.6 By Geography
- 5.6.1 North America
- 5.6.1.1 United States
- 5.6.1.2 Canada
- 5.6.1.3 Mexico
- 5.6.2 South America
- 5.6.2.1 Brazil
- 5.6.2.2 Argentina
- 5.6.2.3 Chile
- 5.6.2.4 Peru
- 5.6.2.5 Rest of South America
- 5.6.3 Europe
- 5.6.3.1 Germany
- 5.6.3.2 United Kingdom
- 5.6.3.3 France
- 5.6.3.4 Italy
- 5.6.3.5 Spain
- 5.6.3.6 Rest of Europe
- 5.6.4 Asia-Pacific
- 5.6.4.1 China
- 5.6.4.2 Japan
- 5.6.4.3 India
- 5.6.4.4 Australia
- 5.6.4.5 New Zealand
- 5.6.4.6 Rest of Asia-Pacific
- 5.6.5 Middle East
- 5.6.5.1 United Arab Emirates
- 5.6.5.2 Saudi Arabia
- 5.6.5.3 Turkey
- 5.6.5.4 Rest of Middle East
- 5.6.6 Africa
- 5.6.6.1 South Africa
- 5.6.6.2 Rest of Africa
- 5.6.1 North America
6 Competitive Landscape
- 6.1 Strategic Developments
- 6.2 Vendor Positioning Analysis
- 6.3 Company Profiles (includes Global level Overview, Market level overview, Core Segments, Financials as available, Strategic Information, Products and Services, and Recent Developments)
- 6.3.1 Amazon Web Services (AWS)
- 6.3.2 Microsoft Corporation
- 6.3.3 Google LLC
- 6.3.4 IBM Corporation
- 6.3.5 Oracle Corporation
- 6.3.6 Snowflake Inc.
- 6.3.7 SAP SE
- 6.3.8 Cloudera Inc.
- 6.3.9 Teradata Corporation
- 6.3.10 Informatica Inc.
- 6.3.11 Databricks Inc.
- 6.3.12 Hitachi Vantara LLC
- 6.3.13 Dell Technologies Inc.
- 6.3.14 Atos SE
- 6.3.15 SAS Institute Inc.
- 6.3.16 Zaloni Inc.
- 6.3.17 Dremio Corporation
- 6.3.18 Qubole Inc.
- 6.3.19 Talend SA
- 6.3.20 HPE (Ezmeral)
7 Market Opportunities and Future Outlook
- 7.1 White-space and Unmet-need Assessment
 資料湖平台市場預測至2034年:按組件、部署模式、最終用戶和區域分類的全球分析
 2026年全球資料湖分析市場報告
 資料湖市場:2026-2032年全球市場預測(依產品類型、最終用戶、技術、應用及銷售管道分類)2026年全球能源資料湖平台市場報告2026年全球銀行資料湖平台市場報告2026年全球網格資料湖平台市場報告2026年全球資料倉儲湖平台市場報告2026年全球資料湖市場報告
 資料湖市場分析及預測(至2035年):按類型、產品類型、服務、技術、組件、應用、部署類型、最終用戶和功能分類
 全球資料湖市場規模、佔有率、趨勢和成長分析報告(2026-2034)