


 |
市場調查報告書
商品編碼
1851647
雲端監控:市場佔有率分析、產業趨勢、統計數據和成長預測(2025-2030 年)Cloud Monitoring - Market Share Analysis, Industry Trends & Statistics, Growth Forecasts (2025 - 2030) |
||||||
※ 本網頁內容可能與最新版本有所差異。詳細情況請與我們聯繫。
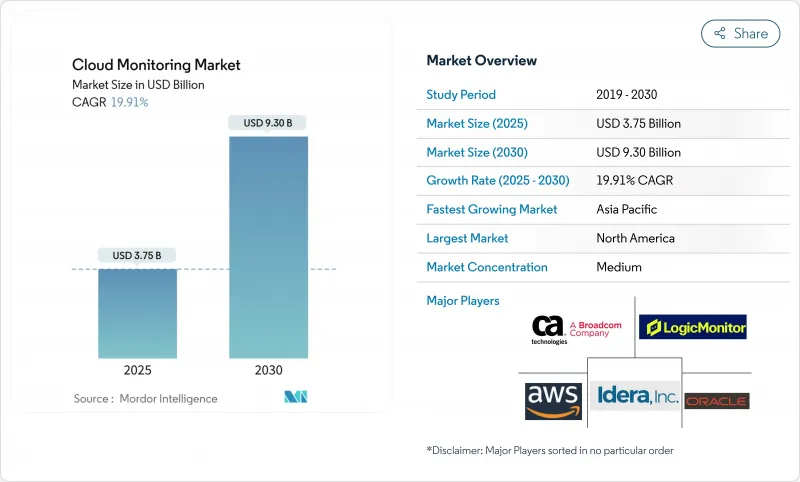
預計到 2025 年,雲端監控市場規模將達到 37.5 億美元,到 2030 年將達到 93 億美元,預測期(2025-2030 年)的複合年成長率為 19.91%。
多重雲端部署加速、AI工作負載可見性、FinOps責任制以及資料主權要求正在重塑供應商的藍圖。企業正在用整合平台取代零散的監控工具,這些平台能夠即時攝取日誌、指標、追蹤資料、使用者體驗和成本訊號。 OpenTelemetry的快速標準化降低了整合摩擦,而AI驅動的異常檢測則縮短了平均故障解決時間。支出正從純粹的基礎設施指標轉向將技術健康狀況與收入影響聯繫起來的全端智慧。由於超大規模雲端在整合原生工具的同時,也與獨立供應商合作以因應混合雲環境,競爭格局仍保持適中。
全球雲端監控市場趨勢與洞察
加速多重雲端和混合雲端的採用
多重雲端採用已過臨界點,預計到 2024 年,43% 的金融服務公司將把工作負載分佈在兩個或多個超大規模雲端平台上。每個雲端供應商都會匯出自己的指標,導致維運團隊面臨遙測資料混亂和盲點。因此,能夠規範來自 AWS、Azure 和 Google Cloud 資料的統一平台正在取代單雲監控器。由於廠商中立的偵測方式能夠達到全環境覆蓋,OpenTelemetry 代理程式的採用率激增。當相同的交易跨越本地和雲端節點時,企業也需要對成本、效能和合規性進行關聯分析。這些壓力正將混合雲可觀測性從選購功能提升為必備功能,推動雲端可觀測性市場朝向更深入的端到端情境發展。
DevOps/SRE 文化與即時可觀測性
站點可靠性工程已成為大型企業的主流做法,平均每小時可降低超過 100 萬美元的停機成本。團隊現在將黃金訊號和服務等級目標 (SLO) 整合到 CI/CD 管線中,以確保缺陷在生產部署之前被發現。與孤立的工具鏈相比,全端洞察已將停機時間減少了 79%。人工智慧驅動的異常檢測透過挖掘日誌和追蹤中的事件徵兆來增強人類的判斷能力。更快的回饋循環也提高了開發人員的效率,而可觀測性則直接轉化為業務賦能。因此,雲端可觀測性市場受益於預算從傳統 IT 維運轉向工程團隊。
對容器化無伺服器堆疊的可見性有限
容器僅運作數秒,無伺服器函數無需代理即可啟動,這造成了傳統監控工具無法填補的空白。 Kubernetes 增加了種子層級的元資料,使得暴力破解收集數據會增加儲存成本。分散式追蹤技術將微服務之間的請求路徑拼接起來,並結合低開銷的基於 eBPF 的偵測技術,成為解決方案。 OpenTelemetry 至關重要,但其部署複雜性仍然是資源受限的中小企業難以採用它的主要原因。在承包的檢測技術成熟之前,短暫環境中的可觀測性差距可能會阻礙雲端可觀測性市場的複合年成長率。
細分市場分析
到2024年,SaaS平台將佔總營收的48%,這印證了市場對無需基礎設施開銷的承包配置的需求。 PaaS解決方案將成為成長最快的領域,年複合成長率將達到29.90%,因為使用者渴望獲得更深入的程式碼層級洞察,而無需管理資料擷取器。對於需要在本地部署更靠近受監管資料的混合型設施而言,IaaS工具仍將保持其重要性。隨著落後產業轉向託管服務,預計2025年至2030年間,SaaS雲端可觀測性市場規模將成長27億美元。
PaaS 的發展動能體現在平台工程團隊將可觀測性整合到其內部開發者入口網站中。領先的技術供應商正在將追蹤、混沌測試和 KPI 儀表板直接整合到其建置管道中,從而降低認知負荷。結合 OpenTelemetry 的自動化檢測功能,這種協同效應加速了價值實現。因此,雲端可觀測性市場近三分之一的新增訂單來自針對 AI 模式可觀測性和成本分析的 PaaS 交易。
涵蓋資料湖、關聯引擎和使用者體驗分析的解決方案套件預計將在2024年佔總營收的62%。由於企業難以招募可觀測工程師,服務諮詢、客戶導入和託管可觀測性服務以19.30%的複合年成長率成長。在需要確保測量與控制框架一致的受監管垂直市場中,對整合商的需求最高。
供應商藍圖現在包含捆綁式快速入門包,可縮短諮詢時間、認證培訓和價值驗證週期。 LogicMonitor 的 8 億美元資金籌措用於服務擴展,這表明專業知識如何成為強大的競爭優勢。隨著框架的演進,經常性服務合約將在雲端可觀測性市場整體收入中佔據更大的佔有率,從而深化合作夥伴生態系統。
雲端監控市場報告按雲端服務模式(IaaS、SaaS、PaaS)、組件(解決方案和服務)、部署類型(公共雲端、私有雲端、混合/多重雲端)、組織規模(中小企業和大型企業)、最終用戶垂直行業(銀行、金融服務和保險、零售、電子商務、IT 和通訊、醫療保健和生命科學、政府和公共部門製造、金融服務和保險
區域分析
北美地區將佔2024年總收入的41%,這反映了該地區數十年來DevOps技術的成熟以及在人工智慧領域的巨額投資。金融機構指出,其系統故障造成的損失中位數為每年1,044萬美元,足以證明使用高級工具的必要性。儘管主權雲的熱度有所下降,但隱私權法仍推動著資料駐留功能的發展。隨著更換週期的飽和,從2027年開始,成長速度將放緩至10%左右,但人工智慧可觀測性的升級將支撐許可證的持續成長。
亞太地區是成長最快的地區,複合年成長率高達21.30%,主要得益於雲端優先型新興企業和政府數位化轉型。到2028年,印度的公共雲端投資額可望達到255億美元。新加坡和印尼的可觀測性投資報酬率超過114%,顯示減少停機時間能夠帶來高額回報。中國雲端市場規模達6.192兆元人民幣,其中阿里雲佔43%的市場佔有率,推動了在地化資料平台和本土資料湖的建置。
隨著GDPR和即將訂定的人工智慧法規加強資料保護需求,歐洲的複合年成長率(CAGR)達到15%左右。Accenture報告稱,37%的公司正在投資主權雲,其中44%的公司計劃在未來兩年內進一步投資。供應商與區域主機商合作,以確保歐盟境內日誌管道的安全。隨著氣候變遷報告與績效指標的融合,能源儀錶板越來越受歡迎。這些區域差異正在推動雲端可觀測性市場中多樣化且注重合規性的部署。
其他福利:
- Excel格式的市場預測(ME)表
- 3個月的分析師支持
目錄
第1章 引言
- 研究假設和市場定義
- 調查範圍
第2章調查方法
第3章執行摘要
第4章 市場情勢
- 市場概覽
- 市場促進因素
- 加速多重雲端和混合雲端的採用
- DevOps/SRE 文化以及對即時可觀測性的需求
- 人工智慧/機器學習工作負載的爆炸性成長需要GPU等級的監控
- 財務課責與成本與價值最佳化壓力
- 雲端碳排放報告永續性儀錶板
- 主權雲端和強制資料本地化
- 市場限制
- 對容器化和無伺服器架構的可見性有限
- 全端可觀測性平台的整體擁有成本不斷上升
- 可觀測性工程技能差距
- 由於超大規模 API 速率限制,導致深度遙測資料限流
- 價值/供應鏈分析
- 監管環境
- 技術展望
- 波特五力分析
- 新進入者的威脅
- 供應商的議價能力
- 買方的議價能力
- 替代品的威脅
- 競爭對手之間的競爭
第5章 市場規模與成長預測
- 透過雲端服務模式
- IaaS
- PaaS
- SaaS
- 按組件
- 解決方案
- 服務
- 透過部署模式
- 公有雲
- 私有雲端
- 混合/多重雲端
- 按公司規模
- 小型企業
- 主要企業
- 按最終用戶行業分類
- BFSI
- 零售與電子商務
- 資訊科技/通訊
- 醫療保健和生命科學
- 政府/公共部門
- 製造業
- 其他(媒體、能源、教育)
- 按地區
- 北美洲
- 美國
- 加拿大
- 墨西哥
- 南美洲
- 巴西
- 阿根廷
- 其他南美洲
- 歐洲
- 英國
- 德國
- 法國
- 西班牙
- 俄羅斯
- 其他歐洲地區
- 亞太地區
- 中國
- 日本
- 印度
- 韓國
- 亞太其他地區
- 中東和非洲
- 阿拉伯聯合大公國
- 沙烏地阿拉伯
- 南非
- 其他中東和非洲地區
- 北美洲
第6章 競爭情勢
- 市場集中度
- 策略趨勢
- 市佔率分析
- 公司簡介
- AWS
- Microsoft
- Google Cloud
- IBM
- Oracle
- Datadog
- Dynatrace
- New Relic
- Broadcom(CA Tech/AppDynamics)
- LogicMonitor
- Splunk
- SolarWinds
- PagerDuty
- Cisco ThousandEyes
- Grafana Labs
- Elastic
- Zenoss
- ScienceLogic
- Idera
第7章 市場機會與未來展望
The Cloud Monitoring Market size is estimated at USD 3.75 billion in 2025, and is expected to reach USD 9.30 billion by 2030, at a CAGR of 19.91% during the forecast period (2025-2030).
Accelerated multi-cloud adoption, AI workload visibility, FinOps accountability, and data-sovereignty mandates are reshaping vendor roadmaps. Enterprises are replacing point monitoring tools with unified platforms that ingest logs, metrics, traces, user experience, and cost signals in real time. OpenTelemetry's rapid standardization is lowering integration friction, while AI-driven anomaly detection shortens the mean time to resolution. Spending is shifting from pure infrastructure metrics toward full-stack intelligence that ties technical health to revenue impact. Competitive intensity remains moderate as hyperscale clouds embed native tooling, yet still partner with independent vendors to address hybrid estates.
Global Cloud Monitoring Market Trends and Insights
Accelerated Multi-Cloud and Hybrid-Cloud Adoption
Multi-cloud usage crossed a tipping point, with 43% of financial-services firms already distributing workloads across two or more hyperscalers in 2024. Each provider exports unique metrics, so operations teams face telemetry sprawl and blind spots. Unified platforms that normalise data across AWS, Azure, and Google Cloud are therefore replacing single-cloud monitors. Adoption of OpenTelemetry agents rose sharply because vendor-neutral instrumentation eases estate-wide coverage. Organisations also need correlated cost, performance, and compliance views when the same transaction spans on-premises and cloud nodes. These pressures elevate hybrid-cloud observability from optional to indispensable capability, pushing the cloud observability market toward deeper end-to-end context.
DevOps/SRE Culture and Real-Time Observability
Site Reliability Engineering is mainstreamed in large enterprises, cutting mean outage costs that exceed USD 1 million per hour. Teams now embed golden signals and service-level objectives into CI/CD pipelines so that defects surface before production rollouts. Full-stack insight lowers downtime by 79% versus siloed toolchains. AI-driven anomaly detection augments humans by surfacing precursors to incidents across logs and traces. Faster feedback loops also boost developer productivity, turning observability into a direct business enabler. The cloud observability market, therefore, benefits from budgets shifting left toward engineering teams rather than traditional IT operations.
Limited Visibility in Containerised, Serverless Stacks
Containers may live for seconds, while serverless functions spin up without agents, leaving gaps that legacy monitors cannot fill. Kubernetes adds torrent-level metadata, so brute-force collection inflates storage bills. Distributed tracing that stitches request paths across microservices, combined with eBPF-based low-overhead instrumentation, is emerging as the remedy. OpenTelemetry is pivotal yet still complex to deploy, explaining slower adoption among resource-constrained SMEs. Until turnkey instrumentation matures, observability gaps in ephemeral environments will drag on the cloud observability market CAGR.
Other drivers and restraints analyzed in the detailed report include:
- AI/ML Workload Explosion Requiring GPU-Level Monitoring
- FinOps Accountability and Cost-to-Value Optimisation Pressure
- Rising TCO of Full-Stack Observability Platforms
For complete list of drivers and restraints, kindly check the Table Of Contents.
Segment Analysis
SaaS platforms anchored 48% of 2024 revenue, underscoring demand for turnkey deployments that remove infrastructure overhead. PaaS solutions shape the fastest lane, growing 29.90% CAGR as users crave deeper code-level insight without managing collectors. IaaS tools retain relevance for hybrid estates that need on-premises collectors close to regulated data. The cloud observability market size for SaaS is forecast to widen by USD 2.7 billion between 2025 and 2030 as lagging industries migrate to managed services.
PaaS momentum reflects platform-engineering teams embedding observability into internal developer portals. Big-tech vendors integrate tracing, chaos testing, and KPI dashboards directly into build pipelines, reducing cognitive load. Combined with OpenTelemetry auto-instrumentation, this synergy accelerates time to value. Consequently, the cloud observability market records almost one-third of net-new bookings from PaaS deals targeting AI model observability and cost analytics.
Solution suites captured 62% revenue in 2024, covering data lakes, correlation engines, and UX analytics. Services consulting, onboarding, and managed observability grow 19.30% CAGR as enterprises struggle to hire observability engineers. Integrator demand is highest in regulated verticals where instrumentation must map to control frameworks.
Vendor roadmaps now bundle advisory hours, certified training, and quick-start packs that shorten proof-of-value cycles. LogicMonitor's USD 800 million funding earmarked for services expansion signals how professional expertise becomes a key moat. As frameworks evolve, recurring service contracts will comprise a larger slice of the overall cloud observability market revenue, deepening partner ecosystems.
The Cloud Monitoring Market Report is Segmented by Cloud Service Model (IaaS, Saas, Paas), Component (Solution and Services), Deployment Mode (Public Cloud, Private Cloud, and Hybrid/Multi-Cloud), Organization Size (SMEs and Large Enterprises), End-User Industry (BFSI, Retail and E-Commerce, IT and Telecommunications, Healthcare and Life Sciences, Government and Public Sector, Manufacturing, and Others), and Geography.
Geography Analysis
North America commanded 41% of 2024 revenue, reflecting decades-long DevOps maturity and heavy AI investment. Financial institutions cite median outage losses of USD 10.44 million per year, justifying premium tooling. Sovereign-cloud talk is muted, yet privacy laws still nudge data residency features. Growth moderates to low teens after 2027 as replacement cycles saturate, but AI observability upgrades sustain license expansion.
Asia Pacific is the fastest mover at 21.30% CAGR, propelled by cloud-first start-ups and government digital drives. India's public cloud outlay could reach USD 25.5 billion by 2028. Observability ROI tops 114% in Singapore and Indonesia, showcasing high payoff for downtime reduction. China's 6.192 trillion-yuan cloud sector, led by Alibaba Cloud's 43% hold, fuels local-language dashboards and in-country data lakes.
Europe records mid-teens CAGR as GDPR and upcoming AI Act cement data-protection demands. Accenture notes 37% of enterprises investing in sovereign cloud, with 44% planning more within two years. Vendors partner with regional hosts to ensure EU-located logging pipelines. Energy dashboards gain traction as climate reporting merges with performance metrics. These regional nuances collectively propel the cloud observability market toward diverse compliance-aware deployments.
- AWS
- Microsoft
- Google Cloud
- IBM
- Oracle
- Datadog
- Dynatrace
- New Relic
- Broadcom (CA Tech/AppDynamics)
- LogicMonitor
- Splunk
- SolarWinds
- PagerDuty
- Cisco ThousandEyes
- Grafana Labs
- Elastic
- Zenoss
- ScienceLogic
- Idera
Additional Benefits:
- The market estimate (ME) sheet in Excel format
- 3 months of analyst support
TABLE OF CONTENTS
1 INTRODUCTION
- 1.1 Study Assumptions and Market Definition
- 1.2 Scope of the Study
2 RESEARCH METHODOLOGY
3 EXECUTIVE SUMMARY
4 MARKET LANDSCAPE
- 4.1 Market Overview
- 4.2 Market Drivers
- 4.2.1 Accelerated multi-cloud and hybrid-cloud adoption
- 4.2.2 DevOps/SRE culture and need for real-time observability
- 4.2.3 AI/ML workload explosion requiring GPU-level monitoring
- 4.2.4 FinOps accountability and cost-to-value optimisation pressure
- 4.2.5 Sustainability dashboards for cloud-carbon reporting
- 4.2.6 Sovereign-cloud and data-localisation mandates
- 4.3 Market Restraints
- 4.3.1 Limited visibility in containerised, serverless stacks
- 4.3.2 Rising TCO of full-stack observability platforms
- 4.3.3 Skills gap for observability engineering
- 4.3.4 Hyperscaler API-rate limits throttling deep telemetry
- 4.4 Value/Supply-Chain Analysis
- 4.5 Regulatory Landscape
- 4.6 Technological Outlook
- 4.7 Porter's Five Forces Analysis
- 4.7.1 Threat of New Entrants
- 4.7.2 Bargaining Power of Suppliers
- 4.7.3 Bargaining Power of Buyers
- 4.7.4 Threat of Substitutes
- 4.7.5 Competitive Rivalry Intensity
5 MARKET SIZE AND GROWTH FORECASTS (VALUE)
- 5.1 By Cloud Service Model
- 5.1.1 IaaS
- 5.1.2 PaaS
- 5.1.3 SaaS
- 5.2 By Component
- 5.2.1 Solution
- 5.2.2 Services
- 5.3 By Deployment Mode
- 5.3.1 Public Cloud
- 5.3.2 Private Cloud
- 5.3.3 Hybrid/Multi-Cloud
- 5.4 By Organisation Size
- 5.4.1 SMEs
- 5.4.2 Large Enterprises
- 5.5 By End-User Industry
- 5.5.1 BFSI
- 5.5.2 Retail and e-Commerce
- 5.5.3 IT and Telecommunications
- 5.5.4 Healthcare and Life Sciences
- 5.5.5 Government and Public Sector
- 5.5.6 Manufacturing
- 5.5.7 Others (Media, Energy, Education)
- 5.6 By Region
- 5.6.1 North America
- 5.6.1.1 United States
- 5.6.1.2 Canada
- 5.6.1.3 Mexico
- 5.6.2 South America
- 5.6.2.1 Brazil
- 5.6.2.2 Argentina
- 5.6.2.3 Rest of South America
- 5.6.3 Europe
- 5.6.3.1 United Kingdom
- 5.6.3.2 Germany
- 5.6.3.3 France
- 5.6.3.4 Spain
- 5.6.3.5 Russia
- 5.6.3.6 Rest of Europe
- 5.6.4 Asia Pacific
- 5.6.4.1 China
- 5.6.4.2 Japan
- 5.6.4.3 India
- 5.6.4.4 South Korea
- 5.6.4.5 Rest Asia Pacific
- 5.6.5 Middle East and Africa
- 5.6.5.1 United Arab Emirates
- 5.6.5.2 Saudi Arabia
- 5.6.5.3 South Africa
- 5.6.5.4 Rest of Middle East and Africa
- 5.6.1 North America
6 COMPETITIVE LANDSCAPE
- 6.1 Market Concentration
- 6.2 Strategic Moves
- 6.3 Market Share Analysis
- 6.4 Company Profiles (includes Global Level Overview, Market Level Overview, Core Segments, Financials, Strategic Information, Market Rank/Share, Products and Services, Recent Developments)
- 6.4.1 AWS
- 6.4.2 Microsoft
- 6.4.3 Google Cloud
- 6.4.4 IBM
- 6.4.5 Oracle
- 6.4.6 Datadog
- 6.4.7 Dynatrace
- 6.4.8 New Relic
- 6.4.9 Broadcom (CA Tech/AppDynamics)
- 6.4.10 LogicMonitor
- 6.4.11 Splunk
- 6.4.12 SolarWinds
- 6.4.13 PagerDuty
- 6.4.14 Cisco ThousandEyes
- 6.4.15 Grafana Labs
- 6.4.16 Elastic
- 6.4.17 Zenoss
- 6.4.18 ScienceLogic
- 6.4.19 Idera
7 MARKET OPPORTUNITIES AND FUTURE OUTLOOK
- 7.1 White-space and Unmet-Need Assessment
 雲端監控市場:按組件、部署方式、組織規模和最終用戶分類 - 全球市場預測(2026-2032 年)
 2026年全球全端可觀測性服務市場報告
 雲端監控市場分析及預測(至 2035 年):類型、產品類型、服務、技術、元件、應用、部署模式、最終使用者、解決方案2026年全球雲端監控市場報告
 2026-2030年全球遠距臨床試驗監查工具市場
 全球雲端監控市場規模、佔有率、趨勢和成長分析報告(2026-2034年)全球雲端監控市場:市場規模、佔有率、成長率、產業分析、依類型、應用和地區劃分的分析以及未來預測(2026-2034年)
 雲端監控市場 - 全球產業規模、佔有率、趨勢、機會及預測(按組件、服務模式、組織規模、垂直產業、地區和競爭格局分類,2021-2031 年)網路安全雲端監控平台市場(依組織規模、服務類型、應用程式類型、部署模式和最終用戶產業分類)-全球預測(2026-2032年)
 雲端監控市場規模、佔有率和成長分析(按組件、組織規模、垂直產業和地區分類)-2026-2033年產業預測