


 |
市場調查報告書
商品編碼
1851631
熱塑性複合材料:市場佔有率分析、行業趨勢、統計數據和成長預測(2025-2030 年)Thermoplastic Composites - Market Share Analysis, Industry Trends & Statistics, Growth Forecasts (2025 - 2030) |
||||||
※ 本網頁內容可能與最新版本有所差異。詳細情況請與我們聯繫。
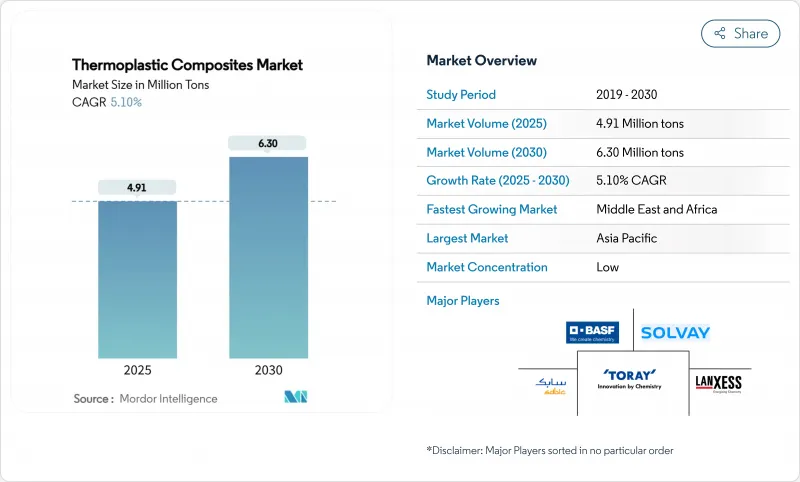
預計到 2025 年熱塑性複合材料市場規模將達到 491 萬噸,到 2030 年將達到 630 萬噸,預測期(2025-2030 年)複合年成長率為 5.10%。
產能的擴張意味著,預計到2030年,超過三分之一的材料產能尚未建成,這使得能夠快速擴大規模的製造商擁有價格優勢。同時,可回收利用工程項目的增加表明,未來部分產能將來自回收物料,而不僅僅是待開發區能,這微妙地改變了長期成本曲線,使一體化回收企業更具優勢。區域和終端市場的分佈表明,成長路徑將呈現雙管齊下:亞太地區的高通量應用將主導產能成長,而北美和歐洲的航太專案將引領價值和技術主導。
全球熱塑性複合材料市場趨勢與洞察
歐洲和美國迅速推出車輛輕量化強制令
隨著兩地車隊平均排放氣體法規的日益嚴格,乘用車每減重10公斤,都會對目標商標產品製造商(OEM)造成巨大的經濟負擔。熱塑性複合材料比鋼材輕30-40%,這意味著,採用複合材料鋼板彈簧和座椅框架的中型車輛,無需改變電池化學成分,即可增加約15公里的純電續航里程。來自設計工作室的最新反饋表明,複合複合材料組件易於焊接,帶來了意想不到的好處,例如縮短原型前置作業時間和加快車型更新速度。因此,即使是供應鏈團隊也開始從法規遵循和產品上市時間這兩個角度來看待輕量化問題。
原始設備製造商正努力在電動交通推廣可回收複合材料解決方案
汽車製造商正日益設定內部目標,以確保電池機殼和底盤護板中至少 30% 的複合材料可進行機械回收。由於熱塑性複合材料(與熱固性材料不同)可以熔融再加工,模塑商和原始設備製造商 (OEM) 之間的閉合迴路協議現在已直接寫入採購合約。財務部門不僅將可回收性視為永續性指標,還將其視為對沖原生樹脂價格波動的一種手段。因此,採購團隊在計算總擁有成本 (TCO) 時,越來越重視報廢價值回收,甚至在明確的監管政策訂定之前,就已經在潛移默化地傾向於熱塑性材料。
原料成本上漲和成型製程挑戰
即使經過20年的製程改進,高性能樹脂(例如PEEK)的價格仍然比中等價格分佈的替代品高出20-40%。加工溫度通常超過350°C,迫使製造商投資建造資本密集的高壓釜和壓機系統。然而,新興的推測表明,五年內,封閉式回收技術的突破可能使再生PEEK和碳纖維的供應成本低於原生聚醯胺,從而打破以往的價格格局。如果這種情況成為現實,零件設計人員可能會重新評估材料的選擇,不再僅僅考慮性價比,而是完全基於性能進行選擇。
細分市場分析
預計到2024年,聚醯胺將維持熱塑性複合材料市場38%的佔有率,而PEEK預計將在2025年至2030年間以6.01%的複合年成長率成長,這表明其銷量和價值之間存在明顯的差異。這種結構表明,雙源籌資策略仍將是常態,因為原始設備製造商(OEM)需要在關鍵零件中平衡PEEK的性能餘量和聚醯胺的成本優勢。由此可以推斷,如果再生PEEK實現商業性化,其整體成本優勢的縮小速度將快於歷史市場趨勢,從而可能加速航太卡扣和支架等零件的替代。
生物基和回收的 PA6 正在被應用於消費性電子產品的外殼中,因為低碳足跡是優先考慮的因素,而高玻璃纖維 PA66 繼續主導著汽車引擎蓋下的零件。
到2024年,玻璃纖維將佔據熱塑性複合材料88%的市場佔有率,而碳纖維預計到2030年將以5.75%的複合年成長率成長,這主要得益於航太、高階汽車和儲能領域對高模量解決方案的採用。這種日益擴大的市場佔有率表明,兩種纖維的供應商都可以透過服務不同的應用領域來規避原料價格波動的影響。由此可以推斷,碳纖維產能成長可能會暫時超過需求成長,進而可能壓縮淨利率,而中階應用領域的普及速度可能會超出預期。
區域分析
亞太地區熱塑性複合材料市場佔有率高達48%,這得益於其完善的製造生態系統,該系統將聚合物混煉、纖維製造和零件成型整合於單一經濟體中,從而最大限度地降低了物流成本。光是中國對電動車電池機殼的需求就足以影響全球PP和PA6的供需平衡,這種動態賦予了區域買家基於銷售的定價權。中東和非洲是成長最快的地區,複合年成長率達5.65%。
北美之所以發展良好,是因為它是民航機機身熱塑性塑膠認證的中心。聯邦政府對永續航空燃料的研究經費也間接促進了複合材料的需求,因為更輕的飛機可以最大限度地節省燃料。歐洲也緊跟其後,制定了嚴格的汽車碳排放標準,並建立了風力發電供應體系,正在試用熱塑性塑膠葉片。
其他福利:
- Excel格式的市場預測(ME)表
- 3個月的分析師支持
目錄
第1章 引言
- 研究假設和市場定義
- 調查範圍
第2章調查方法
第3章執行摘要
第4章 市場情勢
- 市場概覽
- 市場促進因素
- 歐洲和美國迅速推出車輛輕量化強制令
- 原始設備製造商正努力在電動交通推廣可回收複合材料解決方案
- 亞太地區液化天然氣和氫氣儲存大型企劃管道
- 智慧電子產品外殼中的熱塑性包覆成型
- 軍方對耐損傷和雷達滲透性結構的需求
- 市場限制
- 熱塑性複合材料高成本且成型製程面臨許多挑戰
- 認可度和標準化程度有限
- 來自熱固性複合材料的競爭壓力
- 價值鏈分析
- 波特五力模型
- 供應商的議價能力
- 買方的議價能力
- 新進入者的威脅
- 替代品的威脅
- 競爭對手之間的競爭
第5章 市場規模與成長預測
- 依樹脂類型
- 聚丙烯(PP)
- 聚醯胺(PA)
- 聚醚醚酮(PEEK)
- 其他樹脂類型
- 依纖維類型
- 玻璃纖維
- 碳纖維
- 其他纖維類型
- 依產品類型
- 短纖維熱塑性塑膠(SFT)
- 長纖維熱塑性塑膠(LFT)
- 連續纖維熱塑性塑膠(CFT)
- 玻璃纖維隔板熱塑性塑膠(GMT)
- 按最終用戶行業分類
- 車
- 航太/國防
- 電氣和電子
- 建造
- 醫療保健
- 其他最終用戶
- 按地區
- 亞太地區
- 中國
- 日本
- 印度
- 韓國
- ASEAN
- 亞太其他地區
- 北美洲
- 美國
- 加拿大
- 墨西哥
- 歐洲
- 德國
- 英國
- 法國
- 義大利
- 西班牙
- 其他歐洲地區
- 南美洲
- 巴西
- 阿根廷
- 其他南美洲
- 中東和非洲
- 沙烏地阿拉伯
- 阿拉伯聯合大公國
- 南非
- 奈及利亞
- 其他中東和非洲地區
- 亞太地區
第6章 競爭情勢
- 市場集中度
- 策略趨勢
- 市佔率分析
- 公司簡介
- Arkema
- Avient Corporation
- BASF
- Celanese Corporation
- Daicel Corporation
- dsm-firmenich
- DuPont
- Hexcel Corporation
- LANXESS
- LyondellBasell Industries Holdings BV
- Mitsubishi Chemical Group Corporation
- Owens Corning
- RTP Company
- SABIC
- SGL Carbon
- Solvay
- TechnoCompound GmbH
- TEIJIN LIMITED
- TORAY INDUSTRIES, INC.
- Victrex plc
第7章 市場機會與未來展望
The Thermoplastic Composites Market size is estimated at 4.91 Million tons in 2025, and is expected to reach 6.30 Million tons by 2030, at a CAGR of 5.10% during the forecast period (2025-2030).
This volume expansion implies that more than one-third of the material capacity expected in 2030 is not yet installed today, so producers that can scale quickly will have a pricing advantage. A parallel rise in design-for-recycling programs indicates that part of this future capacity will come from reclaimed streams rather than only greenfield capacity, which subtly shifts long-term cost curves in favor of integrated recyclers. The geography and end-market distributions imply a dual-track growth path: volume is led by Asia-Pacific high-throughput applications, whereas value and technology leadership are anchored in North American and European aerospace programs.
Global Thermoplastic Composites Market Trends and Insights
Rapid Vehicle Lightweighting Mandates in Europe and the United States
Regulatory fleet-average emissions limits in both regions have tightened enough that every 10 kg of weight removed from a passenger car has become financially material to original-equipment manufacturers (OEMs). Thermoplastic Composites enable weight cuts of 30 to 40% against steel, so a midsize vehicle that adopts composite leaf springs or seat frames can gain roughly 15 km of additional electric-range equivalence without changing battery chemistry. A fresh inference from recent design-studio feedback is that the ease of welding composite sub-assemblies is shrinking prototype lead times, providing an unexpected benefit in faster model refresh cycles. As a result, even supply-chain teams are viewing weight savings through the twin lenses of regulatory compliance and accelerated time-to-market.
OEM Push for Recyclable Composite Solutions in E-Mobility
Automakers increasingly set internal targets that at least 30% of composite content in battery enclosures and under-body shields be mechanically recyclable. Unlike thermosets, Thermoplastic Composites industry solutions can be melt-reprocessed, so closed-loop contracts between molders and OEMs are now written directly into sourcing agreements. One emergent inference is that finance departments are treating recyclability not only as a sustainability metric but also as a hedge against volatile virgin-resin pricing. Consequently, procurement teams are weighing end-of-life value recovery when calculating total cost of ownership, which subtly favors thermoplastics even before explicit regulatory credit is offered.
High Cost of Raw Materials and Forming Challenges
Even after two decades of incremental process improvements, high-performance resins such as PEEK still carry a 20 to 40% price premium over mid-range alternatives. Because processing temperatures often exceed 350 °C, manufacturers invest in autoclaves and press systems with higher capital intensity, so amortization per part remains significant for small series. A novel inference, however, is that closed-loop recycling breakthroughs now promise to supply reclaimed PEEK and carbon fiber at cost levels below virgin polyamide within five years, which could flatten the historic price hierarchy. If that scenario plays out, component designers may re-rank materials based on performance alone rather than cost-performance trade-offs.
Other drivers and restraints analyzed in the detailed report include:
- Asia-Pacific Megaproject Pipeline for LNG and Hydrogen Storage
- Thermoplastic Over-Moulding Adoption in Smart Electronics Housings
- Limited Awareness and Standardization
For complete list of drivers and restraints, kindly check the Table Of Contents.
Segment Analysis
Polyamide maintains 38% Thermoplastic Composites market share in 2024, whereas PEEK is projected to record a 6.01% CAGR between 2025-2030, reflecting a clear split between volume and value segments. This configuration signals that dual-sourcing strategies will remain standard, because OEMs balance the cost advantages of PA against the performance headroom of PEEK in critical parts. A logical inference is that as PEEK recyclate becomes commercially viable, overall cost parity could close faster than historical adoption curves suggest, accelerating substitution in aerospace clips and brackets.
Bio-based and recycled PA6 variants are gaining purchase in consumer-electronics casings where brand owners prioritise low carbon footprints, while high-glass-fiber PA66 continues to dominate automotive under-the-hood components.
Glass fiber secures 88% Thermoplastic Composites market size share in 2024, yet carbon fiber is expected to expand at a 5.75% CAGR through 2030 as aerospace, premium automotive, and energy storage adopt higher modulus solutions. The widening split indicates manufacturers supplying both fibers can hedge against raw-material price swings while servicing divergent application sets. An immediate inference is that capacity additions in carbon fiber could outpace demand growth temporarily, potentially compressing margins and enabling penetration of mid-tier applications earlier than forecast.
The Thermoplastic Composites Market Report Segments the Industry by Resin Type (Polypropylene (PP), Polyamide (PA), and More), Fiber Type (Glass Fiber, and More), Product Type (Short Fiber Thermoplastic (SFT), Long Fiber Thermoplastic (LFT), and More), End-User Industry (Automotive, Aerospace and Defense, and More), and Geography (Asia-Pacific, North America, Europe, South America, and Middle East and Africa).
Geography Analysis
Asia-Pacific's 48% Thermoplastic Composites market share rests on a manufacturing ecosystem that integrates polymer synthesis, fiber production, and part moulding within single economic zones, minimizing logistics costs. China's EV battery enclosure demand alone is large enough to influence global PP and PA6 supply-demand balances, a dynamic that grants regional buyers volume-based pricing leverage. The Middle-East and Africa are the fastest-growing regions with a 5.65% CAGR.
North America is buoyed by its role as the epicentre of thermoplastic qualification for commercial aircraft fuselages. Federal research funding into sustainable aviation fuel also indirectly benefits composite demand, because lighter airframes maximize fuel-saving returns. Europe follows closely, driven by stringent vehicle carbon-emission standards and a well-established wind energy supply base that is experimenting with thermoplastic blades.
- Arkema
- Avient Corporation
- BASF
- Celanese Corporation
- Daicel Corporation
- dsm-firmenich
- DuPont
- Hexcel Corporation
- LANXESS
- LyondellBasell Industries Holdings B.V.
- Mitsubishi Chemical Group Corporation
- Owens Corning
- RTP Company
- SABIC
- SGL Carbon
- Solvay
- TechnoCompound GmbH
- TEIJIN LIMITED
- TORAY INDUSTRIES, INC.
- Victrex plc
Additional Benefits:
- The market estimate (ME) sheet in Excel format
- 3 months of analyst support
TABLE OF CONTENTS
1 Introduction
- 1.1 Study Assumptions and Market Definition
- 1.2 Scope of the Study
2 Research Methodology
3 Executive Summary
4 Market Landscape
- 4.1 Market Overview
- 4.2 Market Drivers
- 4.2.1 Rapid Vehicle-Light-Weighting Mandates in the Europe and United States
- 4.2.2 OEM Push for Recyclable Composite Solutions in E-Mobility
- 4.2.3 Asia-Pacific Megaproject Pipeline for LNG and Hydrogen Storage
- 4.2.4 Thermoplastic Over-Moulding Adoption in Smart Electronics Housings
- 4.2.5 Military Demand for Damage-Tolerant, Radar-Transparent Structures
- 4.3 Market Restraints
- 4.3.1 High Cost of Raw Materials and Challenges to Form Thermoplastic Composites
- 4.3.2 Limited Awareness and Standardization
- 4.3.3 Competitive Pressure from Thermoset Composites
- 4.4 Value Chain Analysis
- 4.5 Porter's Five Forces
- 4.5.1 Bargaining Power of Suppliers
- 4.5.2 Bargaining Power of Buyers
- 4.5.3 Threat of New Entrants
- 4.5.4 Threat of Substitutes
- 4.5.5 Competitive Rivalry
5 Market Size and Growth Forecasts (Volume)
- 5.1 By Resin Type
- 5.1.1 Polypropylene (PP)
- 5.1.2 Polyamide (PA)
- 5.1.3 Polyether-ether-ketone (PEEK)
- 5.1.4 Other Resin Types
- 5.2 By Fiber Type
- 5.2.1 Glass Fiber
- 5.2.2 Carbon Fiber
- 5.2.3 Other Fiber Types
- 5.3 By Product Type
- 5.3.1 Short-Fiber Thermoplastic (SFT)
- 5.3.2 Long-Fiber Thermoplastic (LFT)
- 5.3.3 Continuous-Fiber Thermoplastic (CFT)
- 5.3.4 Glass-Mat Thermoplastic (GMT)
- 5.4 By End-User Industry
- 5.4.1 Automotive
- 5.4.2 Aerospace and Defense
- 5.4.3 Electrical and Electronics
- 5.4.4 Construction
- 5.4.5 Medical
- 5.4.6 Other End-Users
- 5.5 By Geography
- 5.5.1 Asia-Pacific
- 5.5.1.1 China
- 5.5.1.2 Japan
- 5.5.1.3 India
- 5.5.1.4 South Korea
- 5.5.1.5 ASEAN
- 5.5.1.6 Rest of Asia-Pacific
- 5.5.2 North America
- 5.5.2.1 United States
- 5.5.2.2 Canada
- 5.5.2.3 Mexico
- 5.5.3 Europe
- 5.5.3.1 Germany
- 5.5.3.2 United Kingdom
- 5.5.3.3 France
- 5.5.3.4 Italy
- 5.5.3.5 Spain
- 5.5.3.6 Rest of Europe
- 5.5.4 South America
- 5.5.4.1 Brazil
- 5.5.4.2 Argentina
- 5.5.4.3 Rest of South America
- 5.5.5 Middle-East and Africa
- 5.5.5.1 Saudi Arabia
- 5.5.5.2 United Arab Emirates
- 5.5.5.3 South Africa
- 5.5.5.4 Nigeria
- 5.5.5.5 Rest of Middle-East and Africa
- 5.5.1 Asia-Pacific
6 Competitive Landscape
- 6.1 Market Concentration
- 6.2 Strategic Moves
- 6.3 Market Share Analysis
- 6.4 Company Profiles (includes Global level Overview, Market level overview, Core Segments, Financials as available, Strategic Information, Market Rank/Share for key companies, Products and Services, and Recent Developments)
- 6.4.1 Arkema
- 6.4.2 Avient Corporation
- 6.4.3 BASF
- 6.4.4 Celanese Corporation
- 6.4.5 Daicel Corporation
- 6.4.6 dsm-firmenich
- 6.4.7 DuPont
- 6.4.8 Hexcel Corporation
- 6.4.9 LANXESS
- 6.4.10 LyondellBasell Industries Holdings B.V.
- 6.4.11 Mitsubishi Chemical Group Corporation
- 6.4.12 Owens Corning
- 6.4.13 RTP Company
- 6.4.14 SABIC
- 6.4.15 SGL Carbon
- 6.4.16 Solvay
- 6.4.17 TechnoCompound GmbH
- 6.4.18 TEIJIN LIMITED
- 6.4.19 TORAY INDUSTRIES, INC.
- 6.4.20 Victrex plc
7 Market Opportunities and Future Outlook
- 7.1 White-Space and Unmet-Need Assessment
- 7.2 Wide Application Scope in the Healthcare Sector
 熱塑性複合材料市場:依纖維類型、製造流程、產品形式、樹脂類型和最終用途產業分類-2026-2032年全球市場預測
 熱塑性複合材料市場規模、佔有率、成長及全球產業分析:按類型、應用和地區分類,並提供2026-2034年的洞察和預測
 2026年全球熱塑性複合材料市場報告工業用聚四氟乙烯複合材料市場(依複合材料類型、加工方法、形態、應用和最終用途產業分類)-2026-2032年全球預測氧化鋯陶瓷連續纖維市場:依纖維類型、等級、銷售管道、應用和最終用途產業分類-全球預測,2026-2032年熱可塑性橡膠化合物市場按產品類型、形態、應用和分銷管道分類-2026-2032年全球預測
 熱固性模塑材料市場規模、佔有率及成長分析(依樹脂類型、成型類型、最終用途產業及地區分類)-2026-2033年產業預測
 熱塑性複合材料市場規模、佔有率和成長分析(按樹脂類型、纖維類型、產品類型、最終用途產業和地區分類)-2026年至2033年產業預測
 氧化鋁纖維和氧化鋁連續纖維:全球市場佔有率和排名、總收入和需求預測(2025-2031 年)
 熱塑性複合材料市場(2025-2029)