


 |
市場調查報告書
商品編碼
1910476
高效能資料分析:市場佔有率分析、產業趨勢與統計、成長預測(2026-2031)High-Performance Data Analytics - Market Share Analysis, Industry Trends & Statistics, Growth Forecasts (2026 - 2031) |
||||||
※ 本網頁內容可能與最新版本有所差異。詳細情況請與我們聯繫。
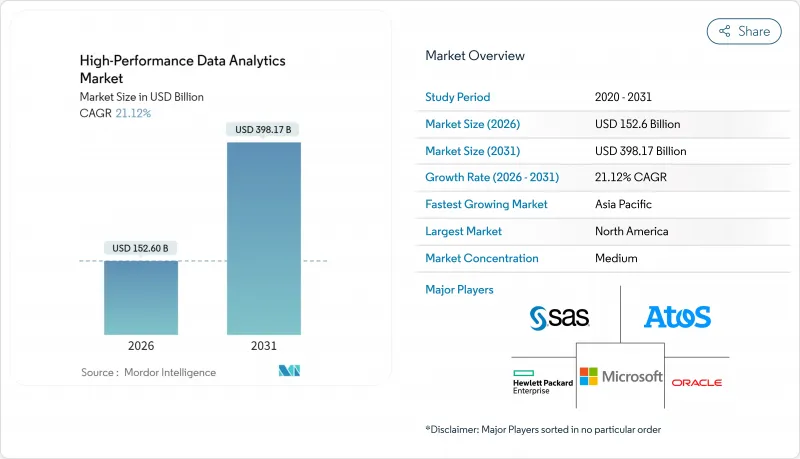
高效能資料分析市場預計將從 2025 年的 1,259.9 億美元成長到 2026 年的 1,526 億美元,預計到 2031 年將達到 3,981.7 億美元,2026 年至 2031 年的複合年成長率為 21.12%。
人工智慧、雲端運算和企業數據爆炸性成長共同推動了這一成長勢頭。金融服務仍然是領先的應用領域,因為即時詐欺分析對於確保銀行交易安全至關重要。雖然軟體收入佔比高達 46.2%,但服務板塊的成長速度最快,這主要得益於專業的 AI 諮詢服務。目前,本地部署主導主導地位,市場佔有率高達 57.8%,但隨著供應商不斷擴大全球 GPU 容量,雲端解決方案以 30.1% 的複合年成長率 (CAGR) 成為明顯的成長引擎。從區域來看,北美市場佔有率為 35.4%,但由於亞太地區正在大力推動數位轉型,預計該地區將實現最快成長。雖然大型企業是目前的主導力量,但 GPU 租賃價格的暴跌正在縮小與中小企業之間的差距。例如,H100 實例每小時 3.35 美元的價格比超大規模資料中心業者大規模資料中心的標價低 90% 以上。
全球高性能資料分析市場趨勢與洞察
加速在銀行、金融服務和保險 (BFSI) 行業中採用即時分析技術進行詐欺檢測
社交工程詐騙激增十倍,目前已佔數位銀行詐騙的23%,這正推動金融機構迅速採用高效能詐騙偵測引擎。道明銀行(TD Bank)在榮獲2024年FICO決策獎後,實現了企業級即時監控。該人工智慧平台在處理1Gbps資料流的同時,也能達到98.5%的偵測準確率,且無延遲。因此,銀行、金融服務和保險(BFSI)機構正在將低延遲分析技術融入支付系統、信用風險評分和客戶身份驗證(KYC)流程,以保護其聲譽和財務資本。這些應用為高效能資料分析市場整體5.2%的複合年成長率奠定了基礎。
人工智慧/機器學習模型訓練的快速成長需要Petabyte級資料處理。
生成式人工智慧模型中的參數數量每六個月加倍,這需要Petabyte的資料擷取和百萬兆級計算叢集。與人工智慧工作負載相關的超大規模資料中心投資預計將從2024年的1,627.9億美元增加到2030年的6,085.4億美元。微軟和Google等供應商已為下一代人工智慧設施總合撥款1,550億美元。這些資本支出將推動對分散式檔案系統、高吞吐量互連和高階調度軟體的需求,從而促進市場成長6.8%。
專用高效能運算叢集的總擁有成本高
預計到2025年,資料中心建設的資本支出將超過2,500億美元,而不斷成長的電力需求預計到2030年還將增加5,000億美元。許多開發中國家面臨電力短缺,這阻礙了本地高效能運算(HPC)設施的推出。設備、冷卻和熟練人員的人事費用,使得企業難以證明部署本地叢集的合理性,從而抑制了資源匱乏地區的部署,並導致整體複合年成長率僅為2.1%。
細分市場分析
到2025年,軟體業務將佔總營收的45.78%,反映出市場對使用者友善分析引擎、資料架構層和AI編配工具的需求。供應商正在整合工作流程自動化和特徵儲存功能,以加速跨業務部門的模型部署。 DevOps整合正在縮短回饋週期,授權結構也正轉向與價值創造掛鉤的付費使用制。硬體銷售將繼續保持其基礎性地位,這主要得益於矽技術的進步,例如NVIDIA Blackwell Ultra GPU,它能夠為變壓器工作負載提供高密度張量核心。
服務領域成長最快,預計到2031年將以25.05%的複合年成長率成長。諮詢團隊目前正將資料策略設計、MLOps實施和持續模型調校服務打包,以填補複雜混合架構中的專業知識缺口。服務提供者開始提供人工智慧即服務(AIaaS)編配,包括託管特徵工程、偏差審核和聯邦學習編排。這些變化正在擴大潛在需求,並推動高效能資料分析即服務合約的市場規模成長,尤其是在首次採用者該服務的企業用戶中。
截至2025年,本地部署將佔據57.05%的市場佔有率,這主要得益於對延遲和資料主權要求較高的行業,例如政府機構和銀行業。各組織機構表示,直接控制硬體以及遵守嚴格的資料居住法規是其主要動機。許多公司正在利用現有資料中心的沉沒成本,透過節點更新來最佳化運轉率,而不是完全遷移到雲端。
受彈性擴展、付費使用制和全球邊緣區域部署的推動,雲端平台正以 29.25% 的複合年成長率 (CAGR) 成長。為了緩解監管方面的擔憂,服務提供者正在擴展機密運算實例和主權雲端區域。混合雲和多重雲端模式在新計畫佔據主導地位,將本地加速器與用於人工智慧訓練的突發容量相結合。這種轉變正在擴大以消費為導向的高效能資料分析市場規模,同時降低資源受限企業的進入門檻。
區域分析
2025年,北美地區維持了34.85%的收入佔有率,這主要得益於其龐大的超超大規模資料中心業者資料中心佈局和企業級人工智慧的早期應用。為滿足人工智慧推理的激增需求,美國資料中心供應量年增26%,達到5.2吉瓦。 TD銀行等金融機構已採用利用全國支付遙測數據的即時詐欺評分技術,顯示該行業已日趨成熟。預計2024年北維吉尼亞的租金將上漲41.6%,顯示產能緊張正在推動資料中心的持續擴張。
亞太地區預計將成為成長最快的地區,複合年成長率將達到27.2%。印度計劃在2026年將其資料中心裝置容量加倍,達到約1.8吉瓦,這得益於國內外投資者數十億美元的投資。台灣預計到2028年將在設施建設方面投入超過30億美元,以滿足晶片設計模擬和大型語言模型(LLM)訓練的需求。中國正在縮小與美國在模型品質方面的差距,省級津貼正在刺激下一代人工智慧框架的開發。然而,嚴格的資料本地化法規迫使企業建構特定國家的分析堆疊,而不是統一的全球基礎架構。
歐洲正大力推動邊緣到雲端的轉型,以實現製造業和關鍵基礎設施的現代化。歐盟的目標是到2030年實現75%的企業雲採用率,並部署1萬個氣候中和的邊緣節點。各國政府正在資助6G測試平台(需要低延遲分析)、通訊業者邊緣雲端試點計畫以及工業元宇宙示範計劃。歐洲首家人工智慧工廠將於2024年投入運營,為希望在不匯出資料的情況下訓練模型的汽車、航太和能源公司提供自主運算環境。
其他福利:
- Excel格式的市場預測(ME)表
- 3個月的分析師支持
目錄
第1章 引言
- 研究假設和市場定義
- 調查範圍
第2章調查方法
第3章執行摘要
第4章 市場情勢
- 市場概覽
- 市場促進因素
- 加速北美金融服務業(BFSI)採用即時分析技術進行詐欺偵測
- 亞洲人工智慧/機器學習模型訓練的快速成長需要Petabyte級資料處理能力。
- 歐洲智慧製造領域高效能運算從邊緣到雲端的發展
- 中東各國政府的國防巨量資料現代化項目
- 可再生能源電網最佳化舉措推動南美洲高效能運算分析的發展
- GPU/CPU叢集單核心成本的下降使得全球中小企業能夠負擔得起高效能運算(HPC)。
- 市場限制
- 加勒比海和非洲專用高效能運算叢集的總擁有成本高昂
- 歐洲和大洋洲缺乏熟練的高效能運算和平行程式設計專家
- 資料主權法規限制了亞洲的跨境雲分析。
- 新興市場的基礎設施可靠性問題阻礙了數據的連續傳輸。
- 監理展望
- 技術展望
- 高效能叢集運算的演進
- 網格計算
- 記憶體內分析
- 資料庫庫內分析
- 波特五力分析
- 供應商的議價能力
- 買方的議價能力
- 新進入者的威脅
- 替代品的威脅
- 競爭對手之間的競爭
- 投資分析
第5章 市場規模與成長預測
- 按組件
- 硬體
- 軟體
- 服務
- 按部署模式
- 本地部署
- 按需/雲端
- 按組織規模
- 小型企業
- 主要企業
- 按最終用戶行業分類
- 銀行、金融服務和保險(BFSI)
- 政府和國防機構
- 能源與公用事業
- 零售與電子商務
- 醫療保健和生命科學
- 通訊和資訊科技服務
- 製造業
- 按地區
- 北美洲
- 美國
- 加拿大
- 墨西哥
- 南美洲
- 巴西
- 阿根廷
- 智利
- 秘魯
- 其他南美洲
- 歐洲
- 德國
- 英國
- 法國
- 義大利
- 西班牙
- 其他歐洲
- 亞太地區
- 中國
- 日本
- 韓國
- 印度
- 澳洲
- 紐西蘭
- 亞太其他地區
- 中東
- 阿拉伯聯合大公國
- 沙烏地阿拉伯
- 土耳其
- 其他中東地區
- 非洲
- 南非
- 其他非洲地區
- 北美洲
第6章 競爭情勢
- 策略發展
- 供應商定位分析
- 公司簡介
- Amazon Web Services, Inc.(AWS)
- Google LLC
- Microsoft Corporation
- IBM Corporation
- Hewlett Packard Enterprise(HPE)
- Dell Technologies Inc.
- SAS Institute Inc.
- Oracle Corporation
- Fujitsu Limited
- Intel Corporation
- ATOS SE
- Juniper Networks Inc.
- NEC Corporation
- Cisco Systems, Inc.
- Teradata Corporation
- Cray Inc.(HPE Cray)
- Altair Engineering Inc.
- Cloudera, Inc.
- Huawei Technologies Co., Ltd.
- Hitachi Vantara LLC
- Super Micro Computer, Inc.
第7章 市場機會與未來展望
The high-performance data analytics market is expected to grow from USD 125.99 billion in 2025 to USD 152.6 billion in 2026 and is forecast to reach USD 398.17 billion by 2031 at 21.12% CAGR over 2026-2031.
Momentum comes from the convergence of AI, cloud computing, and the swelling volume of enterprise data. Financial services remain a prime adopter as real-time fraud analytics become essential for secure transaction banking. Software accounts for 46.2% revenue, while services are expanding fastest on the back of specialized AI consulting. On-premise deployments presently lead with 57.8% share, yet cloud-based solutions are the clear growth engine at a 30.1% CAGR as providers scale global GPU capacity. Regionally, North America commands 35.4% share, but Asia-Pacific is on track for the quickest gains given sweeping digital-transformation programs. Large enterprises dominate adoption, though SMEs are narrowing the gap thanks to plummeting GPU rental rates, exemplified by USD 3.35-per-hour H100 instances that undercut hyperscaler list prices by more than 90%.
Global High-Performance Data Analytics Market Trends and Insights
Accelerating Adoption of Real-Time Analytics in BFSI for Fraud Detection
Financial institutions have recorded a tenfold rise in social-engineering scams, now 23% of digital-banking fraud cases, prompting rapid rollouts of high-performance fraud-detection engines. TD Bank achieved enterprise-wide real-time monitoring after winning the 2024 FICO Decisions Award. AI-enabled platforms are attaining 98.5% detection accuracy while processing 1 Gbps data streams without latency. As a result, BFSI institutions are embedding low-latency analytics into payment rails, credit-risk scoring, and know-your-customer checks to safeguard reputational and financial capital. These deployments underpin a 5.2% lift in the overall CAGR for the high-performance data analytics market.
Surge in AI/ML Model Training Requiring Petabyte-Scale Data Processing
Generative-AI models are doubling in parameter count every six months, demanding petabyte-scale data ingestion and exascale compute clusters. Hyperscale data-center investment tied to AI workloads is set to climb from USD 162.79 billion in 2024 to USD 608.54 billion by 2030. Providers such as Microsoft and Google have earmarked a combined USD 155 billion for next-generation AI facilities. This capital outlay elevates demand for distributed file systems, high-throughput interconnects, and advanced scheduling software, translating into a 6.8% positive push on market growth.
High Total Cost of Ownership for Dedicated HPC Clusters
Capital expenditure on data-center builds is projected to surpass USD 250 billion in 2025, and expanding power needs add a further USD 500 billion through 2030. Many developing nations face electricity shortfalls that hinder the launch of local HPC facilities. Organizations struggle to justify on-premise clusters once equipment, cooling, and skilled-staff costs are tallied, curbing adoption in resource-constrained regions and trimming overall CAGR by 2.1%.
Other drivers and restraints analyzed in the detailed report include:
- Growth of Edge-to-Cloud HPC for Smart Manufacturing
- Falling Cost-Per-Core for GPU/CPU Clusters Enabling Affordable HPC for SMEs
- Shortage of Skilled HPC & Parallel-Programming Professionals
For complete list of drivers and restraints, kindly check the Table Of Contents.
Segment Analysis
The software segment generated 45.78% of revenue in 2025, reflecting demand for user-friendly analytics engines, data-fabric layers, and AI orchestration tools. Vendors are embedding workflow automation and feature-store capabilities that hasten model deployment across business units. DevOps integration is tightening feedback cycles, and license structures are shifting toward consumption-based billing that aligns cost with value creation. Hardware sales remain foundational, propelled by silicon advances such as NVIDIA Blackwell Ultra GPUs that field higher tensor-core density for transformer workloads.
Services are the quickest-expanding line, projected at 25.05% CAGR through 2031. Consulting teams now bundle data-strategy design, MLOps implementation, and continuous-model-tuning services, filling expertise gaps in complex hybrid stacks. Providers are launching AI-as-a-Service offerings that include managed feature engineering, bias auditing, and federated-learning orchestration. These shifts broaden addressable demand and lift the high-performance data analytics market size for service engagements, especially among first-time enterprise adopters.
On-premise deployments held 57.05% share in 2025, anchored by sectors that guard latency or sovereignty, including government and banking. Organizations cite direct hardware control and compliance with strict data-residency statutes as prime motives. Many firms also leverage existing data-center sunk costs, optimizing occupancy rates by refreshing nodes rather than migrating wholesale to cloud.
Cloud platforms are climbing at a 29.25% CAGR, propelled by elastic scaling, consumption pricing, and global edge-zone rollouts. Providers have broadened confidential-computing instances and sovereign-cloud regions to mollify regulatory concerns. Hybrid and multi-cloud patterns now dominate greenfield projects, combining local accelerators with burst capacity for AI training. The shift is enlarging the high-performance data analytics market size attached to consumption models while easing entry for resource-constrained enterprises.
The High-Performance Data Analytics Market Report is Segmented by Component (Hardware, Software, and Services), Deployment Model (On-Premise, and On-Demand/Cloud), Organization Size (Small and Medium Enterprises, and Large Enterprises), End-User Industry (BFSI, Government and Defense, Energy and Utilities, and More), and Geography. The Market Forecasts are Provided in Terms of Value (USD).
Geography Analysis
North America maintained 34.85% revenue leadership in 2025, buoyed by deep hyperscaler footprints and early enterprise AI adoption. U.S. data-center supply rose by 26% year on year to 5.2 GW, matching proliferating AI inference demand. Banks such as TD leverage national payment telemetry for instant fraud scoring, underscoring sector maturity. Rental rates in Northern Virginia advanced 41.6% in 2024, evidencing tight capacity that spurs continued build-outs.
Asia-Pacific is the fastest-growing region with a 27.2% CAGR outlook. India plans to double installed data-center capacity to nearly 1.8 GW by 2026, underwritten by multibillion-dollar commitments from domestic and global investors. Taiwan's facility builds are forecast to exceed USD 3 billion by 2028 to service chip-design simulations and large-language-model training. China is closing the model-quality gap with the United States, with provincial grants catalyzing next-generation AI frameworks. Yet, stringent data-localization rules are compelling firms to engineer country-specific analytics stacks rather than unified global fabrics.
Europe is scaling edge-to-cloud initiatives to modernize manufacturing and critical infrastructure. The EU aims to reach 75% business-cloud adoption and deploy 10,000 climate-neutral edge nodes by 2030. National programs channel capital toward 6G testbeds, telco-edge cloud pilots, and industrial metaverse demonstrators that require low-latency analytics. The opening of the first European AI factories in 2024 provides sovereign compute for automotive, aerospace, and energy firms seeking to train models without exporting data.
- Amazon Web Services, Inc. (AWS)
- Google LLC
- Microsoft Corporation
- IBM Corporation
- Hewlett Packard Enterprise (HPE)
- Dell Technologies Inc.
- SAS Institute Inc.
- Oracle Corporation
- Fujitsu Limited
- Intel Corporation
- ATOS SE
- Juniper Networks Inc.
- NEC Corporation
- Cisco Systems, Inc.
- Teradata Corporation
- Cray Inc. (HPE Cray)
- Altair Engineering Inc.
- Cloudera, Inc.
- Huawei Technologies Co., Ltd.
- Hitachi Vantara LLC
- Super Micro Computer, Inc.
Additional Benefits:
- The market estimate (ME) sheet in Excel format
- 3 months of analyst support
TABLE OF CONTENTS
1 Introduction
- 1.1 Study Assumptions and Market Definition
- 1.2 Scope of the Study
2 Research Methodology
3 Executive Summary
4 Market Landscape
- 4.1 Market Overview
- 4.2 Market Drivers
- 4.2.1 Accelerating Adoption of Real-Time Analytics in BFSI for Fraud Detection in North America
- 4.2.2 Surge in AI/ML Model Training Requiring Petabyte-Scale Data Processing in Asia
- 4.2.3 Growth of Edge-to-Cloud HPC for Smart Manufacturing in Europe
- 4.2.4 National Defense Big-Data Modernization Programs Across Middle East Governments
- 4.2.5 Renewable-Energy Grid Optimization Initiatives Driving HPC Analytics in South America
- 4.2.6 Falling Cost-per-Core for GPU/CPU Clusters Enabling Affordable HPC for SMEs Globally
- 4.3 Market Restraints
- 4.3.1 High Total Cost of Ownership for Dedicated HPC Clusters in Caribbeans and Africa
- 4.3.2 Shortage of Skilled HPC and Parallel Programming Professionals in Europe and Oceania
- 4.3.3 Data-Sovereignty Regulations Limiting Cross-Border Cloud Analytics in Asia
- 4.3.4 Infrastructure Reliability Issues in Emerging Markets Hampering Continuous Data Streams
- 4.4 Regulatory Outlook
- 4.5 Technological Outlook
- 4.5.1 High-Performance Cluster Computing Evolution
- 4.5.2 Grid Computing
- 4.5.3 In-Memory Analytics
- 4.5.4 In-Database Analytics
- 4.6 Porter's Five Forces Analysis
- 4.6.1 Bargaining Power of Suppliers
- 4.6.2 Bargaining Power of Buyers
- 4.6.3 Threat of New Entrants
- 4.6.4 Threat of Substitutes
- 4.6.5 Intensity of Competitive Rivalry
- 4.7 Investment Analysis
5 Market Size and Growth Forecasts
- 5.1 By Component
- 5.1.1 Hardware
- 5.1.2 Software
- 5.1.3 Services
- 5.2 By Deployment Model
- 5.2.1 On-Premise
- 5.2.2 On-Demand/Cloud
- 5.3 By Organization Size
- 5.3.1 Small and Medium Enterprises (SMEs)
- 5.3.2 Large Enterprises
- 5.4 By End-User Industry
- 5.4.1 Banking, Financial Services and Insurance (BFSI)
- 5.4.2 Government and Defense
- 5.4.3 Energy and Utilities
- 5.4.4 Retail and E-Commerce
- 5.4.5 Healthcare and Life Sciences
- 5.4.6 Telecommunication and IT Services
- 5.4.7 Manufacturing
- 5.5 By Geography
- 5.5.1 North America
- 5.5.1.1 United States
- 5.5.1.2 Canada
- 5.5.1.3 Mexico
- 5.5.2 South America
- 5.5.2.1 Brazil
- 5.5.2.2 Argentina
- 5.5.2.3 Chile
- 5.5.2.4 Peru
- 5.5.2.5 Rest of South America
- 5.5.3 Europe
- 5.5.3.1 Germany
- 5.5.3.2 United Kingdom
- 5.5.3.3 France
- 5.5.3.4 Italy
- 5.5.3.5 Spain
- 5.5.3.6 Rest of Europe
- 5.5.4 Asia-Pacific
- 5.5.4.1 China
- 5.5.4.2 Japan
- 5.5.4.3 South Korea
- 5.5.4.4 India
- 5.5.4.5 Australia
- 5.5.4.6 New Zealand
- 5.5.4.7 Rest of Asia-Pacific
- 5.5.5 Middle East
- 5.5.5.1 United Arab Emirates
- 5.5.5.2 Saudi Arabia
- 5.5.5.3 Turkey
- 5.5.5.4 Rest of Middle East
- 5.5.6 Africa
- 5.5.6.1 South Africa
- 5.5.6.2 Rest of Africa
- 5.5.1 North America
6 Competitive Landscape
- 6.1 Strategic Developments
- 6.2 Vendor Positioning Analysis
- 6.3 Company Profiles (includes Global level Overview, Market level overview, Core Segments, Financials as available, Strategic Information, Products and Services, and Recent Developments)
- 6.3.1 Amazon Web Services, Inc. (AWS)
- 6.3.2 Google LLC
- 6.3.3 Microsoft Corporation
- 6.3.4 IBM Corporation
- 6.3.5 Hewlett Packard Enterprise (HPE)
- 6.3.6 Dell Technologies Inc.
- 6.3.7 SAS Institute Inc.
- 6.3.8 Oracle Corporation
- 6.3.9 Fujitsu Limited
- 6.3.10 Intel Corporation
- 6.3.11 ATOS SE
- 6.3.12 Juniper Networks Inc.
- 6.3.13 NEC Corporation
- 6.3.14 Cisco Systems, Inc.
- 6.3.15 Teradata Corporation
- 6.3.16 Cray Inc. (HPE Cray)
- 6.3.17 Altair Engineering Inc.
- 6.3.18 Cloudera, Inc.
- 6.3.19 Huawei Technologies Co., Ltd.
- 6.3.20 Hitachi Vantara LLC
- 6.3.21 Super Micro Computer, Inc.
7 Market Opportunities and Future Outlook
- 7.1 White-space and Unmet-Need Assessment


