


 |
市場調查報告書
商品編碼
2035080
人形機器人:市場佔有率分析、產業趨勢與統計、成長預測(2026-2031)Humanoids - Market Share Analysis, Industry Trends & Statistics, Growth Forecasts (2026 - 2031) |
||||||
※ 本網頁內容可能與最新版本有所差異。詳細情況請與我們聯繫。
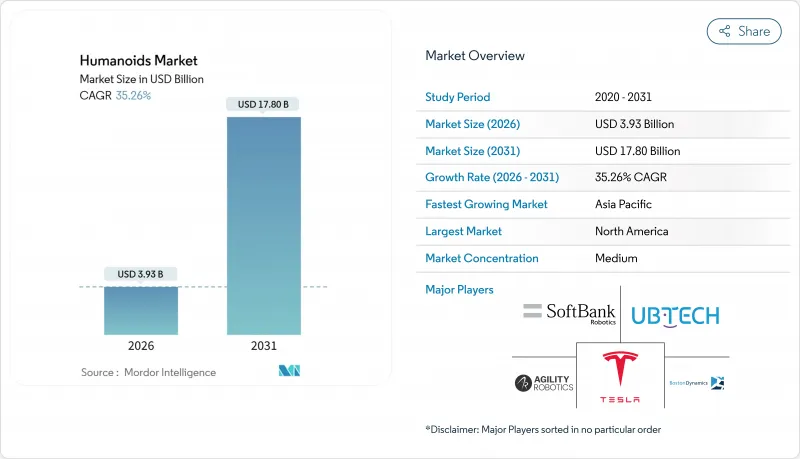
預計到 2026 年,人形機器人市場價值將達到 39.3 億美元,到 2031 年將達到 178 億美元,在預測期(2026-2031 年)內,複合年成長率將達到 35.26%。
人工智慧(AI)硬體成本的快速下降,加上七國集團(G7)國家和中國人口老化以及工業領域勞動力短缺日益加劇,正推動人形機器人從先導計畫發展成為醫療保健、製造業和物流等行業的核心營運資產。 2024年至2025年間,超過40億美元的創投流入,以及中國和韓國的「人形機器人2025」政策,正在加速新平台的上市進程。企業優先考慮能夠利用現有工具和基礎設施的外形規格,而軟體的進步正在將曾經靜態的機器轉變為能夠靈活適應工作的伙伴。這些因素相互促進,使得人形機器人市場成為各國在不增加人力的情況下提高生產力的關鍵解決方案。
全球人形機器人市場趨勢與洞察
人口老化導致護理服務缺口,加速了需求成長。
在日本,預計到2024年,65歲及以上人口的比例將達到29.1%,到2030年,醫療保健人員缺口可能超過240萬人。醫院正在引入人形機器人,用於持續監測病人、給藥和社交互動,在保證服務品質的前提下,降低30%至40%的營運成本。本田公司的「Hul」機器人目前正在西班牙一家老年病房協助護理人員工作,展現了效用。面臨類似勞動力短缺的零售和餐飲企業也正在引入接待和服務機器人,以在員工人數減少的情況下維持良好的客戶體驗。在韓國,每1萬名員工就運作1,102台機器人,是世界上機器人密度最高的國家。
人工智慧的成本曲線低於每單位 25,000 美元。
規模經濟、標準化致動器和低成本GPU正推動製造成本從2025年的35,000美元降至2030年的13,000至17,000美元。特斯拉計劃生產10,000輛Optimus汽車,每輛售價在20,000至30,000美元之間,這體現了一種類似於汽車製造的大規模生產模式。 Aptronic與GoogleDeepMind的合作將大規模語言模型的推理能力與Apollo的運算能力相結合,使邊緣處理器能夠運行以前需要價值100,000美元的伺服器才能完成的進程。由於採用電動車產業,電池組價格已比2010年下降了85%,這將進一步降低整體擁有成本。
與協作機器人相比,它的資本支出(Cap-ex)較高,總擁有成本(TCO)超過每小時 0.50 美元。
目前,人形機器人的運作成本為每小時 0.75 美元至 1.25 美元,而六軸協作機器人的運作成本為每小時 0.35 美元至 0.50 美元。精密齒輪箱、超過 25 個自由度以及先進的感測器陣列都會推高部署和維護成本。然而,對於需要人類觸及和導航的任務,採用協作機器人會抵消每小時的成本效益優勢,因為它無需對現有設施進行大規模改造。在已開發國家,工廠平均薪資超過 45,000 美元,人形機器人的年運作成本為 25,000 美元至 35,000 美元,其競爭力日益增強。
細分市場分析
2025年,輪式機器人佔總銷售量的62.40%,凸顯了目前在地面平坦的工廠和履約中心,節能高效、維護成本低的移動方式更受青睞。這項優勢使得輪式機器人在當年佔據了人形機器人市場最大的佔有率。然而,雙足機器人市場正以57.1%的複合年成長率快速成長,顯示隨著成本的降低,人形機器人市場將朝著人與環境完全融合的方向發展。
改進的模型預測控制、自適應踝關節和全身協調演算法使得機器人能夠以超過 1.5 公尺/秒的穩定行走速度運行,同時降低 30% 的能耗。在災害應變領域,由於瓦礫和崎嶇地形的限制,輪式機器人難以發揮作用,因此混合式和多足機器人仍然是小眾解決方案。隨著人工智慧運動規劃器的日益成熟,買家預計將在多個地點重複部署相同的雙足機器人,這有望提高機器人的使用壽命價值,並加強軟體更新與運行結果之間的聯繫。
預計到2025年,硬體將佔人形機器人市場規模的67.20%,反映出執行器、複合材料框架和高解析度感測器堆疊方面的大量資本投資。然而,軟體收入預計將以55.9%的複合年成長率成長,超過任何機械升級週期。
雲端增強視覺、自然語言處理模型和強化學習技術堆疊使得同一底盤能夠在早上處理設備組裝任務,並在非工作時間提供客戶服務。由於經過性授權費用超過了硬體的一次性利潤,供應商正轉向服務等級協定 (SLA),以確保運作、安全修補程式和功能交付。這一趨勢與智慧型手機生態系統類似,即使在實體產品類型中,程式碼也成為主要的差異化因素,從而提高了買家對網路安全和資料所有權條款的關注度。
區域分析
北美地區在創業融資和早期監管沙盒(可降低部署風險)的推動下,預計2025年將佔全球銷售額的37.40%。特斯拉、波士頓動力和Agility Robotics等美國原始設備製造商(OEM)在2024年至2025年間總合獲得12億美元的資金,用於開發商業工具和進行試點部署。加拿大各大學正專注於軟性致動器的研究,而墨西哥則供應精密齒輪箱,將北美自由貿易協定(北美自由貿易組織(NAFTA)的供應鏈整合融入人形機器人經濟中。
亞太地區是成長最快的市場,預計到2031年將以53.2%的複合年成長率成長。中國斥資100億美元的「國家人形機器人計畫」整合了省級津貼、軍事部署和採購配額,同時六家當地企業的目標是到2025年各自實現1,000台以上的產量。在韓國,一項3.5兆韓元的經濟獎勵策略透過政策性銀行向私人研究機構提供資金,促進研發並改善國內採購規則。日本的汽車工業傳統使其能夠生產高精度支柱和關節模組,而印度則提供用於雲控制的低成本中間件。這些因素共同推動了亞洲新興經濟體人形機器人市場的發展,擴大了生產規模並降低了單位成本。
在歐洲,政策主導的穩定成長正在顯現。在德國的「工業4.0」工廠中,人形機器人被引入,旨在將高混合、小批量組裝流程留在國內,而不是外包到海外。歐盟提出的《人工智慧責任指令》強制要求嚴格的故障安全設計,這將增加認證成本,但會降低長期的聲譽風險。法國和英國正致力於先進觸覺感測器的研發,而北歐國家則透過老年護理試點計畫來檢驗機器人在長期照護環境中的有效性。認證時間表迫使一些買家推遲部署,但德國和義大利的老牌汽車零件供應商正在競相生產子組件,加劇了跨大西洋的競爭。
其他好處:
- Excel格式的市場預測(ME)表
- 3個月的分析師支持
目錄
第1章:引言
- 研究假設和市場定義
- 調查範圍
第2章:調查方法
第3章執行摘要
第4章 市場狀況
- 市場概覽
- 市場促進因素
- 人口老化導致護理服務需求缺口擴大,加速了需求成長。
- 人工智慧的成本曲線低於每單位 25,000 美元。
- 七國集團和中國工廠勞動力短缺
- 各國(中國、韓國)的「人形機器人2025」計劃
- 老年護理機器人的IEC/ISO安全標準
- 對電動汽車馬達和電池供應鏈的連鎖反應
- 市場限制因素
- 與協作機器人相比,資本支出(Capex)更高,總擁有成本(TCO)超過每小時 0.50 美元。
- 安全和責任法規方面的不確定性
- 稀土元素磁鐵供應瓶頸
- 社會接受度和工會反對
- 價值/供應鏈分析
- 監理情勢
- 技術展望
- 波特五力分析
- 供應商的議價能力
- 買方的議價能力
- 新進入者的威脅
- 替代品的威脅
- 競爭公司之間的競爭
第5章 市場規模與成長預測
- 按操作類型
- 驅動系統
- 雙足行走
- 混合/多腿
- 按組件
- 硬體
- 軟體
- 服務
- 按最終用戶行業分類
- 醫療設施
- 零售和購物中心
- 製造/倉儲業
- 飯店業(飯店、主題樂園)
- 學術研究機構
- 按外形規格
- 全尺寸(140公分或以上)
- 中等尺寸(100-140公分)
- 小型(小於100公分)
- 僅上半身
- 按地區
- 北美洲
- 美國
- 加拿大
- 墨西哥
- 歐洲
- 英國
- 德國
- 法國
- 義大利
- 其他歐洲地區
- 亞太地區
- 中國
- 日本
- 印度
- 韓國
- 亞太其他地區
- 中東
- 以色列
- 沙烏地阿拉伯
- 阿拉伯聯合大公國
- 土耳其
- 其他中東國家
- 非洲
- 南非
- 埃及
- 其他非洲地區
- 南美洲
- 巴西
- 阿根廷
- 南美洲其他地區
- 北美洲
第6章 競爭情勢
- 市場集中度
- 策略趨勢
- 市佔率分析
- 公司簡介
- Honda Motor Co., Ltd.
- Toyota Motor Corporation
- SoftBank Robotics Group Corp.
- UBTECH Robotics Inc.
- PAL Robotics SL
- Hanson Robotics Ltd.
- Kawada Robotics Corporation
- Promobot LLC
- Invento Robotics Pvt. Ltd.
- ROBOTIS Co., Ltd.
- Boston Dynamics Inc.
- Tesla, Inc.(Optimus)
- Agility Robotics LLC
- Figure AI, Inc.
- Engineered Arts Ltd.
- Unitree Robotics Co., Ltd.
- Fourier Intelligence Co., Ltd.
- Xiaomi Corp.-Robotics Lab
- Samsung Electronics Co., Ltd.
- Apptronik Inc.
第7章 市場機會與未來展望
The Humanoids Market size is estimated at USD 3.93 billion in 2026, and is expected to reach USD 17.80 billion by 2031, at a CAGR of 35.26% during the forecast period (2026-2031).
Rapid cost declines in artificial intelligence hardware, demographic ageing in the G7 and China, and widening industrial labour gaps are converging to push humanoid robots from pilot projects to core operational assets across healthcare, manufacturing, and logistics. Venture investment flows exceeding USD 4 billion in 2024-2025, together with China's and South Korea's "Humanoid 2025" policies, are accelerating time-to-market for new platforms. Enterprises are prioritising human-scale form factors capable of using existing tools and infrastructure, while software advances turn once-static machines into adaptable co-workers. As these factors reinforce each other, the humanoids market is becoming a pivotal solution for countries seeking productivity gains without expanding their human workforce.
Global Humanoids Market Trends and Insights
Aging-Population Care Gap Intensifies Demand
Japan's population aged 65 years and older reached 29.1% in 2024, and healthcare worker deficits may exceed 2.4 million by 2030. Hospitals are turning to humanoids for continuous patient monitoring, medication rounds, and social interaction, trimming operating costs by 30-40% while keeping quality consistent. Honda's Haru units now assist nurses in Spanish geriatric wards, demonstrating cross-border relevance. Retail and hospitality operators facing similar labour gaps are introducing reception and service robots to protect customer experience despite shrinking staff levels. South Korea already operates 1,102 robots per 10,000 employees, the highest robot density worldwide.
AI Cost Curve Falling Below USD 25 k Per Unit
Economies of scale, standardised actuators, and low-cost GPUs are pushing manufactured costs down from USD 35,000 in 2025 to a targeted USD 13,000-17,000 by 2030. Tesla expects to build 10,000 Optimus units priced at USD 20,000-30,000 each, reflecting automotive-style throughput. Apptronik's partnership with Google DeepMind ties large-language-model reasoning to Apollo's manipulation skills, compressing what once required USD 100,000 servers onto edge processors. Battery pack prices, already 85% lower than 2010 levels thanks to the electric-vehicle industry, further erode total cost of ownership.
High Cap-ex & TCO Above USD 0.50/hr Compared with Cobots
Operating a humanoid costs USD 0.75-1.25 per hour today, versus USD 0.35-0.50 for six-axis cobots. Precision gearboxes, 25-plus degrees of freedom, and richer sensor arrays inflate both acquisition and maintenance outlays. Nevertheless, in tasks demanding human reach and navigation, cobots require costly re-engineering of facilities, offsetting their per-hour advantage. In developed economies where average factory wages top USD 45,000, a humanoid's USD 25,000-35,000 annual running cost is increasingly competitive.
Other drivers and restraints analyzed in the detailed report include:
- Factory Labour Shortages in G7 & China
- National "Humanoid 2025" Programmes (China, South Korea)
- Safety / Liability Regulation Uncertainty
For complete list of drivers and restraints, kindly check the Table Of Contents.
Segment Analysis
The wheel-drive class held 62.40% of 2025 revenues, underscoring current user preference for energy-efficient, low-maintenance mobility in flat-floored plants and fulfilment centres. This dominance meant the wheel cohort accounted for the largest slice of the humanoids market share that year. However, the biped category is expanding at a 57.1% CAGR, signalling that the humanoids market will pivot toward full human-environment compatibility as costs fall.
Improved model-predictive controllers, compliant ankle joints, and whole-body coordination algorithms are delivering steady-state walking above 1.5 m/s while cutting energy draw by 30%. Hybrid and multi-leg robots remain niche solutions for disaster response where debris or uneven terrain precludes wheels. As AI motion planners mature, buyers anticipate re-deploying the same biped unit across multiple sites, raising lifetime value and tightening the link between software updates and operational output.
Hardware captured 67.20% of the humanoids market size in 2025, reflecting large capital bills for actuators, composite frames, and high-resolution sensor stacks. Yet software revenue is tracking a 55.9% CAGR, outpacing any mechanical upgrade cycle.
Cloud-enhanced vision, natural-language models, and reinforcement-learning stacks enable the same chassis to perform kitting in the morning and concierge duties after hours. As recurring licence fees overtake one-off hardware margins, vendors are shifting to service-level agreements that guarantee uptime, security patches, and feature drops. This echo of the smartphone ecosystem positions code as the foremost differentiator even inside a physical-goods category, and heightens buyer focus on cybersecurity and data-ownership clauses.
The Humanoids Market Report is Segmented by Motion Type (Wheel-Drive, Biped, Hybrid/Multi-leg), Component (Hardware, Software, Services), End-User Industry (Healthcare Facilities, Retail & Shopping Centres, Manufacturing & Warehousing, and More), Form Factor (Full-Size Greater Than 140cm, Mid-Size 100-140cm, Small Less Than 100cm, and More), and Geography. The Market Forecasts are Provided in Terms of Value (USD).
Geography Analysis
North America retained 37.40% of global 2025 revenue, catalysed by USD 2 billion in venture rounds and early regulatory sandboxes that cut deployment risk. United States OEMs such as Tesla, Boston Dynamics, and Agility Robotics collectively secured USD 1.2 billion during 2024-2025, bankrolling commercial tooling and pilot roll-outs. Canada's universities specialise in compliant-actuator research, and Mexico supplies precision gear casings, threading NAFTA supply-chain integration into humanoid economics.
Asia-Pacific is the fastest-growing theatre, advancing at a 53.2% CAGR to 2031. China's USD 10 billion National Humanoid programme aligns provincial grants, military adoption, and purchasing quotas, while six local firms target >= 1,000 units each for 2025 volume. South Korea's KRW 3.5 trillion stimulus channels funds through its policy bank to private labs, fostering R&D and domestic content rules. Japan's automotive heritage yields high-precision strut and joint modules, and India supplies cloud-control middleware at lower cost. Collectively, these forces scale output and compress unit costs, bolstering the humanoids market across emerging Asian economies.
Europe posts steady, policy-led growth. Germany's Industrie 4.0 facilities adopt humanoids to keep high-mix assembly at home rather than offshoring. The EU's draft AI liability directive compels rigorous fail-safe designs, adding qualification overhead but reducing long-run reputational risk. France and the United Kingdom emphasise advanced haptic-sensor R&D, while Nordic eldercare pilots validate robots in long-term-care settings. Although certification timelines push some buyers to slower roll-outs, established automotive suppliers in Germany and Italy are lining up to build sub-assemblies, reinforcing trans-Atlantic competition.
- Honda Motor Co., Ltd.
- Toyota Motor Corporation
- SoftBank Robotics Group Corp.
- UBTECH Robotics Inc.
- PAL Robotics SL
- Hanson Robotics Ltd.
- Kawada Robotics Corporation
- Promobot LLC
- Invento Robotics Pvt. Ltd.
- ROBOTIS Co., Ltd.
- Boston Dynamics Inc.
- Tesla, Inc. (Optimus)
- Agility Robotics LLC
- Figure AI, Inc.
- Engineered Arts Ltd.
- Unitree Robotics Co., Ltd.
- Fourier Intelligence Co., Ltd.
- Xiaomi Corp. - Robotics Lab
- Samsung Electronics Co., Ltd.
- Apptronik Inc.
Additional Benefits:
- The market estimate (ME) sheet in Excel format
- 3 months of analyst support
TABLE OF CONTENTS
1 INTRODUCTION
- 1.1 Study Assumptions and Market Definition
- 1.2 Scope of the Study
2 RESEARCH METHODOLOGY
3 EXECUTIVE SUMMARY
4 MARKET LANDSCAPE
- 4.1 Market Overview
- 4.2 Market Drivers
- 4.2.1 Aging-population care gap intensifies demand
- 4.2.2 AI cost curve falling below USD 25k per unit
- 4.2.3 Factory labor shortages in G7 and China
- 4.2.4 National "Humanoid 2025" programs (China, S-Korea)
- 4.2.5 IEC/ISO elderly-care robot safety standards
- 4.2.6 EV motor and battery supply-chain spill-overs
- 4.3 Market Restraints
- 4.3.1 High cap-ex and TCO above USD 0.50 /hr compared with cobots
- 4.3.2 Safety / liability regulation uncertainty
- 4.3.3 Rare-earth magnet supply bottlenecks
- 4.3.4 Societal acceptance and labour-union pushback
- 4.4 Value / Supply-Chain Analysis
- 4.5 Regulatory Landscape
- 4.6 Technological Outlook
- 4.7 Porter's Five Forces Analysis
- 4.7.1 Bargaining Power of Suppliers
- 4.7.2 Bargaining Power of Buyers
- 4.7.3 Threat of New Entrants
- 4.7.4 Threat of Substitutes
- 4.7.5 Intensity of Competitive Rivalry
5 MARKET SIZE AND GROWTH FORECASTS (VALUE)
- 5.1 By Motion Type
- 5.1.1 Wheel-drive
- 5.1.2 Biped
- 5.1.3 Hybrid / Multi-leg
- 5.2 By Component
- 5.2.1 Hardware
- 5.2.2 Software
- 5.2.3 Services
- 5.3 By End-user Industry
- 5.3.1 Healthcare Facilities
- 5.3.2 Retail and Shopping Centres
- 5.3.3 Manufacturing and Warehousing
- 5.3.4 Hospitality (Hotels, Theme Parks)
- 5.3.5 Academic and Research Institutes
- 5.4 By Form Factor
- 5.4.1 Full-size (Greater than 140 cm)
- 5.4.2 Mid-size (100-140 cm)
- 5.4.3 Small (Less than 100 cm)
- 5.4.4 Upper-torso only
- 5.5 By Geography
- 5.5.1 North America
- 5.5.1.1 United States
- 5.5.1.2 Canada
- 5.5.1.3 Mexico
- 5.5.2 Europe
- 5.5.2.1 United Kingdom
- 5.5.2.2 Germany
- 5.5.2.3 France
- 5.5.2.4 Italy
- 5.5.2.5 Rest of Europe
- 5.5.3 Asia-Pacific
- 5.5.3.1 China
- 5.5.3.2 Japan
- 5.5.3.3 India
- 5.5.3.4 South Korea
- 5.5.3.5 Rest of Asia-Pacific
- 5.5.4 Middle East
- 5.5.4.1 Israel
- 5.5.4.2 Saudi Arabia
- 5.5.4.3 United Arab Emirates
- 5.5.4.4 Turkey
- 5.5.4.5 Rest of Middle East
- 5.5.5 Africa
- 5.5.5.1 South Africa
- 5.5.5.2 Egypt
- 5.5.5.3 Rest of Africa
- 5.5.6 South America
- 5.5.6.1 Brazil
- 5.5.6.2 Argentina
- 5.5.6.3 Rest of South America
- 5.5.1 North America
6 COMPETITIVE LANDSCAPE
- 6.1 Market Concentration
- 6.2 Strategic Moves
- 6.3 Market Share Analysis
- 6.4 Company Profiles (includes Global level Overview, Market level overview, Core Segments, Financials as available, Strategic Information, Market Rank/Share, Products and Services, Recent Developments)
- 6.4.1 Honda Motor Co., Ltd.
- 6.4.2 Toyota Motor Corporation
- 6.4.3 SoftBank Robotics Group Corp.
- 6.4.4 UBTECH Robotics Inc.
- 6.4.5 PAL Robotics SL
- 6.4.6 Hanson Robotics Ltd.
- 6.4.7 Kawada Robotics Corporation
- 6.4.8 Promobot LLC
- 6.4.9 Invento Robotics Pvt. Ltd.
- 6.4.10 ROBOTIS Co., Ltd.
- 6.4.11 Boston Dynamics Inc.
- 6.4.12 Tesla, Inc. (Optimus)
- 6.4.13 Agility Robotics LLC
- 6.4.14 Figure AI, Inc.
- 6.4.15 Engineered Arts Ltd.
- 6.4.16 Unitree Robotics Co., Ltd.
- 6.4.17 Fourier Intelligence Co., Ltd.
- 6.4.18 Xiaomi Corp. - Robotics Lab
- 6.4.19 Samsung Electronics Co., Ltd.
- 6.4.20 Apptronik Inc.
7 MARKET OPPORTUNITIES and FUTURE OUTLOOK
- 7.1 White-space and Unmet-need Assessment
