


 |
市場調查報告書
商品編碼
1851604
工業電池:市場佔有率分析、行業趨勢、統計數據和成長預測(2025-2030 年)Industrial Battery - Market Share Analysis, Industry Trends & Statistics, Growth Forecasts (2025 - 2030) |
||||||
※ 本網頁內容可能與最新版本有所差異。詳細情況請與我們聯繫。
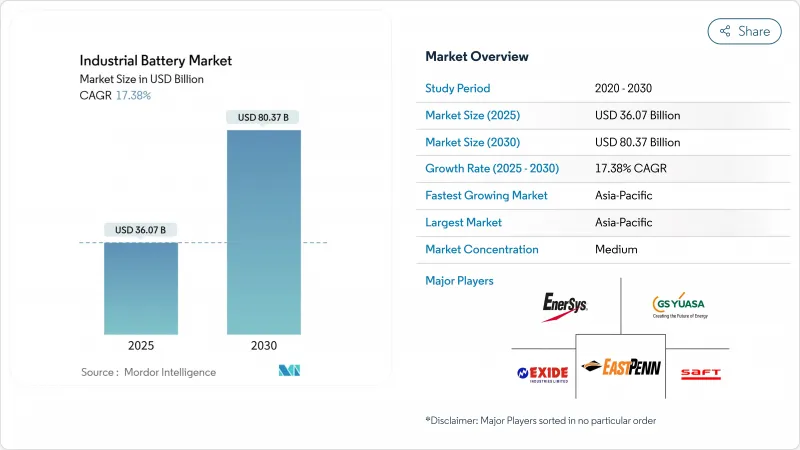
預計到 2025 年,工業電池市場規模將達到 360.7 億美元,到 2030 年將達到 803.7 億美元,在預測期(2025-2030 年)內,複合年成長率將達到 17.38%。
鋰離子電池價格下跌、電網級儲能計劃擴展以及倉儲自動化趨勢的推動,使得電池成為能源轉型議程中不可或缺的基礎設施。美國和歐洲政策支持的加強正在刺激新的產能成長,而亞太地區則利用一體化供應鏈保持成本領先地位。產業整合正在加速,主要電池製造商正向上游原料和下游系統整合領域轉移,以保護淨利率、抵消礦產價格波動並遵守日益嚴格的安全標準。同時,二手電池租賃模式、微電網部署以及鈉離子電池的興起,正在拓展電池的應用範圍,並支撐工業電池市場的長期需求。
全球工業電池市場趨勢與洞察
鋰離子電池成本曲線呈下降趨勢
2010年至2024年間,鋰離子電池組的平均價格下降了89%,至139美元/度。預計全球標示容量將從2020年的95吉瓦時成長到2024年的1200吉瓦時以上,這將推動規模經濟效益的實現,並提高中國工廠使用率。 LG能源解決方案公司位於亞利桑那州的工廠計畫從2025年開始,年產量增加43吉瓦時,生產成本比北美平均低25%。價格下降將擴大裝機量,使資本投資轉向營運支出,並推動電池即服務模式的發展,從而降低客戶的部署風險。這種價格下降和產量成長的良性循環有望鞏固鋰離子電池在工業電池市場的領先地位,同時為本世紀末鈉離子電池和固態電池的大規模應用鋪平道路。
利用可再生能源建設儲能系統
隨著可再生能源滲透率超過30%,到2024年,全球電網級電池儲能裝置容量將達到15吉瓦,因為公用事業公司正在整合電池儲能以穩定電網。光是加州就正在快速開發價值4.6吉瓦時的計劃,而昆士蘭州正在調試多個300-500兆瓦時的儲能系統,以支持其50%的可再生能源目標。除了公用事業公司之外,工業微電網還將屋頂光電發電與現場電池結合,以降低需求費用並確保電力連續性。成本下降、模組化架構和簡化的採購框架使電池成為頻率調節和容量供應成本最低的解決方案,為工業電池市場提供了結構性利好因素。
關鍵礦產價格波動
碳酸鋰價格在2020年至2022年間飆升1000%,隨後在2024年回落80%,擾亂了籌資策略和利潤規劃。由於剛果民主共和國和印尼的地緣政治緊張局勢和出口限制,鈷和鎳的價格也出現了類似的波動。由於礦物成本佔鋰離子電池系統成本的50%之多,價格波動會導致總擁有成本預測顯著波動。儘管製造商正透過簽訂多年承購協議、實現原料多元化和開展回收計劃來規避風險,但規模較小的公司卻面臨資產負債表的壓力。鈉離子電池和鐵基電池的發展趨勢正在形成相互抵消的趨勢,使這些技術能夠緩衝價格衝擊,並緩解工業電池市場的波動。
細分市場分析
到2024年,鋰離子電池將佔據工業電池市場51%的佔有率,這主要得益於其十年來成本下降89%以及卓越的往返效率。預計到2030年,該產業將以18%的複合年成長率成長,因為磷酸鐵鋰電池在6000次循環後容量保持率可達95%,使其生命週期擁有成本低於每千瓦時0.08美元。鈉離子電池將隨著寧德時代(CATL)2024年的推出而實現商業化規模,材料成本降低30%,使其在固定式儲能領域更具競爭力。液流電池正在需要放電時間超過8小時的應用領域站穩腳跟。中國一座100兆瓦/400兆瓦時的釩液流電池電廠已展現出20年的使用壽命。鎳鎘電池和鎳氫電池則服務於嚴苛環境,尤其是在偏遠油田,這些地區必須在-40°C至70°C的溫度範圍內運作。從 2027 年開始試生產能量密度提高 50% 的固態原型電池,全球汽車製造商將合作支援生產線的認證。
預計鋰離子工業電池市場規模將從2025年的184億美元成長到2030年的476億美元。持續的規模擴張將降低每吉瓦時的資本密集度,促進垂直整合,並拉大與傳統電池的性能差距。同時,高錳正極、矽負極和高壓電解液的創新將進一步降低單位成本,提升鋰離子電池的價值提案。供應商正在投資建造毗鄰超級工廠的回收中心,以回收鈷、鎳和鋰,從而滿足歐盟新監管規則對循環經濟的要求。這些因素的綜合作用將鞏固鋰離子電池的領先地位,同時明確其他互補電池技術的角色,確保工業電池市場的技術多樣性。
工業電池市場報告按技術(鋰離子、鉛酸、鎳基、其他)、應用(堆高機和動力、電訊備用、UPS/資料中心、電網級儲能系統、其他)、終端用戶行業(電力和公用事業、石油和天然氣、製造和倉儲、電訊、其他)以及地區(北美、歐洲、亞太、南美、中東和非洲)進行細分。
區域分析
預計到2024年,亞太地區將維持50%的收入佔有率,這主要得益於成本效益高的超級工廠、政府獎勵以及垂直整合的供應鏈。中國佔該地區產能的三分之二,單家工廠的年產能就超過40吉瓦時。日本卓越的材料科學和韓國的高階電芯技術共同建構了一個強大的生態系統,使得該地區的電池價格比西方基準價格低15-20%。受國內可再生能源目標、出口導向製造業以及與固定式儲能共用通用供應鏈的電動車基礎設施快速發展的推動,亞太地區工業電池市場規模預計將以19.45%的複合年成長率成長。
北美是2030年成長最快的已開發地區之一,這主要得益於《通膨降低法案》的激勵措施、以國防為導向的供應鏈重組以及豐富的可再生資源。 2022年至2025年間,已宣布的投資額將超過1,000億美元,其中以LG能源解決方案公司在亞利桑那州投資55億美元的工廠和特斯拉在德克薩斯投資2億美元的工廠最為突出。聯邦貸款擔保和生產稅額扣抵降低了資金門檻,而加快的州級核准流程則縮短了計劃週期。
歐洲正透過綠色新政」產業計畫和歐洲電池聯盟追求戰略自主,但高昂的能源成本和複雜的授權阻礙了建設進程。德國、瑞典和匈牙利已承接了大部分計劃,而挪威和芬蘭則利用低碳電力吸引陽極和陰極加工。中東和非洲是新興但充滿潛力的市場,離網太陽能光電發電和電池儲能正在取代柴油發電機。南非的再生能源獨立電力生產商採購計劃(REIPPP)和阿拉伯聯合大公國的智慧城市計劃正在推動早期應用。拉丁美洲的鋰三角正在刺激下游投資,並將該地區打造為工業電池市場的資源中心和未來製造地。
其他福利:
- Excel格式的市場預測(ME)表
- 3個月的分析師支持
目錄
第1章 引言
- 研究假設和市場定義
- 調查範圍
第2章調查方法
第3章執行摘要
第4章 市場情勢
- 市場概覽
- 市場促進因素
- 鋰離子電池成本曲線呈下降趨勢
- 利用可再生能源建設儲能系統
- 倉庫自動化與AGV的快速崛起
- 資料中心直流微電網
- 維護通訊塔的義務
- 原始設備製造商主導的二手車租賃模式
- 市場限制
- 關鍵礦產價格波動
- 鉛酸蓄電池污染法規
- 固體技術的「觀望」效應
- BESS火災風險保險成本上升
- 電池/原物料價格趨勢及預測
- 進出口分析
- 供應鏈分析
- 監管環境
- 技術展望
- 波特五力模型
- 供應商的議價能力
- 買方的議價能力
- 新進入者的威脅
- 替代品的威脅
- 競爭對手之間的競爭
第5章 市場規模與成長預測
- 透過技術
- 鋰離子
- 鉛酸電池
- 鎳基
- 其他(包括液流電池和鈉離子電池)
- 透過使用
- 堆高機和動力
- 電信備份
- UPS/資料中心
- 網格尺度ESS
- 其他(包括自動導引運輸車、鐵路和海運)
- 按最終用戶行業分類
- 電力/公共產業
- 石油和天然氣
- 製造和倉儲業
- 電信
- 其他(包括運輸和物流)
- 按地區
- 北美洲
- 美國
- 加拿大
- 墨西哥
- 歐洲
- 德國
- 法國
- 英國
- 義大利
- 西班牙
- 北歐國家
- 俄羅斯
- 其他歐洲地區
- 亞太地區
- 中國
- 日本
- 印度
- 韓國
- 東南亞國協
- 亞太其他地區
- 南美洲
- 巴西
- 阿根廷
- 其他南美洲
- 中東和非洲
- 阿拉伯聯合大公國
- 沙烏地阿拉伯
- 南非
- 其他中東和非洲地區
- 北美洲
第6章 競爭情勢
- 市場集中度
- 策略性舉措(併購、夥伴關係、購電協議)
- 市場佔有率分析(主要企業的市場排名/佔有率)
- 公司簡介
- EnerSys
- East Penn Manufacturing
- Exide Industries
- GS Yuasa Corp.
- Saft Groupe SA
- Amara Raja Batteries
- Panasonic Energy
- CATL
- BYD Co. Ltd.
- LG Energy Solution
- Samsung SDI
- Johnson Controls
- Leoch Int'l
- JYC Battery
- Narada Power
- Crown Battery
- Hoppecke Batteries
- NorthStar Battery
- Trojan Battery
- Vision Group
第7章 市場機會與未來展望
The Industrial Battery Market size is estimated at USD 36.07 billion in 2025, and is expected to reach USD 80.37 billion by 2030, at a CAGR of 17.38% during the forecast period (2025-2030).
Falling lithium-ion prices, expanding grid-scale storage projects, and the march toward warehouse automation position batteries as indispensable infrastructure for energy-transition agendas. Heightened policy support in the United States and Europe spurs fresh manufacturing capacity, while Asia-Pacific leverages integrated supply chains to keep cost leadership. Consolidation is gathering speed as leading cell makers move upstream into raw materials and downstream into systems integration to secure margins, offset mineral price volatility, and comply with tightening safety standards. At the same time, second-life leasing models, micro-grid deployments, and the rise of sodium-ion alternatives are widening the addressable pool of applications and anchoring long-term demand for the industrial battery market.
Global Industrial Battery Market Trends and Insights
Declining Lithium-Ion Battery Cost Curve
Average lithium-ion pack prices fell 89% between 2010 and 2024 to USD 139 /kWh and are trending toward the USD 100 /kWh tipping point that unlocks mass industrial adoption. Global nameplate capacity rose from 95 GWh in 2020 to more than 1,200 GWh in 2024, driving scale economies and higher factory utilization in China. LG Energy Solution's Arizona complex will add 43 GWh of annual output from 2025, targeting production costs 25% below prevailing North American averages. Lower prices widen the installed base, enabling battery-as-a-service models that shift capex to opex and reduce customer adoption risk. The virtuous loop of falling prices and rising volumes is expected to solidify lithium-ion's leadership within the industrial battery market while paving the way for high-volume sodium-ion and solid-state introductions later in the decade.
Renewable-Powered ESS Build-Outs
Global grid-scale battery additions reached 15 GW in 2024, as utilities integrate storage to stabilize networks with renewable penetration above 30%. California alone fast-tracked 4.6 GWh worth of projects, while Queensland commissioned multiple 300-500 MWh systems to back its 50% renewables target. Beyond the utility domain, industrial micro-grids pair rooftop solar with on-site batteries to shave demand charges and guarantee power continuity. Cost declines, modular architectures, and streamlined procurement frameworks make batteries the least-cost solution for frequency control and capacity reserves, yielding a structural tailwind for the industrial battery market.
Critical-Mineral Price Volatility
Lithium carbonate prices spiked 1,000% from 2020-2022 before sliding 80% in 2024, disrupting procurement strategies and margin planning. Cobalt and nickel exhibit similar gyrations driven by geopolitical tensions and export restrictions in the Democratic Republic of Congo and Indonesia. Minerals account for up to 50% of lithium-ion system cost; volatility, therefore, translates into wide swings in projected total cost of ownership. Manufacturers hedge through multi-year offtake agreements, diversified feedstock, and recycling programs, but smaller players face balance-sheet pressure. Prospectors of sodium-ion and iron-based chemistries position their technologies as buffers against price shocks, creating a countervailing trend that tempers volatility risk for the industrial battery market.
Other drivers and restraints analyzed in the detailed report include:
- Warehouse Automation & AGVs Surge
- DC Micro-Grids in Data Centres
- Lead-Acid Pollution Regulations
For complete list of drivers and restraints, kindly check the Table Of Contents.
Segment Analysis
Lithium-ion captured 51% of the industrial battery market share in 2024, underpinned by an 89% decade-long cost plunge and superior round-trip efficiency. The segment is projected to expand at an 18% CAGR to 2030 as LFP formulations deliver 95% capacity retention after 6,000 cycles, pushing the lifetime cost of ownership below USD 0.08 per kWh delivered. Sodium-ion enters commercial scale via CATL's 2024 launch, offering 30% lower material costs and competitive performance for stationary storage. Flow batteries hold a foothold in applications requiring more than eight-hour discharge; a 100 MW/400 MWh vanadium redox plant in China illustrates bankable 20-year lifespans. Nickel-cadmium and nickel-metal hydride supply harsh-environment niches where -40 °C to 70 °C operation is essential, notably in remote oilfields. Solid-state prototypes promising 50% higher energy density line up for pilot production after 2027, with global automakers backing production qualification lines jointly.
The industrial battery market size for lithium-ion systems is forecast to climb from USD 18.4 billion in 2025 to USD 47.6 billion by 2030. Continuous scale-up dampens capital intensity per GWh, encourages vertical integration, and widens the performance gap with legacy chemistries. Simultaneously, innovation on high-manganese cathodes, silicon anodes, and high-voltage electrolytes intends to further trim unit costs and sharpen lithium-ion's value proposition. Suppliers invest in Gigafactory-adjacent recycling hubs to harvest cobalt, nickel, and lithium, underpinning circular-economy credentials required under new EU stewardship rules. The combined effect cements lithium-ion's leadership while allowing complementary chemistries to secure clearly defined roles, ensuring technology diversity within the industrial battery market.
The Industrial Battery Market Report is Segmented by Technology (Lithium-Ion, Lead-Acid, Nickel-Based, and Others), Application (Forklift and Motive Power, Telecom Backup, UPS/Data Centres, Grid-Scale ESS, and Others), End-User Industry (Power and Utilities, Oil and Gas, Manufacturing and Warehousing, Telecom, and Others), and Geography (North America, Europe, Asia-Pacific, South America, and Middle East and Africa).
Geography Analysis
Asia-Pacific retained a 50% revenue share in 2024, driven by cost-efficient giga-scale factories, government incentives, and vertically integrated supply chains. China accounts for two-thirds of regional capacity, with single plants exceeding 40 GWh annually. Japan's material science prowess and South Korea's premium cell expertise reveal a robust ecosystem that keeps regional prices 15-20% below Western benchmarks. Asia-Pacific's industrial battery market size is set to climb at a 19.45% CAGR, fueled by domestic renewables targets, export-oriented manufacturing, and accelerating electric-vehicle infrastructure that shares common supply chains with stationary storage.
North America is one of the fastest-growing developed regions, through 2030, due to the Inflation Reduction Act incentives, defense-oriented supply-chain reshoring, and abundant renewable resources. Between 2022-2025, announced investments exceed USD 100 billion, led by LG Energy Solution's USD 5.5 billion Arizona plant and Tesla's USD 200 million megafactory in Texas. Federal loan guarantees and production tax credits lower capital hurdles, while state-level fast-track permits compress project timelines.
Europe pursues strategic autonomy via the Green Deal Industrial Plan and European Battery Alliance, yet high energy costs and permitting complexity slow build-out. Germany, Sweden, and Hungary host most projects; Norway and Finland leverage low-carbon power to attract anode and cathode processing. The Middle East and Africa represent nascent but promising markets as off-grid solar plus storage displaces diesel generators; South Africa's REIPPP programme and the UAE's smart-city ambitions drive early adoption. Latin America's lithium triangle stimulates downstream investment discussions, positioning the region as a resource hub and a future manufacturing base for the industrial battery market.
- EnerSys
- East Penn Manufacturing
- Exide Industries
- GS Yuasa Corp.
- Saft Groupe SA
- Amara Raja Batteries
- Panasonic Energy
- CATL
- BYD Co. Ltd.
- LG Energy Solution
- Samsung SDI
- Johnson Controls
- Leoch Int'l
- JYC Battery
- Narada Power
- Crown Battery
- Hoppecke Batteries
- NorthStar Battery
- Trojan Battery
- Vision Group
Additional Benefits:
- The market estimate (ME) sheet in Excel format
- 3 months of analyst support
TABLE OF CONTENTS
1 Introduction
- 1.1 Study Assumptions & Market Definition
- 1.2 Scope of the Study
2 Research Methodology
3 Executive Summary
4 Market Landscape
- 4.1 Market Overview
- 4.2 Market Drivers
- 4.2.1 Declining lithium-ion battery cost curve
- 4.2.2 Renewable-powered ESS build-outs
- 4.2.3 Warehouse automation & AGVs surge
- 4.2.4 DC micro-grids in data centres
- 4.2.5 Telecom tower storage mandates
- 4.2.6 OEM-driven 2nd-life leasing models
- 4.3 Market Restraints
- 4.3.1 Critical-mineral price volatility
- 4.3.2 Lead-acid pollution regulations
- 4.3.3 Solid-state tech "wait-and-see" effect
- 4.3.4 Rising BESS fire-risk insurance costs
- 4.4 Battery/Raw-Material Price Trends & Forecast
- 4.5 Import and Export Analysis
- 4.6 Supply-Chain Analysis
- 4.7 Regulatory Landscape
- 4.8 Technological Outlook
- 4.9 Porter's Five Forces
- 4.9.1 Bargaining Power of Suppliers
- 4.9.2 Bargaining Power of Buyers
- 4.9.3 Threat of New Entrants
- 4.9.4 Threat of Substitutes
- 4.9.5 Competitive Rivalry
5 Market Size & Growth Forecasts
- 5.1 By Technology
- 5.1.1 Lithium-ion
- 5.1.2 Lead-acid
- 5.1.3 Nickel-based
- 5.1.4 Others (incl. Flow Battery, Sodium-ion)
- 5.2 By Application
- 5.2.1 Forklift and Motive Power
- 5.2.2 Telecom Backup
- 5.2.3 UPS/Data Centres
- 5.2.4 Grid-Scale ESS
- 5.2.5 Others (incl Automated Guided Vehicles, Rail and Marine)
- 5.3 By End-User Industry
- 5.3.1 Power and Utilities
- 5.3.2 Oil and Gas
- 5.3.3 Manufacturing and Warehousing
- 5.3.4 Telecom
- 5.3.5 Others (incl Transportation and Logistics)
- 5.4 By Geography
- 5.4.1 North America
- 5.4.1.1 United States
- 5.4.1.2 Canada
- 5.4.1.3 Mexico
- 5.4.2 Europe
- 5.4.2.1 Germany
- 5.4.2.2 France
- 5.4.2.3 United Kingdom
- 5.4.2.4 Italy
- 5.4.2.5 Spain
- 5.4.2.6 Nordic Countries
- 5.4.2.7 Russia
- 5.4.2.8 Rest of Europe
- 5.4.3 Asia-Pacific
- 5.4.3.1 China
- 5.4.3.2 Japan
- 5.4.3.3 India
- 5.4.3.4 South Korea
- 5.4.3.5 ASEAN Countries
- 5.4.3.6 Rest of Asia-Pacific
- 5.4.4 South America
- 5.4.4.1 Brazil
- 5.4.4.2 Argentina
- 5.4.4.3 Rest of South America
- 5.4.5 Middle East and Africa
- 5.4.5.1 United Arab Emirates
- 5.4.5.2 Saudi Arabia
- 5.4.5.3 South Africa
- 5.4.5.4 Rest of Middle East and Africa
- 5.4.1 North America
6 Competitive Landscape
- 6.1 Market Concentration
- 6.2 Strategic Moves (M&A, Partnerships, PPAs)
- 6.3 Market Share Analysis (Market Rank/Share for key companies)
- 6.4 Company Profiles (includes Global level Overview, Market level overview, Core Segments, Financials as available, Strategic Information, Products & Services, and Recent Developments)
- 6.4.1 EnerSys
- 6.4.2 East Penn Manufacturing
- 6.4.3 Exide Industries
- 6.4.4 GS Yuasa Corp.
- 6.4.5 Saft Groupe SA
- 6.4.6 Amara Raja Batteries
- 6.4.7 Panasonic Energy
- 6.4.8 CATL
- 6.4.9 BYD Co. Ltd.
- 6.4.10 LG Energy Solution
- 6.4.11 Samsung SDI
- 6.4.12 Johnson Controls
- 6.4.13 Leoch Int'l
- 6.4.14 JYC Battery
- 6.4.15 Narada Power
- 6.4.16 Crown Battery
- 6.4.17 Hoppecke Batteries
- 6.4.18 NorthStar Battery
- 6.4.19 Trojan Battery
- 6.4.20 Vision Group
7 Market Opportunities & Future Outlook
- 7.1 White-space & Unmet-Need Assessment
 工業電池市場報告:按驅動系統、技術、應用和地區分類(2026-2034 年)
 工業電池市場:2026-2032年全球市場預測(依電池化學成分、產品類型、容量範圍、安裝方式、應用領域、終端用戶產業及通路分類)
 工業電池市場規模、佔有率和成長分析(適用於物料輸送設備):按電池類型、應用、最終用戶、技術採用、銷售管道和地區分類-2026-2033年產業預測
 2026年全球工業機器人電池市場報告2026年全球工業電池市場報告
 工業電池市場 - 全球產業規模、佔有率、趨勢、機會、預測(按類型、應用、地區和競爭格局分類),2021-2031年
 工業電池市場規模、佔有率及成長分析(按類型、應用和地區分類)-2026-2033年產業預測
 施工機械電池:全球市佔率及排名、總收入及需求預測(2025-2031年)洗地機電池市場-全球產業規模、佔有率、趨勢、機會和預測,按電池類型、按機器類型、按最終用途行業、按地區和競爭情況細分,2020-2030 年
 北美工業電池:市場佔有率分析、行業趨勢和成長預測(2025-2030 年)