


 |
市場調查報告書
商品編碼
1851591
工業空氣壓縮機:市場佔有率分析、行業趨勢、統計數據和成長預測(2025-2030 年)Industrial Air Compressors - Market Share Analysis, Industry Trends & Statistics, Growth Forecasts (2025 - 2030) |
||||||
※ 本網頁內容可能與最新版本有所差異。詳細情況請與我們聯繫。
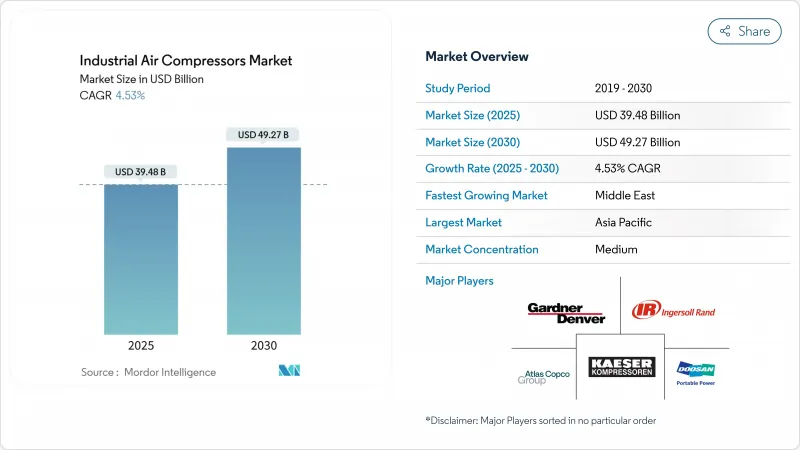
工業空氣壓縮機市場規模預計到 2025 年將達到 394.8 億美元,預計到 2030 年將達到 492.7 億美元,年複合成長率為 4.53%。
節能生產線的投資不斷增加、液化天然氣基礎設施的快速發展以及日益嚴格的污染標準,正在改變各主要終端用戶產業的消費偏好。隨著工廠營運商在排放要求和整體擁有成本目標之間尋求平衡,變速技術、無油架構和物聯網監控平台正日益受到青睞。亞太地區的成長勢頭依然強勁,中東地區則受惠於大型天然氣計劃的快速發展。同時,歐洲原料價格的波動和日益嚴格的排放法規正在擠壓淨利率並延長投資回收期,促使企業重新設計產品以減少鋼材用量並提升聲學性能。工業空氣壓縮機市場透過產品創新與脫碳政策和工業佈局的轉變,持續展現強大的韌性。
全球工業空氣壓縮機市場趨勢與洞察
在亞洲擴建節能型製造設施
2024年第四季度,台灣半導體產業的蓬勃發展推動固定資產支出成長了69%,電子工廠紛紛採用0級無油系統以防止污染。變頻驅動器可降低高達35%的能耗,如今已成為所有新生產線的基礎。跨國公司在中國和印度擴大機器人和積層製造規模,也反映了這一趨勢,從而支撐了工業空氣壓縮機市場的長期銷售成長。
食品飲料加工產業對無油壓縮機的需求不斷成長
ISO 8573-1 0級標準已從最佳實踐轉變為許多地區的監管要求,推動加工商採用無油螺桿和渦旋蝸桿。日立全球航空動力公司的DS280-450 kW產品滿足了對高功率無油解決方案的需求。減少維護和避免潤滑油浪費抵消了較高的領先成本,從而促進了其在已開發市場的普及。
鋼材價格波動推高壓縮機物料清單成本結構
鋼材成本佔壓縮機製造成本的50%之多,因此價格上漲會使原始設備製造商(OEM)的利潤率面臨波動風險。由於能源成本影響鋼材投入,歐洲製造商已在2024年多次調高產品標價。降低鋼板厚度和改用複合材料的設計措施備受讚譽,但高昂的認證門檻阻礙了這些措施的推廣應用。
細分市場分析
到2024年,容積式壓縮機技術將佔據工業空氣壓縮機市場的76%佔有率,這反映了其在從一般製造業到採礦業等各行業的廣泛應用。旋轉式螺桿式壓縮機在效率和維護需求之間取得了良好的平衡,因此市場需求穩定。動態離心式壓縮機雖然目前銷售仍較低,但由於液化天然氣工廠和鋼鐵廠需要高流量和穩定的壓力,其年複合成長率正以6.8%的速度成長。
受能源效率法規的推動,工業空氣壓縮機離心機組的市場規模預計將在2025年至2030年間增加28億美元。物聯網控制器和預測分析技術正被應用於這兩種技術中,以減少非計劃性停機時間。阿特拉斯·科普柯等原始設備製造商(OEM)目前正將Optimizer 4.0模組整合到其壓縮機組中,用於追蹤負載曲線並推薦節能模式。
到2024年,含油式壓縮機仍將維持成本主導,市佔率將達到63%,而隨著製藥和食品業對污染容忍度的日益嚴格,無油式壓縮機系統將以6.4%的複合年成長率快速成長。受生命週期維護成本降低和廢棄物減少的推動,無油螺桿式工業空氣壓縮機市場預計到2030年將超過140億美元。
新型兩級乾式螺桿與先前的型號相比,能耗降低了13.5%,提高了投資報酬率。 0級認證正在影響採購決策,飲料裝瓶商通常會在競標文件中明確列出認證。
區域分析
到2024年,亞太地區將佔全球銷售額的42%,這主要得益於中國自動化程度的快速提升以及印度生產關聯激勵計劃(PLI)鼓勵企業自行生產空氣。工廠營運商傾向於選擇配備能源回收模組的整合式空氣站,這一趨勢正在重塑資本設備競標。本地組裝與跨國原始設備製造商(OEM)達成技術許可合作,進一步擴大了工業空氣壓縮機市場。
北美受惠於製造業回流和美國能源部能源效率法規,推動了傳統固定速度車輛的淘汰。美國墨西哥灣沿岸的液化天然氣出口終端訂購了數兆瓦級離心式管道,鞏固了該地區在高壓應用領域的優勢。加拿大則專注於低碳氫化合物計劃,增加了無油螺旋輸送機的數量。
中東地區複合年成長率最高,達5.8%,主要受天然氣儲存、石化產品多元化以及大型煉油廠升級改造的推動。儘管原物料價格上漲帶來成本壓力,但由於終端用戶優先考慮噪音合規和碳減排,歐洲的需求仍保持穩定。拉丁美洲和非洲的需求則受到採礦和基礎設施建設週期的影響,呈現暫時性波動,租賃設備填補了計劃缺口,擴大了工業空氣壓縮機的市場規模。
其他福利:
- Excel格式的市場預測(ME)表
- 3個月的分析師支持
目錄
第1章 引言
- 研究假設和市場定義
- 調查範圍
第2章調查方法
第3章執行摘要
第4章 市場情勢
- 市場概覽
- 市場促進因素
- 在亞洲擴建節能型製造設施
- 食品飲料加工產業對無油壓縮機的需求不斷成長
- 對液化天然氣基礎設施投資的快速成長,需要高壓壓縮機
- 政府對工業能源審核的激勵措施有利於變速壓縮機
- 採用乾式螺桿壓縮機的電動車電池超級工廠快速成長
- 中東地區石化廠棕地維修計畫日益增多
- 市場限制
- 鋼材價格波動推高壓縮機物料清單成本結構
- 與低壓應用中的鼓風機替代方案相比,投資回收期更長
- 歐洲更嚴格的噪音排放法規推高了隔音罩的成本
- 新興市場熟練維修人員短缺導致停機時間增加
- 價值/供應鏈分析
- 監管或技術環境
- 投資分析
- 關鍵案例和實施場景
- 波特五力分析
- 供應商的議價能力
- 買方的議價能力
- 新進入者的威脅
- 替代品的威脅
- 競爭對手之間的競爭
第5章 市場規模與成長預測
- 按壓縮機類型
- 正位移
- 旋轉螺桿
- 往復式(活塞式)
- 捲動
- 動態的
- 離心式
- 軸
- 正位移
- 潤滑劑
- 石油泛光
- 無油
- 按額定壓力
- 0~20bar
- 21~100bar
- 超過100巴
- 驅動器/電源獨立
- 電
- 柴油引擎
- 氣體
- 額定功率
- 100千瓦或以下
- 101~500 kW
- 超過500千瓦
- 按最終用途行業分類
- 製造業
- 一般製造業
- 金屬和採礦
- 電子與半導體
- 石油和天然氣
- 上游
- 中游(管道/液化天然氣)
- 下游(純化)
- 發電業務
- 化工/石油化工
- 飲食
- 製藥
- 建造
- 其他(醫療保健、紡織)
- 製造業
- 按地區
- 北美洲
- 美國
- 加拿大
- 墨西哥
- 南美洲
- 巴西
- 阿根廷
- 南美洲其他地區
- 歐洲
- 德國
- 英國
- 法國
- 義大利
- 西班牙
- 北歐國家
- 其他歐洲地區
- 中東和非洲
- 阿拉伯聯合大公國
- 沙烏地阿拉伯
- 南非
- 其他中東和非洲地區
- 亞太地區
- 中國
- 印度
- 日本
- 韓國
- 澳洲
- 亞太其他地區
- 北美洲
第6章 競爭情勢
- 市場集中度
- 策略趨勢
- 市佔率分析
- 公司簡介
- Atlas Copco AB
- Ingersoll Rand Inc.
- Kaeser Kompressoren SE
- Sullair LLC(Hitachi Group)
- Gardner Denver Holdings Inc.
- Siemens Energy AG
- Bauer Kompressoren GmbH
- Doosan Portable Power
- ELGi Equipments Ltd.
- Quincy Compressor LLC
- Fusheng Industrial Co. Ltd.
- Kobe Steel Ltd.
- Hanwha Power Systems
- Boge Kompressoren Otto Boge GmbH & Co. KG
- Aerzen Maschinenfabrik GmbH
- CompAir(UK)Ltd.
- Chicago Pneumatic
- VMAC Global Technology Inc.
- Shanghai Screw Compressor Co. Ltd.
- Kobelco KNW(Industrial Air Compressors)
第7章 市場機會與未來展望
The Industrial Air Compressors market size is estimated at USD 39.48 billion in 2025 and is forecast to reach USD 49.27 billion by 2030, advancing at a 4.53% CAGR.
Rising investments in energy-efficient production lines, rapid LNG infrastructure build-outs and stricter contamination standards are reshaping product preferences in every major end-use sector. Variable-speed technology, oil-free architectures and IoT-enabled monitoring platforms are gaining traction as plant operators balance emission mandates with total cost-of-ownership goals. Regional momentum remains strongest in Asia-Pacific, while the Middle East delivers the fastest growth on the back of large-scale gas projects. At the same time, raw-material price volatility and tighter European noise rules are compressing margins and extending payback periods, prompting redesigns that lower steel content and improve acoustic performance. The Industrial Air Compressors market continues to demonstrate resilience by aligning product innovation with decarbonization policies and shifting industrial footprints.
Global Industrial Air Compressors Market Trends and Insights
Expansion of Energy-Efficient Manufacturing Facilities in Asia
The semiconductor boom lifted Taiwan's fixed-asset spending by 69% in Q4 2024, with electronics plants adopting Class 0 oil-free systems to guard against contamination. Variable-speed drives that trim energy use up to 35% are now baseline specifications across new lines. Multinationals scaling robotics and additive manufacturing in China and India mirror this focus, anchoring long-term volume for the Industrial Air Compressors market.
Rising Demand for Oil-Free Compressors in Food & Beverage Processing
ISO 8573-1 Class 0 has moved from best practice to regulatory requirement in many jurisdictions, pushing processors toward oil-free screws and scrolls. Hitachi Global Air Power's DS280-450 kW launch addresses requests for higher-power oil-free options. Lower maintenance and avoided lubricant disposal are offsetting the upfront premium, reinforcing adoption across developed markets.
Volatile Steel Prices Inflating Compressor BOM Cost Structures
Steel accounts for up to 50% of compressor production cost, exposing OEMs to margin swings when prices spike. European makers implemented multiple list-price rises in 2024 as energy costs fed into steel inputs. Design efforts to cut plate thickness and switch to composites are under evaluation, yet certification hurdles delay widespread relief.
Other drivers and restraints analyzed in the detailed report include:
- Surging Investments in LNG Infrastructure Requiring High-Pressure Compressors
- Government Incentives for Industrial Energy Audits Favoring Variable-Speed Compressors
- Stringent Noise Emission Norms Escalating Enclosure Costs in Europe
For complete list of drivers and restraints, kindly check the Table Of Contents.
Segment Analysis
Positive displacement technology held 76% of the Industrial Air Compressors market share in 2024, reflecting its versatility from general manufacturing to mining. Demand remains stable as rotary screw units balance efficiency and maintenance needs. Dynamic centrifugal compressors, although smaller in volume, are expanding at a 6.8% CAGR as LNG plants and steel mills seek higher flow at consistent pressure.
The Industrial Air Compressors market size for centrifugal units is projected to increase by USD 2.8 billion between 2025 and 2030, supported by energy-efficiency mandates. IoT-enabled controllers and predictive analytics are being embedded across both technologies to lower unplanned downtime. OEMs such as Atlas Copco now bundle Optimizer 4.0 modules with compressor packages to track load profiles and recommend energy-saving modes.
Oil-flooded designs retained cost leadership and 63% share in 2024, yet oil-free systems are advancing at 6.4% CAGR as contamination tolerance narrows in pharmaceuticals and food. The Industrial Air Compressors market size for oil-free screws is on course to climb beyond USD 14 billion by 2030, aided by lower lifecycle maintenance and disposal savings.
Newer two-stage dry screws trim energy use as much as 13.5% versus prior models, improving payback windows. Class 0 certification marketing is influencing purchasing decisions, and beverage bottlers often specify it outright in bid documents.
The Industrial Air Compressor Market Report is Segmented by Compressor Type (Positive Displacement and More), Lubrication (Oil-Flooded, Oil-Free), Pressure Rating (0-20 Bar, 21-100 Bar, Above 100 Bar), Driver/Power Source (Electric and More), Power Rating (>500 KW and More), End-Use Industry (Manufacturing and More), Geography. The Market Forecasts are Provided in Terms of Value (USD).
Geography Analysis
Asia-Pacific contributed 42% of global revenue in 2024, anchored by China's automation surge and India's PLI inducements that encourage in-house air generation. Plant operators favor integrated air stations with energy-recovery modules, a trend reshaping capital-equipment bids. Local assemblers partner with multinational OEMs for technology licensing, further expanding the Industrial Air Compressors market.
North America benefits from reshoring and DOE efficiency rules that spur replacement of legacy fixed-speed fleets. LNG export terminals along the U.S. Gulf Coast order multi-megawatt centrifugal lines, reinforcing regional dominance in high-pressure applications. Canada's focus on low-carbon hydrogen projects adds incremental volume for oil-free screw packages.
The Middle East registers the fastest 5.8% CAGR, driven by gas storage, petrochemical diversification and mega-refinery upgrades. Europe maintains steady demand as end-users prioritize noise compliance and carbon reduction, despite cost pressures from material inflation. Latin America and Africa offer episodic demand tied to mining and infrastructure cycles, with rental fleets bridging project gaps and enlarging the Industrial Air Compressors market footprint.
- Atlas Copco AB
- Ingersoll Rand Inc.
- Kaeser Kompressoren SE
- Sullair LLC (Hitachi Group)
- Gardner Denver Holdings Inc.
- Siemens Energy AG
- Bauer Kompressoren GmbH
- Doosan Portable Power
- ELGi Equipments Ltd.
- Quincy Compressor LLC
- Fusheng Industrial Co. Ltd.
- Kobe Steel Ltd.
- Hanwha Power Systems
- Boge Kompressoren Otto Boge GmbH & Co. KG
- Aerzen Maschinenfabrik GmbH
- CompAir (UK) Ltd.
- Chicago Pneumatic
- VMAC Global Technology Inc.
- Shanghai Screw Compressor Co. Ltd.
- Kobelco KNW (Industrial Air Compressors)
Additional Benefits:
- The market estimate (ME) sheet in Excel format
- 3 months of analyst support
TABLE OF CONTENTS
1 INTRODUCTION
- 1.1 Study Assumptions and Market Definition
- 1.2 Scope of the Study
2 RESEARCH METHODOLOGY
3 EXECUTIVE SUMMARY
4 MARKET LANDSCAPE
- 4.1 Market Overview
- 4.2 Market Drivers
- 4.2.1 Expansion of Energy-Efficient Manufacturing Facilities in Asia
- 4.2.2 Rising Demand for Oil-Free Compressors in Food and Beverage Processing
- 4.2.3 Surging Investments in LNG Infrastructure Requiring High-Pressure Compressors
- 4.2.4 Government Incentives for Industrial Energy Audits Favoring Variable-Speed Compressors
- 4.2.5 Rapid Growth of EV Battery Gigafactories Utilizing Dry Screw Compressors
- 4.2.6 Uptick in Brownfield Revamps of Petrochemical Plants in Middle East
- 4.3 Market Restraints
- 4.3.1 Volatile Steel Prices Inflating Compressor BOM Cost Structures
- 4.3.2 Longer Payback Period Versus Blower Alternatives for Low-Pressure Applications
- 4.3.3 Stringent Noise Emission Norms Escalating Enclosure Costs in Europe
- 4.3.4 Skilled Maintenance Labor Shortages Increasing Downtime in Emerging Markets
- 4.4 Value / Supply-Chain Analysis
- 4.5 Regulatory or Technological Outlook
- 4.6 Investment Analysis
- 4.7 Key Case Studies and Implementation Scenarios
- 4.8 Porter's Five Forces Analysis
- 4.8.1 Bargaining Power of Suppliers
- 4.8.2 Bargaining Power of Buyers
- 4.8.3 Threat of New Entrants
- 4.8.4 Threat of Substitutes
- 4.8.5 Intensity of Competitive Rivalry
5 MARKET SIZE AND GROWTH FORECASTS (VALUE)
- 5.1 By Compressor Type
- 5.1.1 Positive Displacement
- 5.1.1.1 Rotary Screw
- 5.1.1.2 Reciprocating (Piston)
- 5.1.1.3 Scroll
- 5.1.2 Dynamic
- 5.1.2.1 Centrifugal
- 5.1.2.2 Axial
- 5.1.1 Positive Displacement
- 5.2 By Lubrication
- 5.2.1 Oil-Flooded
- 5.2.2 Oil-Free
- 5.3 By Pressure Rating
- 5.3.1 0-20 bar
- 5.3.2 21-100 bar
- 5.3.3 Above 100 bar
- 5.4 By Driver/Power Source
- 5.4.1 Electric
- 5.4.2 Diesel
- 5.4.3 Gas
- 5.5 By Power Rating
- 5.5.1 <=100 kW
- 5.5.2 101-500 kW
- 5.5.3 >500 kW
- 5.6 By End-use Industry
- 5.6.1 Manufacturing
- 5.6.1.1 General Manufacturing
- 5.6.1.2 Metal & Mining
- 5.6.1.3 Electronics & Semiconductors
- 5.6.2 Oil and Gas
- 5.6.2.1 Upstream
- 5.6.2.2 Midstream (Pipeline/LNG)
- 5.6.2.3 Downstream (Refining)
- 5.6.3 Power Generation
- 5.6.4 Chemical and Petrochemical
- 5.6.5 Food and Beverage
- 5.6.6 Pharmaceutical
- 5.6.7 Construction
- 5.6.8 Others (Healthcare, Textiles)
- 5.6.1 Manufacturing
- 5.7 By Geography
- 5.7.1 North America
- 5.7.1.1 United States
- 5.7.1.2 Canada
- 5.7.1.3 Mexico
- 5.7.2 South America
- 5.7.2.1 Brazil
- 5.7.2.2 Argentina
- 5.7.2.3 Rest of South America
- 5.7.3 Europe
- 5.7.3.1 Germany
- 5.7.3.2 United Kingdom
- 5.7.3.3 France
- 5.7.3.4 Italy
- 5.7.3.5 Spain
- 5.7.3.6 Nordics
- 5.7.3.7 Rest of Europe
- 5.7.4 Middle East and Africa
- 5.7.4.1 United Arab Emirates
- 5.7.4.2 Saudi Arabia
- 5.7.4.3 South Africa
- 5.7.4.4 Rest of Middle East and Africa
- 5.7.5 Asia-Pacific
- 5.7.5.1 China
- 5.7.5.2 India
- 5.7.5.3 Japan
- 5.7.5.4 South Korea
- 5.7.5.5 Australia
- 5.7.5.6 Rest of Asia-Pacific
- 5.7.1 North America
6 COMPETITIVE LANDSCAPE
- 6.1 Market Concentration
- 6.2 Strategic Moves
- 6.3 Market Share Analysis
- 6.4 Company Profiles (includes Global level Overview, Market level overview, Core Segments, Financials as available, Strategic Information, Market Rank/Share for key companies, Products and Services, and Recent Developments)
- 6.4.1 Atlas Copco AB
- 6.4.2 Ingersoll Rand Inc.
- 6.4.3 Kaeser Kompressoren SE
- 6.4.4 Sullair LLC (Hitachi Group)
- 6.4.5 Gardner Denver Holdings Inc.
- 6.4.6 Siemens Energy AG
- 6.4.7 Bauer Kompressoren GmbH
- 6.4.8 Doosan Portable Power
- 6.4.9 ELGi Equipments Ltd.
- 6.4.10 Quincy Compressor LLC
- 6.4.11 Fusheng Industrial Co. Ltd.
- 6.4.12 Kobe Steel Ltd.
- 6.4.13 Hanwha Power Systems
- 6.4.14 Boge Kompressoren Otto Boge GmbH & Co. KG
- 6.4.15 Aerzen Maschinenfabrik GmbH
- 6.4.16 CompAir (UK) Ltd.
- 6.4.17 Chicago Pneumatic
- 6.4.18 VMAC Global Technology Inc.
- 6.4.19 Shanghai Screw Compressor Co. Ltd.
- 6.4.20 Kobelco KNW (Industrial Air Compressors)
7 MARKET OPPORTUNITIES AND FUTURE OUTLOOK
- 7.1 White-Space and Unmet-Need
 工業空氣壓縮機市場按產品、類型、類別、功率、冷卻方式、通路和最終用戶產業分類-全球預測,2025-2032年
 2025年全球工業空氣壓縮機市場報告
 工業空氣壓縮機市場-全球產業規模、佔有率、趨勢、機會和預測(按產品、技術、應用、地區和競爭細分,2020-2030 年)
 工業空氣壓縮機市場規模、佔有率、成長分析(按產品類型、設計、壓力、輸出功率、密封類型、冷媒類型、最終用戶產業、地區)- 產業預測 2025-2032
 全球工業空氣壓縮機市場評估:依產品類型、依設計、依冷劑類型、依壓力、依最終用途行業、依地區、機會、預測,2017-2031年
 2024-2028年全球工業空氣壓縮機市場